The US dollar has been a little subdued so far today following solid gains made yesterday in reaction to better than expected US inflation numbers. US CPI for July printed 1.8% on the headline reading, vs 1.7% expected. Meanwhile, the core number came in at 2.2% vs 2.1% expected. However, despite some initial buying, USD remains capped by expectations of further easing from the Fed. The market is pricing in another cut by the October meeting.
Weak German Data Caps EUR
EURUSD has been a little higher against USD so far today. However, the outlook remains bearish given the expectations of easing from the ECB projected for the September meeting. The German data released today has compounded these expectations, with German GDP contracting over Q2. This comes on the back of a raft of weak sentiment data and highlights how severe the turndown has been in the eurozone.
GBP Buoyed By Better Data
GBPUSD has been a little higher against USD today also, buoyed by better than expected data. Following on from labor market data yesterday which showed wage growth having moved to post cycle highs of 3.9%, CPI today came out better than expected for July. Core printed 1.9% vs 1.8% expected and headline printed 2.1% vs 1.9% expected.
Equities Reverse (Again!)
Risk assets have softened again today. Yesterday, equities were buoyed by the unexpected announcement that some of the goods due to be tariffed under the new 10% tariffs due for September 1st, will now be exempt until a later date. SPX500 surged back above 2908.55 on the news though has since reversed and is now testing the level from above once again.
Safe Haven Inflows Return
Safe havens have been higher again today with both JPY and gold rising against USD in light of the pullback in equities. XAUUSD trades 1504.94 last, with price still down off recent highs following the trade tariff delay announcement. USDJPY trades 106.22 last. The rally yesterday took price right back up into the 106.77 level which has held as resistance, for now, turning price lower again.
Crude Rejected At Trend Line
Oil prices have come back under pressure today. Crude rallied strongly yesterday on the US/China trade story with price spiking back up into the bearish trend line from July highs. However, with equities having since come off and the API reporting a further build in US crude stores, price is now trading lower again at 56.19 last. Traders now wait for the headline EIA report later today to confirm the inventories build.
High Betas Under Pressure
USDCAD remains bid today with weakness in oil prices weighing on CAD. The reversal lower yesterday found support once again at the 1.3207 level which has underpinned USDCAD recently, keeping focus on further upside in the near term.
AUDUSD has come under heavy pressure today as risk aversion sweeps markets again, despite yesterday’s tariff delay announcement. For now, it seems the market is waiting on something concrete with regards to trade talks before it can buy into the story, especially in light of how volatile the situation has become. AUDUSD trades .6754 last.
The EUR/USD currency pair is still in a sideways trend. A unidirectional trend is not observed. Currently, the EUR/USD quotes are consolidating. The local support and resistance levels are 1.11600 and 1.11900, respectively. The demand for greenback has risen after positive inflation data in the US. Washington plans to postpone the introduction of 10% tariffs on a number of Chinese imports until December 15. We recommend opening positions from the key levels.
The News Feed on 14.08.2019:
According to preliminary data, Germany’s GDP slowed down by 0.1% (q/q) in the second quarter, which met the market expectations.
Today, investors will also assess the following statistics:
– Preliminary data on Eurozone GDP at 12:00 (GMT+3:00);
– Export and import price indices in the US at 15:30 (GMT+3:00).
Indicators point to the power of sellers: the price has fixed below 50 MA and 100 MA.
The MACD histogram is in the negative zone, which indicates the bearish sentiment.
Stochastic Oscillator is near the oversold zone, the %K line has crossed the %D line. There are no signals at the moment.
Trading recommendations
Support levels: 1.11600, 1.11150
Resistance levels: 1.11900, 1.12200, 1.12450
If the price fixes below 1.11600, the EUR/USD quotes are expected to fall. The movement is tending to 1.11300-1.11000.
An alternative could be the growth of the EUR/USD currency pair to 1.12200-1.12500.
The GBP/USD currency pair
Technical indicators of the currency pair:
Prev Open: 1.20718
Open: 1.20591
% chg. over the last day: -0.09
Day’s range: 1.20447 – 1.20663
52 wk range: 1.2015 – 1.3385
There is an ambiguous technical pattern on the EUR/USD currency pair. The trading instrument is consolidating at the moment. The local support and resistance levels are 1.20450 and 1.20750, respectively. Yesterday, positive data on the UK labor market were published. The British pound is tending to recover after a continuous fall. We recommend monitoring the current information on the Brexit issue. Positions should be opened from the key levels.
At 11:30 (GMT+3:00), a report on inflation will be published in the UK.
Indicators do not give accurate signals: the price has crossed 50 MA.
The MACD histogram is in the negative zone, indicating the bearish sentiment.
Stochastic Oscillator is in the neutral zone, the %K line is above the %D line, which indicates the growth of GBP/USD quotes.
Trading recommendations
Support levels: 1.20450, 1.20150, 1.20000
Resistance levels: 1.20750, 1.21050, 1.21400
If the price fixes above 1.20750, the GBP/USD quotes are expected to correct. The movement is tending to 1.21000-1.21300.
An alternative could be a decrease in the GBP/USD currency pair to 1.20150-1.20000.
The USD/CAD currency pair
Technical indicators of the currency pair:
Prev Open: 1.32322
Open: 1.32228
% chg. over the last day: -0.08
Day’s range: 1.32106 – 1.32306
52 wk range: 1.2727 – 1.3664
The technical pattern is still ambiguous on the USD/CAD currency pair. The loonie is currently consolidating. The local support and resistance levels are 1.32150 and 1.32500, respectively. The positive dynamics of oil quotes support the Canadian dollar. A trading instrument is tending to decline. We recommend opening positions from the key levels.
The news feed on Canada’s economy is calm.
Indicators do not give accurate signals: 50 MA has crossed 100 MA.
The MACD histogram is in the negative zone, but above the signal line, which gives a weak signal to sell USD/CAD.
Stochastic Oscillator is in the neutral zone, the %K line has crossed the %D line. There are no signals at the moment.
Trading recommendations
Support levels: 1.32150, 1.31850, 1.31250
Resistance levels: 1.32500, 1.32750, 1.33100
If the price fixes above 1.32500, the USD/CAD currency pair is expected to grow. The movement is tending to 1.32850-1.33000.
An alternative could be a fall in the USD/CAD quotes to 1.31850-1.31600.
The USD/JPY currency pair
Technical indicators of the currency pair:
Prev Open: 105.266
Open: 106.732
% chg. over the last day: +1.23
Day’s range: 106.273 – 106.767
52 wk range: 104.97 – 114.56
Yesterday, the USD/JPY currency pair kept the support level of 105.100, which caused aggressive purchases. The trading instrument has reached new local highs. The demand for greenback has risen significantly after optimistic inflation data in the US. At the moment, the USD/JPY quotes are consolidating in the range of 106.250-106.750. The USD/JPY currency pair has the potential for further correction after a continuous fall. We recommend paying attention to the dynamics of the US government bonds yield. Positions should be opened from the key levels.
The publication of important economic releases from Japan is not planned.
The price has fixed above 100 MA, which signals the power of buyers.
The MACD histogram is in the positive zone, but below the signal line, which gives a weak signal to buy USD/JPY.
Stochastic Oscillator is in the neutral zone, the %K line is above the %D line, which indicates the bullish sentiment.
Trading recommendations
Support levels: 106.250, 105.650, 105.100
Resistance levels: 106.750, 107.300
If the price fixes above 106.750, further correction of the USD/JPY currency pair is expected. The movement is tending to 107.300-107.500.
An alternative could be a fall in the USD/JPY quotes to 105.800-105.600.
Equity markets got a boost on Tuesday after news emerged that the Trump administration was delaying the tariffs on some Chinese products until December this year.
The Washington administration also cut down on the items that were to face new tariffs from next month. National security, health and safety concerns were cited as the reason behind the move. The news helped to push the US dollar higher on the day.
Euro Slips on USD Strength
The euro eased back as the greenback rose on the day. But overall the common currency remains trading flat. Economic data from the eurozone confirmed that Germany’s final inflation figures rose 0.5% on the month. This was inline with the preliminary/flash CPI estimates.
EURUSD Continues to Maintain the Sideways Range
EURUSD has been trading within the established corridor of 1.1250 and 1.1185. The tight range has led to a consolidation, which could see a breakout in the short term. The bias remains mixed at the moment. To the downside, the lower support at 1.1140 remains the key price level, while to the upside, EURUSD will need to break past 1.1250 in order to confirm the upside to 1.1340.
Sterling Muted to Weak Jobs Report
The pound sterling traded flat on a day that included the monthly jobs report data. Official data from the UK’s Office of National Statistics showed that the average earnings rose 3.7%, matching forecasts. This was up from a revised 3.5% previously. The UK’s unemployment rate rose to 3.9%, from 3.8%.
GBPUSD Continues to Trade Near Bottom
The currency pair initially managed to rise to the key price level of 1.2082. However, multiple attempts to break this level failed. As a result, the sterling was seen trading subdued below the 1.2082 handle. We could see price potentially retesting the previous lows at 1.2026. As long as this low isn’t breached, there could be an upside bias building up.
Gold Slips as Risk Appetite Improves
The precious metal, which attempted to rise to fresh highs earlier this week pulled back. Gold prices were trading weaker, and off the $1500 psychological level. Besides the trade war narrative, US inflation data showed a 0.3% increase in both the headline and the core CPI.
Will Gold Extend Declines?
The precious metal could extend the declines if it fails to hold the 1494 handle. With minor support established here and price already breaking past this level, gold could start to post a correction to the downside. The lower support at 1447.20 will be the likely target in case the correction gains momentum.
This section of our multi-part article regarding current and past central bank actions, we are going to attempt to look at key elements of the past and present to highlight what we believe may turn out to be an incredible “setup” in the global markets.
This setup is almost like a complex chess game where two skilled players battle for control and near the end of the game, one player is left with the King, a Rook, and a Pawn while the other player has a dramatic advantage with stronger chess pieces. Yet, as the game continues, the weaker player is able to remove one or two of the stronger players key pieces and move his pawn to his opponent’s side to recover his Queen – thus altering the dynamic of the game and eventually winning.
This actually happened to me once playing against a friend of mine. My friend was so wrapped up in trying to move my King into checkmate, he left his other pieces open for me to target and remove – while leaving my Pawn untouched. After I had gained a clear advantage by removing his stronger pieces, I cornered his king within an area that allowed me to move my Pawn to his side of the board whereas I regained my Queen. At that point, the game was nearly over for him – and he knew it.
Did the US Fed and global central banks set up a similar type of process in the global economy? We can rephrase this question as did the global central banks inadvertently set up a massive credit/debt problem by attempting to pour capital into the global markets to spark an economic recovery? And did the acquisition of all of this debt/credit setup a “chase after the King” moment where foreign nations failed to understand the underlying risks associated with this move? Have the dynamics of the global markets shifted away from the advantages that were present three to four+ years ago?
So, let’s investigate the data to see what we can find out about what is changing in the markets.
One change that is critical to the understanding of consumer sentiment is the savings rates for consumers. Since the 2008-09 credit market crisis, Americans have started saving more of their income even though rates for savings have dramatically fallen. This is a shift in consumer sentiment that suggests consumers are attempting to put more cash into savings in preparation for some future event.
The Fed expects economic growth rates in the US to run at far lower levels than in 2011 and 2012. With all the capital that has been poured into the global markets, one would think growth rates would be moderately higher or climbing. But we believe the global economy is stuck in a mode where capital is unable to be effectively deployed throughout the globe because of inherent economic failures and processes that prevent future growth. We’ve discussed this in the previous article about how the US and global economies are stuck in a mostly 19th-century mode of operation while attempting to transition into a 21st-century mode of operation. This transition may take another 10 to 20+ year, but it will eventually happen.
Until that transition is completed, expect further bumps in the road as traditional expectations for investment and returns are shattered – forcing a move towards a 21st-century economic revival.
The price of commodities is a perfect example of how the 19th-century economy is purging itself while the new 21st-century economy is searching for a foundation/footing to take root. Oil is a prime example of the 19th-century economic foundation for growth and economic output. Yet in today’s world of solar, green and various other energy sources, Oil has fallen to near $52 ppb recently and could fall as low as $35 to $38 ppb in the future months. Considering Oil was recently above $120 bbp – what the heck happened?
This chart of the Index of All Commodities prices highlights the shift in capital and the shift in the economic mode of operation that is currently taking place. What was an increasing commodities price market in 2005~07 and 2010~12 has now been replaced with a decreasing commodity pricing market. Is this indicative of a collapse in the global economy? In some ways, yes. But we believe this is more indicative of a transitional economic shift away from 19th-century processes and functions and towards a more dynamic 21st century economic model for the globe.
This process, though, will be full of very large price swings, failures, successes, and opportunities for those skilled technical traders that are able to catch the moves and setup as they happen.
Lastly, the US Consumer Price Index chart. Notice how the GREEN highlighted area (from the early 1960s till 2000 were filled with positive CPI results? Notice how that changed in 2000 and how after 2000 the CPI levels fluctuated from positive to negative quite regularly? Now, pay attention to how the expansion of peaks immediately after the 2000 Dot Com bubble burst has been replaced with a contraction of peaks after the 2008-09 credit market crisis. What is causing the CPI to contract in this manner? Why is is that expansion of commodity pricing is unable to expand as it had been going for decades before 2008-09?
The key to understanding all of this is that the expansion prior to 2000 was an expansion fueled by rising wages, income, wealth creation and opportunity from a mature 19th-century economic model. The 1990 to 2000 narrow range in the CPI was related to the “early shift” away from the 19th-century economic mode and into the Dot Com (internet) mode of economic activity (where this new economic model was taking away from brick-and-mortar shopping malls and replacing it with virtual commerce activities. The recovery in 2005 was fueled by moderate quantitative easing in the US as well as a resurgence in more traditional economic functions related to the growth of economic opportunity in foreign nations, Europe and the push to expand digital technology throughout most of the developing world.
Then came the crisis of 2008-09, which was like blowing out 3 pistons of your V8 motor. You may still be able to limp the car around and back home, but you probably have to keep pouring high-octane fuel into it to keep it running and hope it does not blow out another piston or two.
This Custom Smart Cash Index chart is a perfect example of how capital works in the markets. It attempts to avoid risk by reducing exposure to risk events and attempts to pile into an opportunity as security and returns are setup for optimum outcomes.
Notice how in 2008 capital fled the global markets and how it slowly reentered the markets from 2011 to 2015. Pay attention to the dips in this Smart Cash Index and you’ll notice how these dips align with the US Fed and global central bank QE functions. Pay very close attention to the dip in 2015~2016. Why would cash want to avoid risks setting up during this time and what caused the global markets to fear excessive risks then? US Presidential elections – that’s what happened. And what is happening in November 2020? Yup – you guessed it.
Why would risks become so heightened at these times and throughout collapse events and where does capital rush into when these types of events happen?
CONCLUDING THOUGHTS:
In Part IV of this article, we’ll try to answer some of your bigger questions and we’ll explain why we believe an incredible opportunity is setting up for skilled technical traders over the next 24+ months.
Using technical analysis and proven strategies we can follow the market trends and profit from them no matter which the market moves. We bet with the market (the house) and provide entry, target, and stops for all trades we initiate.
NEXT MOVES FOR GOLD, SILVER, MINERS, AND S&P 500
In early June I posted a detailed video explaining in showing the bottoming formation and gold and where to spot the breakout level, I also talked about crude oil reaching it upside target after a double bottom, and I called short term top in the SP 500 index. This was one of my premarket videos for members it gives you a good taste of what you can expect each and every morning before the Opening Bell. Watch Video Here.
I then posted a detailed report talking about where the next bull and bear markets are and how to identify them. This report focused mainly on the SP 500 index and the gold miners index. My charts compared the 2008 market top and bear market along with the 2019 market prices today. See Comparison Charts Here.
On June 26th I posted that silver was likely to pause for a week or two before it took another run up on June 26. This played out perfectly as well and silver is now head up to our first key price target of $17. See Silver Price Cycle and Analysis.
More recently on July 16th, I warned that the next financial crisis (bear market) was scary close, possibly just a couple weeks away. The charts I posted will make you really start to worry. See Scary Bear Market Setup Charts.
The US dollar strengthened against a basket of major currencies. Yesterday, it became known that the US Trade Representative, Robert Lighthizer, and Secretary of the Treasury, Steven Mnuchin, had a phone call with Chinese Vice Premier, Liu He. The officials also agreed to phone again in two weeks. The United States is going to postpone the introduction of tariffs on a number of Chinese goods until December 15. The US President, Donald Trump, likely made this decision not because of success in US-China trade negotiations, but due to pressure from the US companies. The US dollar index (#DX) closed the trading session in the positive zone (+0.45%).
Optimistic economic data supported the US currency. So, yesterday, the core consumer price index was published, which increased by 0.3% in July, while experts expected growth by only 0.2%. Investors are currently expecting additional drivers.
In addition, ambiguous economic data on the UK economy were published yesterday. Thus, the average earnings index + bonus grew by 3.7% in June, as experts expected. Initial jobless claims counted only to 28.0K in July instead of 32.0K. However, the unemployment rate rose to 3.9% in June, while experts forecasted the rate at 3.8%.
The “black gold” prices are falling after a significant increase the day before. Futures for the WTI crude oil are currently testing the $56.35 mark per barrel. At 17:30 (GMT+3:00), US crude oil inventories will be published.
Market Indicators
Yesterday, the bullish sentiment was observed in the US stock markets: #SPY (+1.56%), #DIA (+1.45%), #QQQ (+2.19%).
The 10-year US government bonds yield is at 1.64-1.65%.
The news feed for 2019.08.14:
– Consumer price index in the UK at 11:30 (GMT+3:00); – Preliminary data on Eurozone GDP at 12:00 (GMT+3:00); – Export and import price indices in the US at 15:30 (GMT+3:00).
Sector expert Michael Ballanger draws connections between nefarious non-native species in the natural world and in the world markets.
Invasive species: Any kind of living organisman amphibian (like the cane toad), plant, insect, fish, fungus, bacteria, or even an organism’s seeds or eggsthat is not native to an ecosystem and causes harm. They can harm the environment, the economy, or even human health.
In the 1830s, a creature called the “sea lamprey” was first detected in Lake Ontario after it was able to migrate from the Finger Lakes of upstate New York by way of the Erie Canal, which was constructed in 1825. In the 1800s the Great Lakes fishing industry harvested over 100 million pounds of fish for both domestic consumption and export before this incredibly creepy creature laid virtual waste to the fishery stock. Within one hundred years, the harvest had dwindled to approximately one-third of its peak as the absence of natural predators allowed it to feast on the Great Lakes fisheries with reckless abandon and unopposed execution.
As ugly a species as it was, the sea lamprey was especially efficient in its mission, as tens of millions of pounds of succulent freshwater nutrients was eliminated from the Great Lakes yield because of its unchallenged status as a free-range aggressor.
The first time I saw the famous illustration of Rolling Stone magazine’s famous “vampire squid,” with “its blood funnel attached to the face of humanity” (in reference to Goldman Sachs), I thought of the sea lamprey, attached to the sides of Lake Ontario trout and further thought of the Canadian and American banking cartel, whose influence over Canadian government policy is indisputable.
Then there is the case of the “zebra mussel,” another of the invasive species that are now covering a massive portion of the Great Lakes floors, and that filter most of the phytoplankton from the water. As well as starving the fisheries from the oh-so-vital nutrients that have lived in microscopic freedom since the vast saltwaters dissipated thirty million years ago, they spawned another new form of invader in the form of the “goby,” a fish that was equipped to crack shells of the zebra and quagga mussels, thus enabling a natural predator to arrive. The problem is that both goby and quagga are foreign,and they simply do not belong in these lakes, the largest natural source of fresh water in the world.
It is not only ecosystems that find themselves endangered by invasive species. The global system of finance, commerce and trade used to function largely unencumbered by government policy, which tolerated and, in fact, promoted interference in the ebb and flow if the free market system. The Working Group on Capital Markets, established during the Reagan-Greenspan regime, has metastasized into a massive interventionalist tumor spreading its cancerous reach into all markets foreign and domestic. This is the zebra mussel of the late twentieth century, and its presence continues to be an entity “that is not native to an ecosystem and causes harm.” What began as a mechanism to prevent stocks from crashing is today an invasive instrument of flawed policies, fiscal, monetary and foreign.
Lastly, we have the case of the infamous Asian carp, a bottom-feeding fish that is supplanting the finest-eating food fish in the world, the mighty Canadian pickerel (or walleye, as the Americans would have it). Most of the invasive species that come flooding into our western lakes and rivers did so without the assistance of Mother Nature but rather the ill-planned actions of mariners arriving from Eastern European and Asian locales.
As I was discussing the plight of the Great Lakes fisheries with a learned local lad from a small Canadian town located some fifty miles south of the Sudbury, the site of the largest nickel deposit in the world, I was immediately drawn to his love of home, of his surroundings, of his environment. He explained that his father and grandfather had been raised in the Ontario Northlands and had a deep and unfaltering love for the land which, if treated properly, could and would provide all that was needed for them to live a full, healthy lifealbeit one that was absent any form of fanciful accoutrements or lavish touches. He also explained that it was the arrival of foreign cultures that caused disruptive change, and was quick to add that his choice of the term “foreign cultures” meant no disparagement to anyone of ethnic designation. His reference to “foreign” was meant to address those “not from around here,” but unfortunately (or fortunately), it describes a world ill-equipped to deal with the insertion of invasive people, whose assumptions, expectations and behaviors are, quite simply, “foreign.”
I descend upon this delicate region of debate because it is deeply troubling for those who dwell in places that have had families (or tribes) dominating the landscape for centuries, always in perfect harmony and effortlessly synchronized with the environment. I have been writing for years about the risks that face Canadian (and North American) society, but as the years have passed, and conservative attitudes have been replaced with overbearing liberalism and entitlementism, I have to soften the entry into this hair-trigger debate with allegories and anecdotes that get my point across without offending any person or group that senses anything vaguely resembling an ethnocentric bent.
Forty years of trading in commodities, stocks and bonds have left me with angst far harder to convey than I would ever have imagined possible. The reason is that the investment environment in which I was trained is now dominated by numerous invasive species that plunder and pillage every nook, cranny, and sector, leaving nothing in their wake worthy of effort. Computerized trading utilizing sophisticated algorithmic software is now the Asian carp of order execution, growing in number and size, and forcing historically dominant species (such as human traders) to extinction. The advent of exchange-traded funds (ETFs) inserted quagga mussels across the broad expanse of equity exchanges the world over, such that no trade in any ETF is allowed without the accompaniment of a half-a-penny fee.
However, the singular most insidious event has been the complete and total dominance of the banks in their insatiable appetite for control of all things related to money. In particular, the bullion banks are the “lamprey eel” of global precious metals trading, attaching themselves to all facets of the bullion markets extending to bonds, currencies and, of course, stocks.
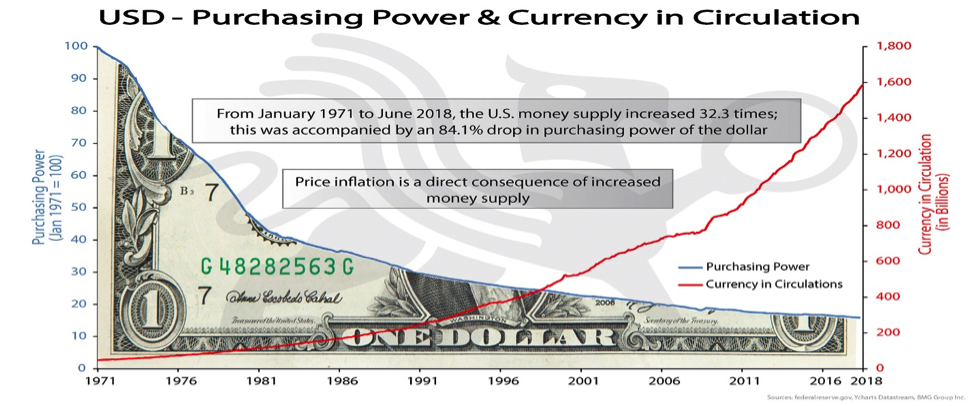
Since the enactment of the Federal Reserve Act of 1913, the banks have been granted unprecedented power over all things related to money and, more importantly, credit. Their debasement policies, designed to aid and abet all things related to banking, have been the sole reason for the reserve currency status of the U.S. dollar. By layering massive tranches of credit on top of one another over the years, they have succeeded in forcing over 65% of all issued credit to be negative-yielding instruments whose practical utility is not only absent, is also insane.
However, just as dark are the skies moments before sunrise, it was in the late 1960s that Canadian and American scientists responded to massive domestic outrage and set out to rid the lakes of these parasites. They first cross-bred brook and lake trout in an effort to control the roe of the lamprey, but after proving unsuccessful (the females could only produce male splake), the researchers developed a lampricide chemical that retarded the development of the hatchlings and was so successful that it reduced the lamprey population by 90% by 1990. Public outrage was so intense that progress came on the backs of the politicians. Votes motivated action and change was the result.
Similarly, after nearly eight years of interference, intervention and suppression, this lamprey of government-condoned management of precious metals prices has finally met with its own chemical predator which is best described in one word: mistrust.
Now, it is my belief that after nearly forty years of government intervention and fictitious reporting of inflation and purchasing power figures, public mistrust is going to trigger political action that will rid the financial ecosystem of parasites of all kinds. Assuming the role of a <i”>bankricide” designed to reduce the growth of financial system parasites such as JPMorgan or Goldman, mistrust would yield dramatic changes in savings rates, purchasing power and living standards as the number and size of the blood funnels are reduced. It is long overdue and badly needed.
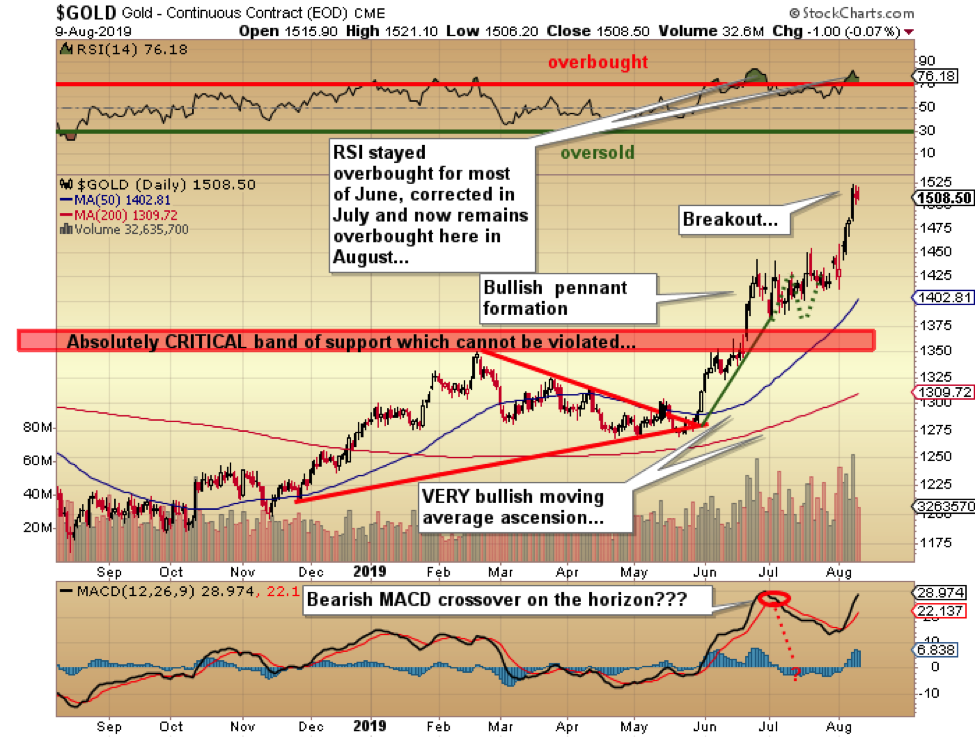
However, for the immediate term, it is no surprise to followers of my work that gold and silver are now in full bull market bloomand are taking the gold and silver miners up with them in what has been a breathtaking ascent. So that you have no doubts, let it be known that I detest those bloggers or commentators that are constantly in need of performance reinforcement by reposting (sometimes multiple times during a day via Twitter or Instagram or Facebook) how “brilliant” they have been. My record is out there and I happily declare that I exited my leveraged ETFs when the RSI (relative strength index) for gold first punched through into the mid-70s, which represented a $26 NUGT at $20 (paid $15) and JNUG at $45, or $9 pre-split (paid $32.50 or $6.50 pre-split). Since the major breakout at $1,375, the RSI for gold has remained elevated, spiking to nearly 90 in June, correcting in July, and now surging to the mid-70s again here in August.
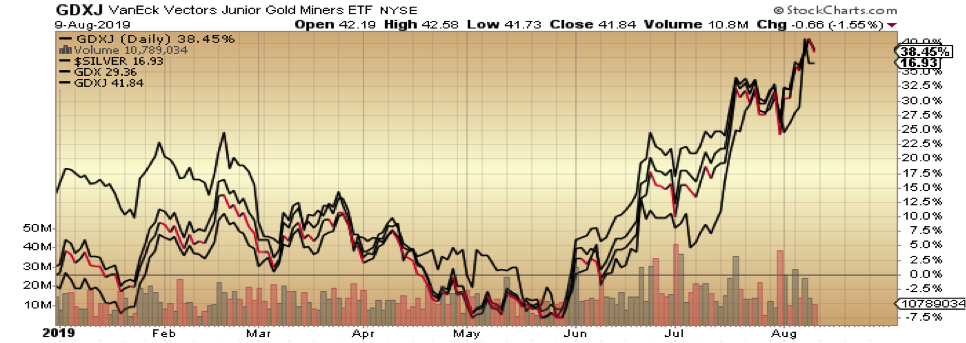
I remain 100% long in the GGMA portfolio, which contains equal parts physical gold (up 38.45% year to date [YTD]); physical silver (up 16.93% YTD); GDX (up 29.36% YTD) and GDXJ (up 41.84% YTD). There is also a 28% cash position from trading profits in GLD and SLV calls, NUGT and JNUG ETFs. The only non-gold holding in the trading account is a 100% position in volatility via the TVIX, bought in July for an ACB (adjusted cost basis) of $14.84 as a proxy for August-September seasonal weakness. It closed at $18.84, up 26.7% in less than a month.
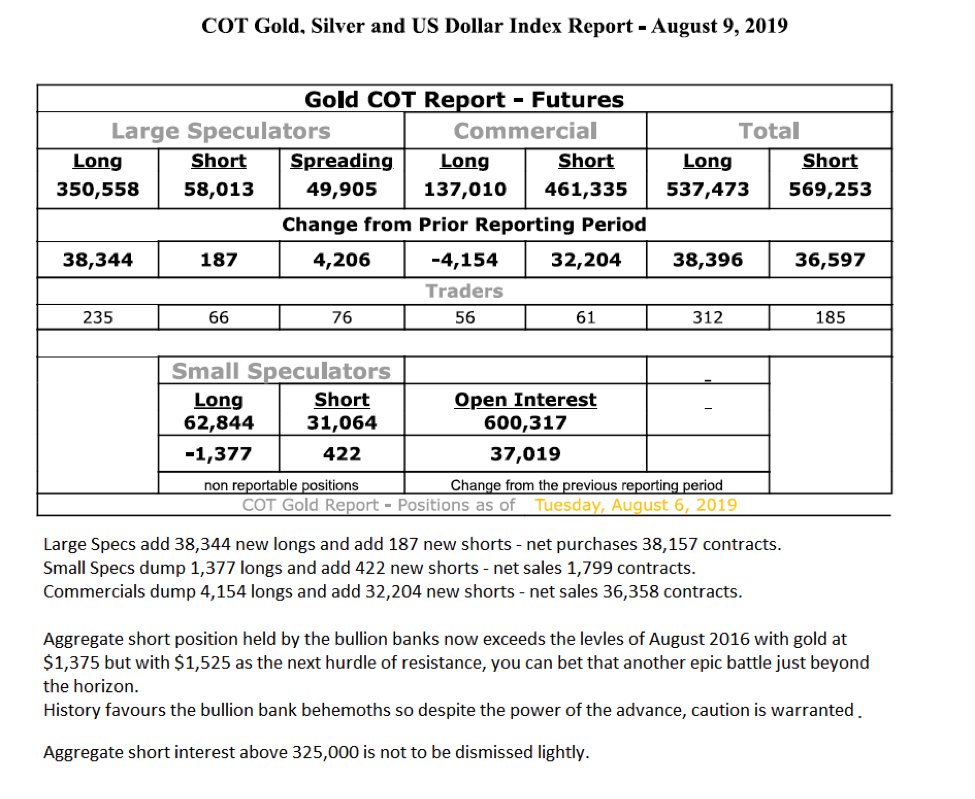
The bad news is that the Commercials are once again going all-out to cap the advances in gold and silver, such that the aggregate short position is now approaching a record 325,000 contracts. The danger lies in the DSI (daily sentiment index) number, now at 95% bulls with managed money and retail piling on.
I am taking 50% positions in GDX and GDXJ off the table this week by selling 25% of both on the opening Monday, and then offering the additional 25% at GDX $30 and GDXJ $43 good through Friday.
It is my lifelong dream that the invasive species of government interventions, price management and Atlas Shrugged-style favoritism is vanquished once and for all by a global mistrust that serves to level the playing field. Whether it is lamprey, goby, zebra mussel or Asian carp, these organisms do not belong in our North American waters and behaviors most foreign to the long-term health and sanctity of free markets can no long be tolerated. Mistrust is the financial and political pesticide of the day, and the larger it grows, the better off we, as a society, will be.
Originally trained during the inflationary 1970s, Michael Ballanger is a graduate of Saint Louis University where he earned a Bachelor of Science in finance and a Bachelor of Art in marketing before completing post-graduate work at the Wharton School of Finance. With more than 30 years of experience as a junior mining and exploration specialist, as well as a solid background in corporate finance, Ballanger’s adherence to the concept of “Hard Assets” allows him to focus the practice on selecting opportunities in the global resource sector with emphasis on the precious metals exploration and development sector. Ballanger takes great pleasure in visiting mineral properties around the globe in the never-ending hunt for early-stage opportunities.
Disclosure: 1) Statements and opinions expressed are the opinions of Michael Ballanger and not of Streetwise Reports or its officers. Michael Ballanger is wholly responsible for the validity of the statements. Streetwise Reports was not involved in any aspect of the article preparation. Michael Ballanger was not paid by Streetwise Reports LLC for this article. Streetwise Reports was not paid by the author to publish or syndicate this article. 2) This article does not constitute investment advice. Each reader is encouraged to consult with his or her individual financial professional and any action a reader takes as a result of information presented here is his or her own responsibility. By opening this page, each reader accepts and agrees to Streetwise Reports’ terms of use and full legal disclaimer. This article is not a solicitation for investment. Streetwise Reports does not render general or specific investment advice and the information on Streetwise Reports should not be considered a recommendation to buy or sell any security. Streetwise Reports does not endorse or recommend the business, products, services or securities of any company mentioned on Streetwise Reports. 3) From time to time, Streetwise Reports LLC and its directors, officers, employees or members of their families, as well as persons interviewed for articles and interviews on the site, may have a long or short position in securities mentioned. Directors, officers, employees or members of their immediate families are prohibited from making purchases and/or sales of those securities in the open market or otherwise from the time of the interview or the decision to write an article until three business days after the publication of the interview or article. The foregoing prohibition does not apply to articles that in substance only restate previously published company releases.
Charts provided by the author.
Michael Ballanger Disclaimer: This letter makes no guarantee or warranty on the accuracy or completeness of the data provided. Nothing contained herein is intended or shall be deemed to be investment advice, implied or otherwise. This letter represents my views and replicates trades that I am making but nothing more than that. Always consult your registered advisor to assist you with your investments. I accept no liability for any loss arising from the use of the data contained on this letter. Options and junior mining stocks contain a high level of risk that may result in the loss of part or all invested capital and therefore are suitable for experienced and professional investors and traders only. One should be familiar with the risks involved in junior mining and options trading and we recommend consulting a financial adviser if you feel you do not understand the risks involved.
On Tuesday the 13th of August, trading on the EURUSD pair closed down. Volatility was high during the European and US sessions. Trading in the US saw the euro drop to 1.1170. This came after reports that Washington is planning to delay the introduction of new tariffs on Chinese goods (specifically mobile phones and computers) until the 15th of December. The announcement came from US Trade Representative Robert Lighthizer.
The dollar also made gains following the publication of a strong consumer inflation report, which exceeded market expectations. The pickup in inflation could provide justification for the Federal Reserve to maintain interest rates at their current level through the end of the year. US CPI in July rose by 0.3% on June’s value, and by 1.8% in annual terms. This was against a MoM forecast of 0.3% and 1.7% YoY.
Day’s news (GMT+3):
11:30 UK: CPI (Jul), retail price index (Jul), PPI (Jul).
12:00 Eurozone: GDP (Q2), employment change (Q2), industrial production (Jun).
17:30 US: EIA crude oil stocks change (9 Aug).
Current situation:
The pair recovered to the upper boundary of the channel as expected. The sharp reversal came as a surprise, but it’s likely that no one was prepared for such news on tariffs from the US. Today, we expect the euro to rise to 1.1211. If the recovery has legs, it should continue to 1.1220.
Why growth, and not decline?
The yuan slipped after weak Chinese data (retail sales and industrial production).
Tension remains over the situation in Hong Kong.
The stochastic is in the buy zone.
The EURUSD pair is still trading within the channel.
We could see a fresh low before the pair starts rising if German and Eurozone GDP data disappoint. We’re also expecting Eurozone data on industrial production and employment. UK CPI will come out a bit earlier. So, today, we’re expecting to see the pair move against the decline saw in yesterday’s US session. This scenario will not play out if the hourly candlestick closes below 1.1155.
The gloomy mood across financial markets instantly brightened after the US Trade administration (USTR) announced that it will remove some items from its target list and delay 10% tariffs on certain Chinese goods until December.
This unexpected development has the potential to stimulate risk appetite in the near-term while reviving hopes of the two largest economies in the world eventually finding some middle ground on trade. Although market sentiment is seen improving further as optimism rises over China and the United States resuming trade talks in two weeks, investors should remain cautious. It is worth keeping in mind that the United States is still moving forward with 10% tariffs on much of the $300 billion in Chinese imports first disclosed in May. Should tensions return before the scheduled talks in two weeks, risk aversion could make an unwelcome return.
Chinese Yuan roars back to life
A return of risk appetite injected the offshore Yuan with enough inspiration to steamroll the Dollar, gaining roughly 1.25% during Tuesday’s trading session.
The USDCNH tumbled back towards the 7.00 level as easing trade tensions boosted investor appetite for the Chinese Yuan. Appetite towards the currency is set to be influenced by the pending industrial production and retail sales data from China on Wednesday. Should the set of reports meet or exceed market expectations, the offshore Yuan has the potential to extend gains against the Dollar.
Oil rides higher on easing trade tensions
Oil bulls wasted no time in shifting to higher gear following the Trump administration’s unexpected pull-back from a hardline stance on Chinese trade.
Oil prices rallied roughly 5% on Tuesday and have scope to extend gains as easing trade tensions reduce fears over slowing global growth and faltering demand for Crude. The sense of positivity rippling across markets is also supporting appetite for WTI Crude with prices trading around $56.70 as of writing. A daily close above $57.00 should encourage a move higher towards $57.50.
Commodity spotlight – Gold
Gold depreciated almost $50 on Tuesday as investors re-found their lost appetite for riskier assets.
The precious metal tumbled from the $1535 six year high after the United States surprised markets by delaying tariffs on some Chinese goods. While Gold is seen extending losses in the near term amid the risk-on mood, the precious metal remains bullish in the medium to longer term. For as long as geopolitical tensions, Brexit uncertainty and central banks across the globe continue easing monetary policy, Gold bulls remain in control.
Technical traders will continue to monitor how prices behave above the $1485 level. A breakdown below this point may open a path back towards $1470.
Disclaimer: The content in this article comprises personal opinions and should not be construed as containing personal and/or other investment advice and/or an offer of and/or solicitation for any transactions in financial instruments and/or a guarantee and/or prediction of future performance. ForexTime (FXTM), its affiliates, agents, directors, officers or employees do not guarantee the accuracy, validity, timeliness or completeness, of any information or data made available and assume no liability as to any loss arising from any investment based on the same.
Today, our focus will be on the UK inflation rate and the GBP/USD. After the currency pair closed last week at its lowest levels since the 1980’s, chances are good that the currency pair will sustainably drop below 1.2000.
This is especially true if inflation comes in below expectations around 1.9%, potentially resulting in rising speculations and expectations of a rate cut from the Bank of England.
Beside rising uncertainty in regards to the Brexit, disappointing economic data is currently weighing on Pound Sterling. Last Friday, GDP data came in weaker than expected, showed that the British economy contracted in Q2/2019. And it does not seem as if we get to see a turnaround here: so far, the course from new UK prime minister Boris Johnson hasn’t changed and chances are elevated that the UK will leave the EU without a deal.
In addition to global trade war fears driven by a further escalation in the trade dispute between the US and China, and more and more central banks around the globe starting new easing cycles in anticipation of a global economic downturn, it only seems a matter of time when the BoE will join with a rate cut itself, especially after the BoE already cut the forecast for 2019 to 1.3% from 1.5%, and its forecast for 2020 to 1.3% from 1.6% with a note that it will likely be lower in case of a no-deal Brexit.
That said, a reading below expectations will likely push GBP down on a broad front, and thus the GBP/USD below 1.2000.
On the other hand: a surprise, higher-than-expected reading could at least result in a short-term bounce higher and towards 1.2350/2400 since the latest CoT data last Friday showed the highest net-short position in Pound Sterling Futures since the beginning of 2017, this the Pound Short trade being a little crowded and vulnerable to a squeeze due to surprising data releases:
Source: Admiral Markets MT5 with MT5-SE Add-on GBP/USD Daily chart (between May 14, 2018, to August 13, 2019). Accessed: August 13, 2019, at 10:00pm GMT – Please note: Past performance is not a reliable indicator of future results, or future performance.
In 2014, the value of the GBP/USD fell by 5.9%, in 2015, it fell by 5.4%, in 2016, it fell by 16.3%, in 2017, it increased by 7.4%, in 2018, it fell by 5.6%, meaning that after five years, it was down by 22.9%.
Discover the world’s #1 multi-asset platform
Admiral Markets offers professional traders the ability to trade with a custom, upgraded version of MetaTrader 5, allowing you to experience trading at a significantly higher, more rewarding level. Experience benefits such as the addition of the Market Heat Map, so you can compare various currency pairs to see which ones might be lucrative investments, access real-time trading data, and so much more. Click the banner below to start your FREE download of MT5 Supreme Edition!
Disclaimer: The given data provides additional information regarding all analysis, estimates, prognosis, forecasts or other similar assessments or information (hereinafter “Analysis”) published on the website of Admiral Markets. Before making any investment decisions please pay close attention to the following:
This is a marketing communication. The analysis is published for informative purposes only and are in no way to be construed as investment advice or recommendation. It has not been prepared in accordance with legal requirements designed to promote the independence of investment research, and that it is not subject to any prohibition on dealing ahead of the dissemination of investment research.
Any investment decision is made by each client alone whereas Admiral Markets shall not be responsible for any loss or damage arising from any such decision, whether or not based on the Analysis.
Each of the Analysis is prepared by an independent analyst (Jens Klatt, Professional Trader and Analyst, hereinafter “Author”) based on the Author’s personal estimations.
To ensure that the interests of the clients would be protected and objectivity of the Analysis would not be damaged Admiral Markets has established relevant internal procedures for prevention and management of conflicts of interest.
Whilst every reasonable effort is taken to ensure that all sources of the Analysis are reliable and that all information is presented, as much as possible, in an understandable, timely, precise and complete manner, Admiral Markets does not guarantee the accuracy or completeness of any information contained within the Analysis. The presented figures refer that refer to any past performance is not a reliable indicator of future results.
The contents of the Analysis should not be construed as an express or implied promise, guarantee or implication by Admiral Markets that the client shall profit from the strategies therein or that losses in connection therewith may or shall be limited.
Any kind of previous or modeled performance of financial instruments indicated within the Publication should not be construed as an express or implied promise, guarantee or implication by Admiral Markets for any future performance. The value of the financial instrument may both increase and decrease and the preservation of the asset value is not guaranteed.
The projections included in the Analysis may be subject to additional fees, taxes or other charges, depending on the subject of the Publication. The price list applicable to the services provided by Admiral Markets is publicly available from the website of Admiral Markets.
Leveraged products (including contracts for difference) are speculative in nature and may result in losses or profit. Before you start trading, you should make sure that you understand all the risks.
US stock indexes rebounded on Tuesday as US Trade Representative announced delays for 10% tariffs earlier announced by President Trump on August 1 on Chinese goods worth $152 billion until mid-December. The S&P 500 rebounded 1.5% to 2926.32. Dow Jones industrial advanced 1.4% to 26279.91. The Nasdaq rallied 2.0% to 8016.36. The dollar strengthening resumed as inflation in July over the past 12 months climbed to 1.8% from 1.6%: the live dollar index data show the ICE US Dollar index, a measure of the dollar’s strength against a basket of six rival currencies, gained 0.4% to 97.82 and is higher currently. Stock index futures point to lower market openings today
CAC 40 leads European indexes recovery
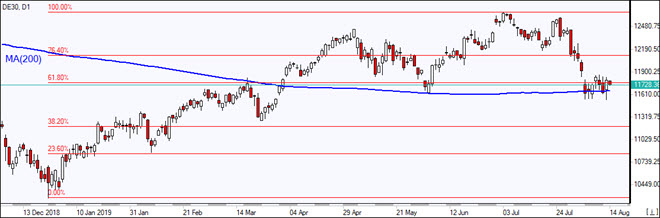
European stocks recovered on Tuesday despite worsening in German economic sentiment. Both the EUR/USD and GBP/USD declined yesterday and both pairs are little changed currently. The Stoxx Europe 600 ended 0.6% higher led by autos and basic resources shares. The German DAX 30 gained 0.6% to 11750.13 despite a slump to -44.1 in German ZEW indicator of economic sentiment for Germany in August from -24.5 in July. France’s CAC 40 rose 1%. UK’s FTSE 100 added 0.3% to 7250.90.
Nikkei leads Asian indexes recovery
Asian stock indices are in green today as the Office of the US Trade Representative said it would delay tariffs on some consumer goods including cell phones and clothes. Nikkei rose 1% to 20655.13 despite resumed yen climb against the dollar. Chinese stocks are gaining despite a report China’s industrial output growth slowed in July: the Shanghai Composite Index is up 0.5% and Hong Kong’s Hang Seng index is 0.3% higher. Australia’s All Ordinaries Index rebounded 0.4% despite Australian dollar’s move higher against the greenback.
Brent futures prices are retreating today. The American Petroleum Institute late Tuesday report indicated US crude inventories rose by 3.7 million barrels last week. Prices however rose yesterday: October Brent rallied 4.7% to $61.30 a barrel on Tuesday. Today at 16:30 CET the Energy Information Administration will release US Crude Oil Inventories.
Note: This overview has an informative and tutorial character and is published for free. All the data, included in the overview, are received from public sources, recognized as more or less reliable. Moreover, there is no guarantee that the indicated information is full and precise. Overviews are not updated. The whole information in each overview, including opinion, indicators, charts and anything else, is provided only for familiarization purposes and is not financial advice or а recommendation. The whole text and its any part, as well as the charts cannot be considered as an offer to make a deal with any asset. IFC Markets and its employees under any circumstances are not liable for any action taken by someone else during or after reading the overview.