Euro-zone retail sales fell in July. Will the EURUSD continue rising?
A look at the price chart on 1-hour timeframe shows EURUSD: H1 is trading sideways. The price is above the 50-period moving average MA(50) which is rising. And the RSI is reaching the overbought zone. There is no trend yet formed, traders have to decide when would be a best time to enter the market.
French private business sector expansion was better than expected. Will the FR40 advance continue?
Recent French economic data were better than expected after weak June industrial production and balance of trade data: manufacturing sector expansion resumed in August, and services sector expansion picked up pace according to final reading of Markit’s manufacturing and services PMIs. Output and new orders rebounded in manufacturing, and new business grew in services sector at the strongest pace in nine months. These contributed to accelerating of expansion in private sector activity, as evidenced by increase of Markit’s composite PMI to 52.9 from 51.9 in July. Positive French data are bullish for FR40.
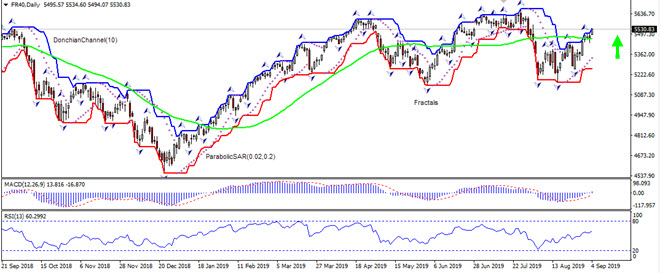
On the daily timeframe FR40: D1 is retracing higher after hitting 3-month low in the end of May, and has risen above the 50-day moving average MA(50).
The Donchian channel indicates uptrend: it is tilted up.
The MACD indicator is above the signal line with the gap widening. This is a bullish signal.
The RSI oscillator is above 50 level but has not reached overbought zone.
We believe the bullish momentum will continue after the price breaches above the upper Donchian boundary at 5501.51. This level can be used as an entry point for placing a pending order to buy. The stop loss can be placed below the lower fractal at 5259.98. After placing the pending order the stop loss is to be moved every day to the next fractal low, following Parabolic signals. Thus, we are changing the expected profit/loss ratio to the breakeven point. If the price meets the stop-loss level (52159.98) without reaching the order (5501.51) we recommend cancelling the order: the market sustains internal changes which were not taken into account.
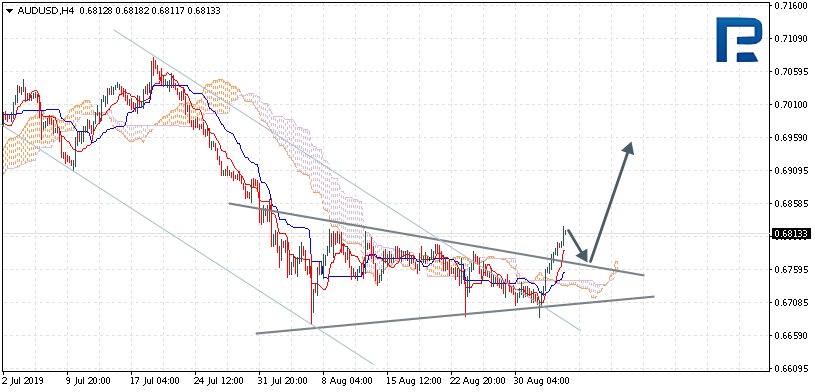
AUDUSD is trading at 0.6813; the instrument is moving above Ichimoku Cloud, thus indicating an ascending tendency. The markets could indicate that the price may test Tenkan-Sen and Kijun-Sen at 0.6765 and then resume moving upwards to reach 0.6960. Another signal to confirm further ascending movement is the price’s rebounding from Triangle’s upside border. However, the scenario that implies further growth may be canceled if the price breaks the cloud’s downside border and fixes below 0.6695. In this case, the pair may continue falling towards 0.6595.
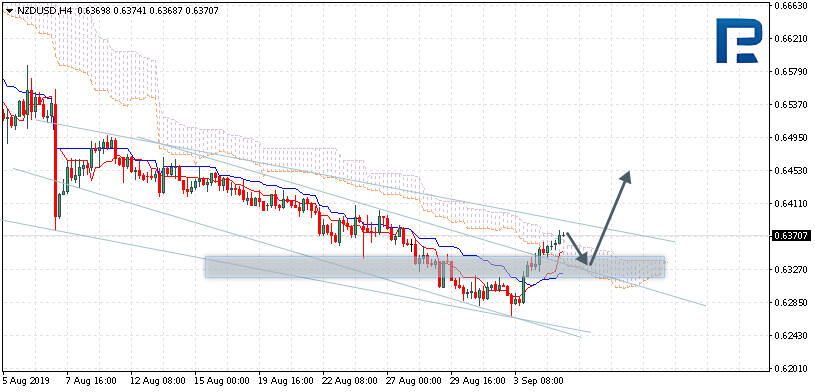
NZDUSD, “New Zealand Dollar vs US Dollar”
NZDUSD is trading at 0.6370; the instrument is moving above Ichimoku Cloud, thus indicating an ascending tendency. The markets could indicate that the price may test the cloud’s downside border at 0.6330 and then resume moving upwards to reach 0.6455. Another signal to confirm further ascending movement is the price’s rebounding from the descending channel’s upside border. However, the scenario that implies further growth may be canceled if the price breaks the cloud’s downside border and fixes below 0.6280. In this case, the pair may continue falling towards 0.6195.
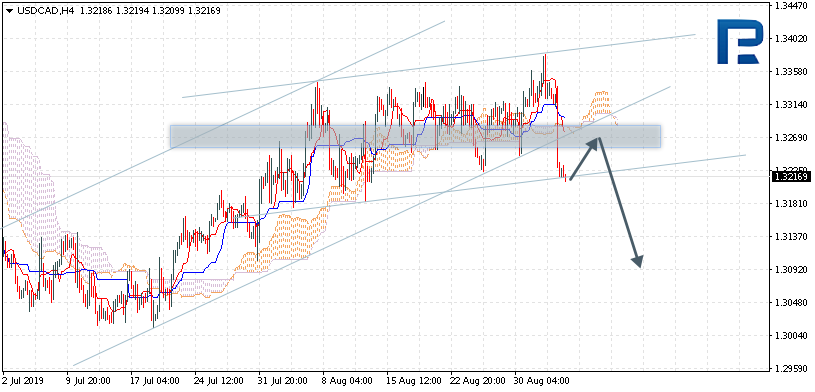
USDCAD, “US Dollar vs Canadian Dollar”
USDCAD is trading at 1.3216; the instrument is moving below Ichimoku Cloud, thus indicating a descending tendency. The markets could indicate that the price may test Tenkan-Sen and Kijun-Sen at 1.3265 and then resume moving downwards to reach 1.3095. Another signal to confirm further descending movement is the price’s rebounding from the rising channel’s downside border. However, the scenario that implies further decline may be canceled if the price breaks the cloud’s upside border and fixes above 1.3365. In this case, the pair may continue growing towards 1.3450.
Attention! Forecasts presented in this section only reflect the author’s private opinion and should not be considered as guidance for trading. RoboForex LP bears no responsibility for trading results based on trading recommendations described in these analytical reviews.
As we can see in the H4 chart, USDCHF is moving above 1/8. In this case, the pair may continue growing towards the resistance at 3/8. However, as long as the price is trading below 1/8, the instrument is expected to continue falling towards 0/8.
In the M15 chart, the pair may break the upside line of the VoltyChannel indicator and, as a result, move upwards to reach 3/8 from the H4 chart..
XAUUSD, “Gold vs US Dollar”
As we can see in the H4 chart, XAUUSD is still moving inside the “overbought area”. In this case, the price is expected to break +1/8 and then continue falling to reach the support at 7/8. However, this scenario may no longer be valid if the price breaks +2/8. After that, the levels on the chart will be redrawn.
In the M15 chart, the pair may break the downside line of the VoltyChannel indicator and, as a result, start a new decline.
Attention! Forecasts presented in this section only reflect the author’s private opinion and should not be considered as guidance for trading. RoboForex LP bears no responsibility for trading results based on trading recommendations described in these analytical reviews.
USD weakened yesterday against the majors. The USD closed in the negative zone (-0,56%). The pressure on USD is caused by the stream of weak economic reports. For example, the US trading balance saldo lowered in June by 54B USD while the experts expected a descend by 53,50B. The investors are in a negative mood due to the lack of progress in the US/China relationships.
However, today the financial market participants are in a better mood since both China and US are willing to continue negotiations in October. Until the negotiations begin, the leaders will remain in touch to make the negotiations most productive. Both sides want a positive outcome.
GBP strengthened against the USD since the lawmakers of the British government approved the bill to prevent Boris Johnson from leaving the US without a deal, and later refused the additional elections in October proposed by the PM. This bill officially obliges Johnson to request an extension of Brexit until both sides arrive to an acceptable bill.
The Bank of Canada finalized the key interest rate. The regulator kept the indicator at the same level of 1.75%, as expected.
The prices on oil are consolidating after a sharp growth. Right now the WTI futures are testing the mark of 56.15 USD/barrel. At 18:00 (GMT+3:00) the US will publish the report on the crude oil inventories.
Market Indicators
The US stock markets are in a bullish mood: #SPY (+1,14%), #DIA (+0,96%), #QQQ (+1,44%).
The US Treasury 10-year obligations slightly grew in value. Right now the indicator is at 1.50-1.51%.
The non-manufacturing PMI from the Institute of Supply Management will be coming out later today.
According to the estimates from economists, the non-manufacturing sector or the services sector is set to rebound from the declines in July.
For the month of August, the non-manufacturing index is forecast to rise to 54.1. This marks a modest increase after the index fell to 53.7 the month before.
ISM Non-manufacturing PMI
The services sector has been holding up fairly well compared to the manufacturing sector. Still, the recent trends indicate that momentum is slowing there too. In July, the ISM non-manufacturing sector slid to a three-year low.
The declines were mostly due to the escalating trade war. A slowdown in the services sector could spell trouble due to the fact that the US economy is heavily dependent on the services or non-manufacturing sector.
According to ISM, the services or the non-manufacturing sector accounts for 88% of the GDP, compared to just 12% from the manufacturing sector.
The respondents from the July survey, however, said that despite some hiccups, business is expected to grow into the second half of the year. More than 50% of the sectors participating in the survey gave an optimistic picture of the economy.
ISM NMI PMI – Sectors to Focus On
The data from July pointed to some nervousness in the construction, retail, and mining sectors. All the three sectors reported headwinds.
For the construction sector, the tariffs were squarely blamed with customers looking for more discounts due to the fluctuations in the mortgage rates. Meanwhile, the oil and gas industry were also treading cautiously.
The oil and gas services sector has been particularly impacted due to the uncertain global economic outlook. This is evident from the weaker oil prices. The impact of a slowdown threatens the global demand for oil and gas products. As a result, the services sector in the said industry also expects to see some declines.
Finally, the mining sector also cautioned alarm. The mining sector is often capital intensive, the firms in these sectors noted that the industry was quite dependent on China and other Asian markets.
The business activity/production subsector shows the biggest decline, falling 5.1 points in July. This is another aspect to bear in mind when looking at the data for August.
IHS Markit’s flash Services PMI Decline in August
IHS Markit released the flash services PMI report for August. The report was disappointing as the services industry, as measured by Markit, weakened during the month. This was indicative of the July data from ISM.
The flash services PMI rose at the slowest rate in the new orders sub-sector in over a decade. The overall flash composite PMI was down to 50.9, marking a three-month low.
If the data proves to be correct, we could anticipate some declines in the non-manufacturing services sector.
Impact of the Non-Manufacturing PMI Report
The non-manufacturing PMI report will cover the month of August. With this, investors will have a fairly clear picture of the US economy during the first two months of the third quarter.
A slowdown in the services sector during the first two months of the third quarter could potentially see lower estimates on the Q3 GDP. By the end of the second quarter, the quarterly average of the non-manufacturing PMI fell from 57.5 in Q1 to 55.83 in Q2.
Q1
Q2
Q3
Month
PMI
Month
PMI
Month
PMI
Jan
56,7
Apr
55,5
Jul
53,7
Feb
59,7
May
56,9
Aug
54,1
Mar
56,1
Jun
55,1
Sep
Average
57,50
55,83
53,90
Even if the data matches the estimates of 54,1 the third quarter average remains well below Q2 and Q1 average numbers. Thus, in general, we will have to see a stronger headline reading of the NMI PMI in order for any signs of a pickup in growth in the third-quarter period.
Markets were seen rallying modestly after days of uncertainty. The US dollar extended declines for a second consecutive day. The trade gap narrowed in July on the back of weakness in the manufacturing sector. The data underlined the slowing trend among investments in the US. Trade deficit in goods and services fell 2.7% on the month. Traders will be looking at today’s private payroll figures.
Euro Rises on the Back of a Weaker Dollar
The euro currency logged gains on Wednesday as the US dollar turned weaker. Economic data from the eurozone comprised of the retail sales report. Retail sales fell 0.6% on the month in August, matching estimates. Previous month’s data was revised higher to show a 1.2% increase. ECB chief in waiting, Christine Lagarde gave her speech where she pledged to review the ECB’s monetary policies.
EURUSD Testing Resistance
The modest rally in the currency pair saw the euro testing the previously breached support level of 1.1030. It is possible for EURUSD to consolidate sideways. But this is subject to the resistance level holding up. But for the moment, the declines look to be done. Unless the common currency extends losses below the previously established lows, we expect to see a sideways range.
UK Political Uncertainty Keeps Volatility Alive
Rapid developments from the UK on the political front saw the sterling logging gains. The British PM Boris Johnson was met with resistance as lawmakers scramble to block a no-deal Brexit. This is positive for the pound sterling traders as it lowers the odds of a hard Brexit. Lawmakers are also floating the idea of extending the Brexit deadline to January 31st. The news sent GBP to post gains for a second day after slipping to historic lows briefly on Tuesday.
GBPUSD at Risk of a Short-Term Correction
Price action in the currency pair currently shows a hidden bearish divergence. The Stochastics oscillator forms a higher high against a lower high in price. This could result in prices snapping back. GBPUSD can test the lower support at 1.2082 in the near term. If the declines stall at this support, there is scope for GBPUSD to maintain the upside bias.
Gold Turns Flat as Risk Sentiment Improves
The precious metal was trading flat near six-year highs on Wednesday. Improving investor sentiment saw the safe-haven staying muted. The positive reaction came amid receding tensions in Hong Kong. But the China and US trade narrative still remains in the background. However, the lack of new remarks or policies from either side gave room for investors to take on more risk.
XAUUSD Likely to Hold Out Near Current Highs
Price action in XAUUSD could remain in a holding pattern ahead of key economic releases today. The ADP private payrolls report is due and could be a precursor to Friday’s jobs report. The fact that gold prices are trading near 1544 level indicates that this could turn into resistance in the short term.
On Wednesday the 4th of September, trading on the euro closed up. The single currency’s rise was helped along by several factors: a broadly weaker dollar, reduced tensions in Hong Kong, and improved political situations in Italy and the UK.
The market’s appetite for risk has increased in today’s Asian session following the publication of Chinese PMI data. The pound has recovered from its low point following a vote in parliament. The House of Commons debated a bill that could delay the UK’s departure from the EU by forcing the government to seek an extension.
Italian Prime Minister Giuseppe Conte has reached a deal on forming a new coalition government. The day ended with news that Hong Kong leader Carrie Lam has officially announced the withdrawal of the extradition bill that sparked the protests.
17:00 US: ISM non-manufacturing PMI (Aug), factory orders (Jul).
18:00 US: EIA crude oil stocks change (30 Aug).
Current situation:
The pair rose to the 67th degree as expected. The news even sent it past this mark to reach the 90th degree. After a correction to 1.1017, the pair recovered to 1.1035. The bulls are preparing to push on higher to the 112th degree at 1.1060. There are no technical barriers to achieving this. The U3 MA line runs through 1.1099. The pair could make it this far if the dollar continues its downward correction against the majors.
High volatility is expected in today’s US session with the release of employment data. Ahead of the payrolls report, there are a lot of important statistics being released that could have an effect on market sentiment as well as US bond yields.
September 5, 2019 – Limassol, Cyprus – RoboMarkets, a European investment company, which provides financial services to clients from many countries of the EU, has added more than 1,000 new instruments to R Trader platform and significantly improved the functionality of the terminal and Trading Robots builder.
More than 1,000 new instruments are already available to RoboMarkets clients in multi-asset platform R Trader. The complete list, which consists of more than 11,700 instruments, now includes CFDs on stocks of the companies placed on American stock exchanges Nasdaq and NYSE. A lot of new instruments will be added automatically during the IPO.
Apart from the addition of new instruments, R Trader now offers several new features, such as saving layouts on the server, a new appearance of trading windows, a new type of indicator (Heiken Ashi), sorting in Watchlists, and exporting backtest results in Strategy Builder in CSV format.
Kiryl Kirychenka, the head of R Trader project, is commenting: “Interest to the stock market among RoboMarkets clients has been steadily increasing for the last few years and we respond to this tendency by developing our trading solutions and providing access to a wide range of assets. With this update, we not only added a pool of new trading instruments but also introduced several new features to the platform, which will surely be appreciated by our clients”.
You can read more information about these new features on RoboMarkets website.
About R Trader
R Trader is a result of cooperation between RoboMarkets and UMSTEL, a fin-tech company that develops a “cloud” multi-asset trading platform. R Trader platform provides access to trade 8 types of assets and more than 11,700 trading instruments. The platform is very convenient and easy to use and guarantees the maximum transparency of all trading operations, while its functionality matches the leading desktop platforms. More detailed information about the platform can be found at www.robomarkets.com.
About RoboMarkets
RoboMarkets is an investment company with the CySEC license No. 191/13. RoboMarkets offers investment services in many European countries by providing traders, who work on financial market, with access to its proprietary trading platforms. More detailed information about the Company’s products and activities can be found on the official website at www.robomarkets.com.
Risk appetite has been given a boost on several fronts: the US and China have officially agreed to resume trade talks in October, while UK Prime Minister Boris Johnson’s willingness towards a no-deal Brexit has been significantly curtailed, after Parliament moved to block a no-deal Brexit occurring on October 31 and also rejected the call for a snap election.
Such developments have given Asian assets cause to lift their heads higher: Asian stocks are a sea of green, while most Asian currencies are strengthening against the US Dollar, with the South Korean Won the runaway leader of the pack gaining about 0.8 percent versus the Greenback.
Safe haven assets are also paring recent gains, with Gold shedding some 0.9 percent, the Japanese Yen weaker by about 0.3 percent against the US Dollar, and 10-year US Treasury Yields spiking above the psychologically-important 1.50 percent level.
Seasoned global investors still cautious over downside risks
Despite the gains in riskier assets, global investors are not getting carried away by this surge in optimism, having been seasoned by the tumultuous developments surrounding the year-long US-China trade conflict as well as the Brexit saga which has dragged on since 2016. The lift in risk sentiment appears mitigated by the concern that the latest positive developments surrounding these macro events (US-China trade conflict, Brexit) may prove fleeting and do not yet fully nullify these downside risks. In order for risk sentiment to push higher, markets will need to be shown further material signs that US and China are indeed drawing closer to a meaningful and lasting trade deal, while the prospects of a no-deal Brexit have to be significantly lowered some more, if not completely snuffed out.
Disclaimer: The content in this article comprises personal opinions and should not be construed as containing personal and/or other investment advice and/or an offer of and/or solicitation for any transactions in financial instruments and/or a guarantee and/or prediction of future performance. ForexTime (FXTM), its affiliates, agents, directors, officers or employees do not guarantee the accuracy, validity, timeliness or completeness, of any information or data made available and assume no liability as to any loss arising from any investment based on the same.