The US dollar has not changed much against a basket of major currencies. The dollar index (#DX) closed with a slight decrease (-0.01%). Support for the US currency had optimistic economic data. Thus, the number of employees in the non-farm sector from ADP increased in August by 195K, while experts expected 148K. The ISM non-manufacturing PMI in the US rose in August to 56.4 instead of the expected value of 54.0. We are expecting labor statistics from the USA and Canada.
The British pound is still growing. The sentiment of financial market participants improved due to a possible delay in the “hard” Brexit. Also, investors continue to monitor the situation around the trade dispute between Washington and Beijing. US and China plan to resume trade negotiations in October.
The black gold prices continue to consolidate. Currently, the WTI crude oil futures are testing the $56.25 per barrel mark.
Market indicators
The bullish sentiment was observed yesterday in the US stock markets: #SPY (+1.29%), #DIA (+1.42%), #QQQ (+1.83%).
The yield on 10-year US government bonds increased significantly. At the moment, the indicator is at the level of 1.58-1.59%.
The news feed on 2019.09.06:
– Preliminary data on GDP in the eurozone at 12:00 (GMT+3:00);
– A report on the US labor market at 15:30 (GMT+3:00);
– Employment change in Canada at 15:30 (GMT+3:00);
– Ivey PMI in Canada at 17:00 (GMT+3:00).
We also recommend paying attention to the speech of the Fed’s head.
The Bureau of Labor Statistics will be releasing the monthly nonfarm payrolls report today. Economists forecast that the payrolls report for August will be a tad softer.
The US unemployment rate is forecast to remain steady at 3.7% in August. This marks an unchanged print from 3.7% in July.
The monthly nonfarm payrolls are forecast to rise in the range of 168k – 159k during the month. This follows a 164k headline print for July, which is subject to revision.
The average hourly earnings continue to remain steady, rising at a pace of 0.3% on the month. This marks the same pace of increase as the month before. On a yearly basis, average hourly earnings remain around the 3.1% – 3.2% range.
US Nonfarm payrolls and unemployment rate
With inflation staying subdued, hourly earnings continue to outpace inflation.
The payrolls data come as the US heads into the Hurricane season. For the moment, the impact of Hurricane Dorian is uncertain on today’s payrolls report.
But depending on the intensity, it is likely that next month’s payrolls could be impacted quite a bit. Therefore, keep an eye out for the September report.
Today’s payrolls report comes ahead of the Fed meeting due in a couple of weeks. Investors have been betting that the central bank will be lowering rates in one of the meetings during the course of the year.
As a result, today’s payrolls report could well come under the scanner.
Will Tariffs Hit the Labor Market?
The US and China trade dispute is something that investors have been looking at. Even in the July report, focus was more on the impact of the higher tariffs. US businesses are expected to take a hit on account of higher tariffs.
The tariffs are expected to cut demand which eventually impacts the pace of hiring.
Trends in the manufacturing sector already signal the slowdown that is widely expected. In July, the payrolls data did little to shape the Fed’s expectations. The central bank lowered interest rates but reminded market participants that it was only an adjustment.
The Trump-administered tariffs of 15% come into effect from this month. As a result, any upside surprise in the August nonfarm payrolls report will likely be brushed aside. Investors will no doubt be keen to see how the labor market fares once the new tariffs come into effect.
Average Earnings Remain Muted
Average earnings will remain one of the key focus points. Hourly earnings have remained steady, neither rising nor falling. But due to the fact that inflation is muted, earnings have managed to put more money into the hands of consumers.
Average Hourly Earnings y/y
Average earnings rose 3.4% on the year late last year. But since then, growth in the earnings has remained muted for the most part. Despite stagnant wage growth, it remains perched near historic highs.
This was evident from the recent personal consumption expenditure report. In July, the PCE rose 0.6%, rising quite significantly. But at the same time, there was a cause for concern. Household income rose just 0.1%.
The data gives a mixed picture overall. For the moment, investors remain somewhat cautious on the economy. But with the economic picture being mixed, it is rather uncertain to expect the economy to lose momentum even further.
Today’s payrolls report is unlikely to move the markets much. Focus will be on the September payrolls report, which could have some impact due to the trade tariffs as well as the hurricanes.
Peter Epstein of Epstein Research outlines the latest from this firm operating in Nevada, which is set to release a PFS in the fourth quarter.
On Aug. 29, Cypress Development Corp. (CYP:TSX.V; CYDVF:OTCQB; C1Z1:FSE) announced the successful completion of the slurry rheology and filtration studies that are an integral part of the prefeasibility study (PFS) for its Clayton Valley clay-hosted lithium project, located immediately adjacent to Albemarle Corp.’s (ALB:NYSE) Silver Peak brine processing facilities in Nevada.
Management believes its U.S. location will become an increasingly valuable attribute. While many junior lithium companies like to name drop “Albemarle” and “Silver Peak,” Cypress owns 100% of one of just a few projects in Nevada that Albemarle might actually be interested in.
More Promising Results from Cypress’ Expert Technical Team
Back to the latest news: The outcome was the result of months of testing by laboratories and a detailed review with consultants and equipment vendors. This news represents a major milestone in the project because the results simplify the process flow sheet.
Cypress CEO Dr. Bill Willoughby commented in the press release, “A critical step for us at Clayton Valley is the separation of solids and liquids. A viable process is dependent upon the ability to separate the process leach solution (PLS) from the leached residue whether by thickeners, filters, or other means. Significant test work has allowed Cypress to identify a commercially viable process, based on filtration, to take the solid-liquid separation from the laboratory benchtop to the operational scale.”
Readers may recall that Cypress released positive results from the first and second phases of its PFS metallurgical program in February and July. Since then, work has continued on other aspects of the PFS, including recovery and concentration of lithium from solution through mechanical evaporation, membrane filtration and ion-exchange processes.
CEO Willoughby continued, “The Cypress technical team discovered the Clayton Valley clays behave differently at varying leach conditions. By looking at the electro-kinetic potential of the clays we can select the optimal reagents and equipment. We also know under what conditions the rheology of the slurries becomes a limitation, and can design the flow sheet accordingly. With this new knowledge, we are confident we can simplify a significant portion of the leaching flow sheet.”
Cypress is looking at additional steps to simplify plant design, with the goal to further streamline the production process and lower costs. With metallurgical and materials handling studies completed, Cypress expects to publish a PFS during the fourth quarter.
Next Major Milestone Is a PFS in the Fourth Quarter
It appears the PFS has been pushed back a few months. After a recent capital raise the company is comfortably funded through delivery of a PFS later this year. Come to think of it, what’s the rush? Investor sentiment remains very weak for lithium, cobalt, vanadium and graphite juniors. As long as Cypress is funded, let them keep carrying out studies to improve the PFS! Below are some highlights from the PEA.
It’s important, at this point, to reiterate the considerable strength of management, the board, technical advisers and retained consultants. All of these impressive people and groups are being effectively led by CEO Willoughby, who has a doctorate in Mining Engineering and Metallurgy from the University of Idaho.
Who on earth could possibly be better to run this show than a PhD in engineering and metallurgy!?! Willoughby knows what he’s doing, and he’s a driving force behind the very good results and progress his technical team is delivering.
I asked Dr. Willoughby about last week’s news, and he said, “It’s a major technical problem to separate ultrafine clays particles less than 5 microns from a leach solution. Our solution could put us in the forefront of clay-hosted lithium projects globally.”
There’s a massive disconnect in the lithium world. For years, demand forecasts have been going up. The demand side of the equationdriven by both energy storage and the electrification of passenger and commercial vehiclesis likely to increase at a compound annual growth rate (CAGR) of at least 15%, perhaps 20% or more. For example, at a 20% CAGR from Albemarle’s 270,000 (270K) tonne figure in 2018, demand would reach 967K tonnes in 2025.
Albemarle has a particularly good graphic depicting this unmistakable trend. Four years ago they expected ~400K tonnes LCE (lithium carbonate equivalent) demand in 2025. Now, Albemarle is forecasting demand of about 1 million tonnes in 2025. Likewise, Lithium Americas Corp. (LAC:TSX; LAC:NYSE) is forecasting between 1.0 to 1.2 million tonnes LCE demand in 2025, a range it says comes from industry producers and publicly reported forecasts.
Finally, Fastmarkets expects LCE demand to grow from ~300K tonnes in 2019 to “at least” 1.1 million tonnes in 2025. So, a lot of forecasts come in and around the one million tonne mark, but even if it turns out to be less, I think it will be a major challenge for supply to approach that level in the next six years.
The longer the project delays in Argentina and Chile brine projects, and the more project mishaps occur, like at Nemaska Lithium Inc. (NMX:TSX; NMKEF:OTCQX), the more room for unconventional projects such as Cypress Development’s Clayton Valley. The market will take every battery-grade tonne of lithium chemicals produced by any company that can supply them. Lithium juniors who can make it across the production finish line will be richly rewarded.
Despite significant fiscal and political challenges in Argentina that could further delay brine projects there, and continued slow movement in project development and production expansions in Chile, unconventional projects are still meaningfully undervalued compared to brine projects.
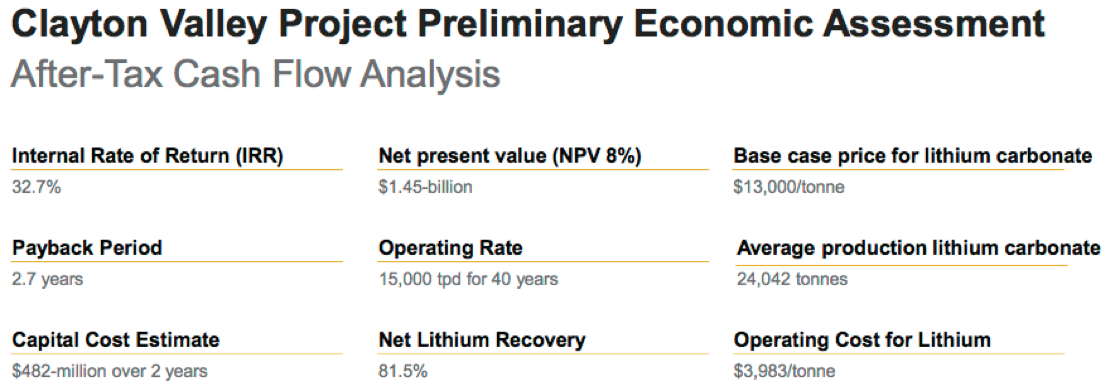
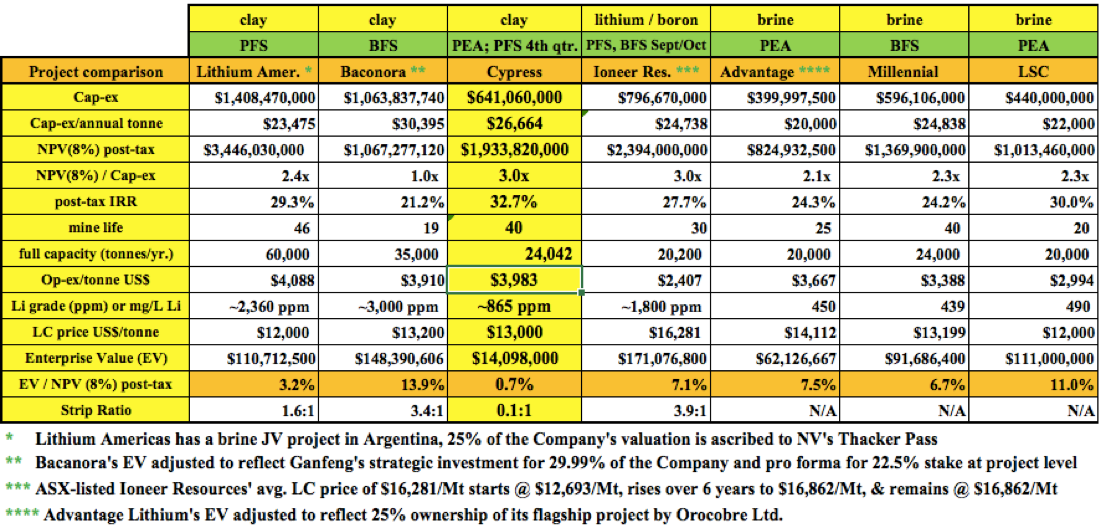
For example, Cypress Development Corp.’s enterprise value (EV) is less than 1% of the after-tax net present value (NPV) found in its PEA. Compare that to the average 8.2% EV/NPV on the chart below. Cypress’ EV/capex ratio of 3.0 times (3.0x) is 40% better than the 2.1x average of the other unconventional projects.
Cypress has the highest after-tax internal rate of return (IRR) on the chart at 32.7%, compared to an average of 26.1% among the others. And the company’s capex, at CA$641 million, is 21% lower than the peer average.
Finally, readers should note that the Clayton Valley project has a strip ratio of 0.1 to 1. The other three projects with strip ratios average 3.0 to 1. Cypress has 1/30th the strip ratio of its unconventional peers!
That’s a big reason why the company has attractive opex and capex, despite having lowe-grade lithium (Li) to work with. Another reason is the mineralogy; the Clayton Valley project’s lithium abundance is hosted in a friendlier clay than that at some of the other projects. Friendlier meaning easier and less costly to liberate the lithium into solution.
The extreme weakness in the vast majority of lithium juniors is actually great news. Great news for any lithium company hopeful that can produce lithium next decade. Great news for investors who may want to average down in their favorite battery metals names.
Brine Projects Have Gone from “Can’t Go Wrong,” to “Can’t Fund”
A funny thing happened over the past two years. Brine projects went from no-brainers (lowest cost, best understood, most reliable) to the exact opposite. Solar evaporation ponds are getting less and less popular by the week, day, hour! And, unusually rainy weather in the Puna region of Argentina has negatively impacted pond yields. Speaking of Argentina. . .well just read the headlines, it’s not pretty.
Chile imposed an onerous sliding-scale royalty on realized lithium prices from production in the Atacama salar. Albemarle’s & SQM’s (SQM:NYSE) best, lowest cost lithium brine operations. . .the world’s best, may no longer the world’s lowest cost.
Brine projects were sure things and clay-hosted lithium projects were, “maybe in 10 years.” Now? Most brine projects are dead in the water, some of them never coming back to life. Even the top-quartile, most advanced projects are not getting funded. By contrast, the prospects for clay-hosted lithium projects are better than they were two years ago, albeit also difficult to fund.
Investors would be crazy not to consider unconventional assets. Brine projects, with evaporation ponds attached, will themselves be unconventional at some point in the future. The only question is when.
In early August, Glencore International Plc (GLEN:LSE) announced it was shutting a major cobalt/copper mine in Africa at the end of the year. Three weeks later, cobalt prices are up 30-35%. It might not take that much to get lithium prices back on an upswing. If prices were to improve, juniors like Cypress Development Corp., trading at under 1% of third-party derived after-tax NPVs, could do quite well.
Peter Epstein is the founder of Epstein Research. His background is in company and financial analysis. He holds an MBA degree in financial analysis from New York University’s Stern School of Business.
Disclosures: The content of this article is for information only. Readers fully understand and agree that nothing contained herein, written by Peter Epstein of Epstein Research [ER], (together, [ER]) about Cypress Development Corp., including but not limited to, commentary, opinions, views, assumptions, reported facts, calculations, etc. is to be considered implicit or explicit investment advice. Nothing contained herein is a recommendation or solicitation to buy or sell any security. [ER] is not responsible for investment actions taken by the reader. [ER] has never been, and is not currently, a registered or licensed financial advisor or broker / dealer, investment advisor, stockbroker, trader, money manager, compliance or legal officer, and does not perform market making activities. [ER] is not directly employed by any company, group, organization, party or person. The shares of Cypress Development Corp. are highly speculative, not suitable for all investors. Readers understand and agree that investments in small cap stocks can result in a 100% loss of invested funds. It is assumed and agreed upon by readers that they will consult with their own licensed or registered financial advisors before making investment decisions.
At the time this interview was posted, Peter Epstein owned shares of Cypress Development Corp., and the Company was an advertiser on [ER].
While the author believes hes diligent in screening out companies that, for any reasons whatsoever, are unattractive investment opportunities, he cannot guarantee that his efforts will (or have been) successful. [ER] is not responsible for any perceived, or actual, errors including, but not limited to, commentary, opinions, views, assumptions, reported facts & financial calculations, or for the completeness of this article or future content. [ER] is not expected or required to subsequently follow or cover any future events & news, or write about any particular company, sector or topic. [ER] is not an expert in any company, sector or investment topic.
Streetwise Reports Disclosure: 1) Peter Epstein’s disclosures are listed above. 2) The following companies mentioned in the article are billboard sponsors of Streetwise Reports: Cypress Development Corp. Click here for important disclosures about sponsor fees. The information provided above is for informational purposes only and is not a recommendation to buy or sell any security. 3) Statements and opinions expressed are the opinions of the author and not of Streetwise Reports or its officers. The author is wholly responsible for the validity of the statements. The author was not paid by Streetwise Reports for this article. Streetwise Reports was not paid by the author to publish or syndicate this article. Streetwise Reports requires contributing authors to disclose any shareholdings in, or economic relationships with, companies that they write about. Streetwise Reports relies upon the authors to accurately provide this information and Streetwise Reports has no means of verifying its accuracy.
4) The article does not constitute investment advice. Each reader is encouraged to consult with his or her individual financial professional and any action a reader takes as a result of information presented here is his or her own responsibility. By opening this page, each reader accepts and agrees to Streetwise Reports’ terms of use and full legal disclaimer. This article is not a solicitation for investment. Streetwise Reports does not render general or specific investment advice and the information on Streetwise Reports should not be considered a recommendation to buy or sell any security. Streetwise Reports does not endorse or recommend the business, products, services or securities of any company mentioned on Streetwise Reports. 5) From time to time, Streetwise Reports LLC and its directors, officers, employees or members of their families, as well as persons interviewed for articles and interviews on the site, may have a long or short position in securities mentioned. Directors, officers, employees or members of their immediate families are prohibited from making purchases and/or sales of those securities in the open market or otherwise from the time of the interview or the decision to write an article until three business days after the publication of the interview or article. The foregoing prohibition does not apply to articles that in substance only restate previously published company releases.
As we go into the weekly close, all eyes will be on the US employment situation, the Non-Farm Payrolls.
After last Tuesday, where the ISM Manufacturing PMI in the US fell to 49.1 in August 2019 from 51.2 in July (and missed market expectations of 51.1 while pointing to the first month of contraction in the manufacturing sector since January 2016 as new orders and particularly employment declining), amid concerns about a further escalation in US-Chinese trade conflict, the outlook for today’s NFPs is not very promising.
What’s particularly interesting now is that on Thursday, headlines made rounds that US and Chinese envoys will meet in early October for more talks aimed at ending the tariff war that threatens global economic growth. With stabilising 10-year US yields, the USD/JPY went for an attack of the region around 106.80/107.00 and seems to go for a try to sustainably recapture it.
That said, our take is: any NFP print which comes in better than expected will likely see USD/JPY bulls push significantly back above 107.00 into the weekly close, taking on further bullish momentum and a stint up to 108.50/109.00 being an option, especially if speculation of a favourable trade deal between the US and China for both sides start to manifest over the next days and weeks.
On the other hand: any disappointing NFP print and/or new “Twitter escalation” from US president Trump such as “Sure, we aim at a favourable deal – for the US! China will pay!” could dampen the hopes and speculation that the US and China will agree on a deal, meaning that yesterday’s push above 107 was a fake out.
A sharper drop below 105.80 could trigger here a wave of further selling and quickly activate the region around 105.00 again:
Source: Admiral Markets MT5 with MT5-SE Add-on USD/JPY Daily chart (between June 7, 2018 to September 5, 2019). Accessed: September 5, 2019, at 10:00pm GMT – Please note: Past performance is not a reliable indicator of future results, or future performance.
In 2014, the value of the USD/JPY increased by 13.7%, in 2015, it increased by 0.5%, in 2016, it fell by 2.8%, in 2017, it fell by 3.6%, in 2018, it fell by 2.7%, meaning that after five years, it was up by 4.1%.
Discover the world’s #1 multi-asset platform
Admiral Markets offers professional traders the ability to trade with a custom, upgraded version of MetaTrader 5, allowing you to experience trading at a significantly higher, more rewarding level. Experience benefits such as the addition of the Market Heat Map, so you can compare various currency pairs to see which ones might be lucrative investments, access real-time trading data, and so much more. Click the banner below to start your FREE download of MT5 Supreme Edition!
Disclaimer: The given data provides additional information regarding all analysis, estimates, prognosis, forecasts or other similar assessments or information (hereinafter “Analysis”) published on the website of Admiral Markets. Before making any investment decisions please pay close attention to the following:
This is a marketing communication. The analysis is published for informative purposes only and are in no way to be construed as investment advice or recommendation. It has not been prepared in accordance with legal requirements designed to promote the independence of investment research, and that it is not subject to any prohibition on dealing ahead of the dissemination of investment research.
Any investment decision is made by each client alone whereas Admiral Markets shall not be responsible for any loss or damage arising from any such decision, whether or not based on the Analysis.
Each of the Analysis is prepared by an independent analyst (Jens Klatt, Professional Trader and Analyst, hereinafter “Author”) based on the Author’s personal estimations.
To ensure that the interests of the clients would be protected and objectivity of the Analysis would not be damaged Admiral Markets has established relevant internal procedures for prevention and management of conflicts of interest.
Whilst every reasonable effort is taken to ensure that all sources of the Analysis are reliable and that all information is presented, as much as possible, in an understandable, timely, precise and complete manner, Admiral Markets does not guarantee the accuracy or completeness of any information contained within the Analysis. The presented figures refer that refer to any past performance is not a reliable indicator of future results.
The contents of the Analysis should not be construed as an express or implied promise, guarantee or implication by Admiral Markets that the client shall profit from the strategies therein or that losses in connection therewith may or shall be limited.
Any kind of previous or modeled performance of financial instruments indicated within the Publication should not be construed as an express or implied promise, guarantee or implication by Admiral Markets for any future performance. The value of the financial instrument may both increase and decrease and the preservation of the asset value is not guaranteed.
The projections included in the Analysis may be subject to additional fees, taxes or other charges, depending on the subject of the Publication. The price list applicable to the services provided by Admiral Markets is publicly available from the website of Admiral Markets.
Leveraged products (including contracts for difference) are speculative in nature and may result in losses or profit. Before you start trading, you should make sure that you understand all the risks.
“Risk-on” mood returns on US-China trade talk hopes
US August jobs report in the spotlight on Friday
Gold suffers biggest daily loss in almost three years
A positive vibe is sweeping across financial markets this morning as renewed hopes for progress in US-China trade negotiations uplift global sentiment and boost investor confidence.
News that Beijing and Washington officials will be holding high level trade talks in early October is certainly raising hopes over the two largest economies in the world finding a middle ground on trade. This optimism is being reflected in Asian markets on Friday with regional shares set to conclude the week on a positive note.
Although the risk-on mood induced by renewed trade hopes will be welcomed by global equity markets in the near term, gains are set to be limited by investor skepticism down the line. Lessons from the past have certainly illustrated the unpredictability of the Trump administration when it comes to trade developments. While trade negotiations are far better than none at all, it would be unwise to be unprepared for another disappointment given the history of past negotiations.
US jobs report to test Fed cut expectations
Friday’s major risk event and potential market shaker will be the US non-farm payroll report for August which will influence expectations over how deep the Federal Reserve will cut interest rates next.
Overall, data from the United States has painted a mixed picture this week with the US manufacturing PMI contracting for the first time in three years to 49.1% in August. However, US private payrolls increased in August at their fastest pace in four months at 195k while the US services industry rebounded last months as private employers boosted hiring.
The non-farm payroll report for August is projected to show an increase of 160k job creation and unemployment rate holding steady at 3.7%. Should the US jobs report meet or exceed market forecasts, this should cool speculation over deep Fed rate cuts, ultimate supporting the Dollar.
Commodity spotlight – Gold
It has not been the best of trading weeks for Gold which suffered its biggest daily loss in almost three years yesterday, shedding over $40 in valuation as risk-on repelled investors from safe haven assets and boosted appetite for riskier investments.
While the precious metal is positioned to weaken further in the near term amid the improving market sentiment, the downside will be limited by core market themes. For as long as global growth concerns, uncertainty over trade and low interest rate across the globe remain key market themes, the outlook for Gold remain bright and encouraging. Where the precious metal concludes this week will be influenced by the US jobs data released on Friday afternoon. A solid jobs reports could hurt Gold bulls as investors revaluate how deep the Federal Reserve will cut interest rates beyond September.
Focusing on the technical picture, Gold is under pressure on the daily charts. Sustained weakness below $1525 should encourage a decline towards $1500 in the near term.
Disclaimer: The content in this article comprises personal opinions and should not be construed as containing personal and/or other investment advice and/or an offer of and/or solicitation for any transactions in financial instruments and/or a guarantee and/or prediction of future performance. ForexTime (FXTM), its affiliates, agents, directors, officers or employees do not guarantee the accuracy, validity, timeliness or completeness, of any information or data made available and assume no liability as to any loss arising from any investment based on the same.
Dollar inched up after stronger than expected ADP report
US stock indexes advance accelerated on Thursday after China’s commerce ministry statement China and US had set a tentative date for “early October” meeting for trade negotiations. The S&P 500 gained 1.3% to 2975.98. The Dow Jones industrial average rose 1.4% to 26728.15. Nasdaq composite index rallied 1.8% to 8116.83. The dollar inched higher as the Automatic Data Processing Inc. reported the private sector added 195,000 jobs in August, above the 150,000 forecast: the live dollar index data show the ICE US Dollar index, a measure of the dollar’s strength against a basket of six rival currencies, edged up less than 0.1% to 98.39 but is lower currently. Stock index futures point to higher openings today.
CAC 40 paces European indexes gains
European stocks extended gains on Thursday as investor sentiment was buoyed by news US and China would resume trade negotiations in early October. Both EUR/USD and GBP/USD continued climbing yesterday with both pairs moving higher currently . The Stoxx Europe 600 index ended 0.7% higher. Germany’s DAX 30 advanced 0.9% to 12126.78. France’s CAC 40 rose 1.1% while UK’s FTSE 100 slid 0.6% to 7271.17 as British lawmakers passed a bill blocking hard Brexit which is expected to pass through the House of Lords, the upper chamber of parliament.
Hang Seng lags Asian indexes gains
Asian stock indices are in green today after a Beijing statement trade negotiations with US would start in October. Nikkei extended gains 0.5% to 21199.57 with yen slowing its slide against the dollar. Chinese shares are rising: the Shanghai Composite Index is up 0.5% and Hong Kong’s Hang Seng Index is 0.4% higher. Australia’s All Ordinaries Index added another 0.5% despite continuing Australian dollar climb against the greenback.
Brent futures prices are edging higher today. Prices advanced yesterday after the Energy Information Administration reported US crude oil inventories fell 4.8 million barrels last week : November Brent crude rose 0.4% to $60.95 a barrel on Thursday.
Note: This overview has an informative and tutorial character and is published for free. All the data, included in the overview, are received from public sources, recognized as more or less reliable. Moreover, there is no guarantee that the indicated information is full and precise. Overviews are not updated. The whole information in each overview, including opinion, indicators, charts and anything else, is provided only for familiarization purposes and is not financial advice or а recommendation. The whole text and its any part, as well as the charts cannot be considered as an offer to make a deal with any asset. IFC Markets and its employees under any circumstances are not liable for any action taken by someone else during or after reading the overview.
Tomorrow we have a series of important data points coming out of the euro area. The most important ones are Employment Change and the final reading of Q2 GDP. The data is likely to affirm expectations for the ECB to start easing during its next meeting.
The euro has been seeing quite a bit of volatility over the last couple of days, primarily driven by geopolitical events. Investors in the eurozone are a bit wary during this period as major institutions transition to new leadership.
The upcoming meeting will be the last for current ECB Chairman Mario Draghi. His successor will be former IMF Chief Christine Lagarde. The European Commission Presidency will transition later in the year.
On the country level, Brexit dominates the news. However, Italy is in the process of forming a new government led by the 5-Star Movement and center-left Democratic Party. Spain hasn’t managed to form a government in months. In fact, most analysts see the country going to general elections again. All these factors can keep investors nervous, besides the major data releases.
What We Are Expecting
We could see the most volatility in the euro pairs tomorrow immediately following the simultaneous release of two major data points: the Employment Change and GDP. The former is likely to get the most attention from the market unless there is a significant change in the growth of the economy.
For Q2 GDP, the consensus of expectations is to affirm the Prelim numbers: quarterly growth of just 0.2% implying an annualized rate of 1.1%. A disappointment of just two decimals on the quarterly figure could be quite significant. This is because that would put the euro area at the risk of a technical recession.
The Environment
The GDP data is coming out just before US Non-Farm Payrolls, which generally gets the market’s attention. Investors are likely to be more hesitant to take positions ahead of the major event. So, we might end up seeing less volatility in response to the data releases.
The primary focus for driving the euro now are the expectations of a resolution to Brexit, and the ECB’s meeting next week. An analyst report mentioned that there were serious considerations to restart QE, with a planned €20B in monthly asset purchases. The idea is that this would support equity markets, which have been depressed since the end of unconventional measures, and weaken the currency.
It’s Not a Done Deal
The last meeting to be presided by Draghi, however, might simply leave everything on hold for another month so the new leadership can take over with a “clean slate”. While, in general, euro area indicators are unsatisfactory, they aren’t significantly worse than they were last month, when the ECB decided to remain on hold.
Lagarde’s confirmation testimony before the EU Parliament drove the markets, particularly when she mentioned that she’d heed concerns about the effects of monetary policy. And several central banks have been expressing worries about an asset bubble. So would the ECB under Largarde be more hawkish? That seems to be a possibility some investors are considering.
GBPUSD rebounds from 3-year low to move above $1.23
UK House of Commons showdown keeps investors on high alert
Boris Johnson set to address nation on Thursday
The dramatic Brexit showdown in Parliament is certainly keeping investors on their toes and injecting Sterling with explosive levels of volatility.
It seems everyone wants a piece of the British Pound after a series of parliamentary votes sabotaged UK Prime Minister Boris Johnson’s attempt to push through a no-deal Brexit on October 31. The currency blasted above $1.23 against the Dollar on Thursday and is set to push higher as Johnson’s triple Commons defeat soothes some fears over Britain crashing out of the EU with no deal in place. However, the upside is poised to face numerous obstacles down the road, especially if a snap election takes place in the next few weeks which could result in Johnson gaining a larger majority.
Given how the Pound remains extremely sensitive to political and Brexit developments, more action will be on the cards this afternoon as Johnson will “speak directly to the public, setting out the vital choices that faces our country”, as said by a Number 10 spokesman.
Another critical part of the intricate Brexit equation will be how the European Union responds to another Brexit delay. EU officials have stated that the latest Brexit negotiations are going nowhere as the UK has not yet presented any “concrete proposal” to replace the Irish backstop. If Brussels simply refuses Johnson’s request for a third extension to Britain’s EU membership, fears of a no-deal Brexit will return with a vengeance, ultimately punishing Sterling.
Taking a look at the technical picture, the Pound is regaining its confidence against the Dollar and other G10 currencies on Thursday. The GBPUSD is staging an incredible rebound on the daily charts with prices trading around 1.2330 as of writing.
While a solid daily close above 1.2300 is seen opening the doors towards 1.2380 and 1.2450, the outlook will be heavily influenced by Brexit drama and UK politics. Should prices fail to break above 1.2380, a move back towards 1.2300 and 1.2250 will be on the table.
Disclaimer: The content in this article comprises personal opinions and should not be construed as containing personal and/or other investment advice and/or an offer of and/or solicitation for any transactions in financial instruments and/or a guarantee and/or prediction of future performance. ForexTime (FXTM), its affiliates, agents, directors, officers or employees do not guarantee the accuracy, validity, timeliness or completeness, of any information or data made available and assume no liability as to any loss arising from any investment based on the same.
An array of positive political developments yesterday and overnight have sparked some risk-on flows that seem to be carried over to today’s session. All FX majors, including EURUSD, GBPUSD, AUDUSD, NZDUSD, and USDCAD have been affected by positive events.
Euro Trouble-Free Above 1.10, But Stuck Near 10 SMA
The European currency remains bid against the US counterpart. Currently above the psychological handle of 1.10, trading near a fresh weekly high. With the Italian coalition forming a new government, it is unlikely that EURUSD is going to fall below the said level, even after the NY open. Unless NY markets take the positive US/China trade-talk developments to heart.
Yesterday, Lagarde’s message for a longlasting accommodative policy didn’t seem to bother euro bulls much. This suggests a stronger eurodollar. That will, of course, also depend on fundamentals. Investors are eying the ADP and ISM NMI releases later today. Whether the 10 SMA on the daily weakens or not will impact also.
Cable Pierces Through 1.22, Investor Eye 1.23
Without a win on the no-deal Brexit vote, Boris Johnson’s strategy to leave the EU by October 31st failed. This is “good news” for the pound. BoJo’s attempt to lock parliamentarians out with a Queen’s Speech finally backfired. This allowed market participants to take a breather and ‘long’ cable.
GBPUSD is currently trading near the psychological 1.2270 level. Without any UK-based data, the pound is likely to remain strong. Otherwise, a pullback can be seen in the short-term in the form of a rejection.
Commodity Assets Up On Carrie Lam’s Move
Aussie, kiwi and perhaps the loonie also keep moving higher this morning on the back of Carrie Lam’s move to withdraw the somewhat catastrophic extradition bill. With risk improving and the dollar falling,AUDUSD crossed above the 68 cent barrier. Furthermore, NZDUSD is also nearing 64 cents, and USDCAD only just received a rejection at the 1.32 mark.
The Canadian dollar is also supported by a rather dauntless BoC and a bid crude oil owed to yesterday’s API report. API reported a small build of 400k compared to 3.5 million barrels expected. This result drove oil nearly $3 higher. BoC on the other hand, held rates unchanged yesterday, citing strong economic growth and a clear path to hit their inflation target.
Equities Soar Again on Risk, Yen and Gold Down
With the market’s appetite shifting, SPX reversed course once again to the upside. However, in the medium-term, the picture is still unclear. Prices are reaching a strong psychological level at 3000.
USDJPY, USDCHF, and Gold are currently taking a beating as capital inflows on riskier assets outweigh the safe-haven demand in large blocks. The Swiss also reported somewhat stagnant GDP figures earlier in the morning (0.3% as expected but lower than 0.4% last), so the weakness could be partially attributed to that set of economic data too.
Both gold and silver are continuing to soar this week. Today’s losses are owed partially to profit-taking, and partially to headlines that the US and China are going to meet for further talks in October.
Safe-haven demand for precious metals increased. This comes despite the yen experiencing a bearish shift from capital inflows in riskier assets.
Despite the de-escalation of the Hong Kong unrest and positive Brexit and Italian politics, XAUUSD and XAGUSD prices seem to be supported by weak economic data.
Metals Likely to Remain Bid Regardless of NFP
Following a week of profit-taking ending September 6, gold and silver found some backing from contractionary US ISM Manufacturing data on Tuesday. XAUUSD marked a third consecutive day in the green on Wednesday. Meanwhile, XAGUSD marked a fourth. This has caused some short-term pullback mainly seen today, Thursday. And traders are pocketing some profits after an amazing run.
Adding to it from a fundamental point of view, Wednesday’s surge came about after comments from the ECB. Upon Europe printing a recessionary retail sales number, IMF Chief and future ECB President Christine Lagarde made comments on longlasting policy accommodation in the euro area.
Furthermore, many economies seem to be crossing into a technical recession. PMI data around the world is diving below the 50 ‘safety’ mark. The one that seems to be holding up firm against effects of the lingering trade war, surprisingly enough, is China.
Although the markets could drastically change tomorrow after the NFP result, traders of both metals are unlikely to step out from longs that easily. And this is due to the fact that Fed might be pushed for two extra cuts in 2019 now should US PMIs remain weak. Consequently, traders are aware of what poor Manufacturing PMI can mean for the employment sector.
XAUUSD Hits April ’13 High Despite Bullish Lag
Gold has been moving along with economic rather than political developments this week. This is contrary to its behavior last week. It’s also been moving on some technicals, of course.
As long as XAUUSD rests above the $1521/oz support the upside potential remains intact. In the quiet possible scenario prices break below the said level, market participants should turn to lower levels as institutions will most probably step in to buy the dips.
The downside potential could send prices down to $1444/oz, provided the expanding flat pattern has wave C to complete.
It remains to be seen whether the multiyear high reached yesterday was indeed a false break. Or simply perhaps a fresh high that is going to lead to more buying. Note that the RSI paints a helpful signal.
XAGUSD Near $20/oz, More Bullish than Gold
The silver breakout above $16.10/oz a few weeks back has brought massive institutional flows, moving parabolically.
Without a divergence or a technical signal appearing on the charts, silver might end up appreciating higher while gold remains in either a consolidation or falls.
The current formation indicates that XAGUSD could find some headwinds at the 2.618% extension near 20.65/oz. Whether a correction will follow in the short-medium term is still unclear but highly possible considering profits haven’t been taken out for quite a while now.
A potential correction could weaken silver down to the $18.3/oz area or even for a retest of the $17.53 lower high. However, the RSI seems to suggest that the latter may be too low for the current geopolitical and economic environment.