A UK election is almost certainly on the horizon – and domestic and global investors should revise their portfolios accordingly, warns the boss of one of the world’s largest independent financial advisory organizations.
The warning from Nigel Green, founder and chief executive of deVere Group, which has $12bn under advisement, comes as the government announces that a fresh vote on an early election has been scheduled for Monday just before Parliament is due to be suspended from next week until 14 October.
Mr Green affirms: “With the UK’s Brexit–driven political crisis escalating, it’s almost certain that there will be a general election in order to try and end the deadlock. The only question is whether it will take place before or after the Brexit deadline day of 31 October.
“When it happens, it will be an election that gives voters the stark choice between Johnson’s no-deal Brexit, which would likely negatively impact the UK economy for several years, or Jeremy Corbyn’s Labour party, which promises an agenda of anti-business, high-tax, low-profit policies.
“Depressingly those are the options facing the British electorate in a time of national crisis.”
He continues: “Against the somewhat bleak outlook, UK domestic investors and global investors with exposure to UK assets should revise their portfolios accordingly.
“They should remain invested and ensure their portfolios are truly diversified across asset classes, sectors and regions.”
Mr Green goes on to say: “It’s clear no-deal is deeply unpopular in parliament. As such, Mr Johnson needs to stop wasting time, stop his bully boy tactics, and start with real diplomacy to get negotiations reopened.
“Despite, in effect, losing one card, the PM still has a ‘strong hand’ in fact it could be getting stronger – not due to his strategy, but because Germany is on the brink of recession and they are Europe’s powerhouse economy. The last thing they need is a no-deal and be unable to trade effectively as they do now with the UK, especially as the wider EU and global economies are slowing.”
The deVere CEO concludes: “An election in itself will create further uncertainty for the UK economy and the pound – and whoever wins, Mr Johnson or Mr Corbyn, the drama will be far from over for differing reasons.
“Geopolitical factors of this magnitude impact investor returns and steps should be taken to mitigate risks and take advantage of the opportunities when they are presented.’
About:
deVere Group is one of the world’s largest independent advisors of specialist global financial solutions to international, local mass affluent, and high-net-worth clients. It has a network of more than 70 offices across the world, over 80,000 clients and $12bn under advisement
Sector expert Michael Ballanger shares his dilemma in the face of a precious metals bull market.
With due deference to the greatness of William Shakespeare, the opening line of Hamlet is one that has been found not only in literature, but in film, music and politics, and is a question that has been asked for centuries as to whether the pain we endure in life is preferable to the calm found in the “sleep of death.” Likewise, whether the agony of nervous elation we have been experiencing on the long side of the precious metals markets is preferable to the safety of the profit-taken sidelines is yet another question of Shakespearean magnitude as gold and silver are now in areas of extreme synonymous with tops in 2011 and 2016.
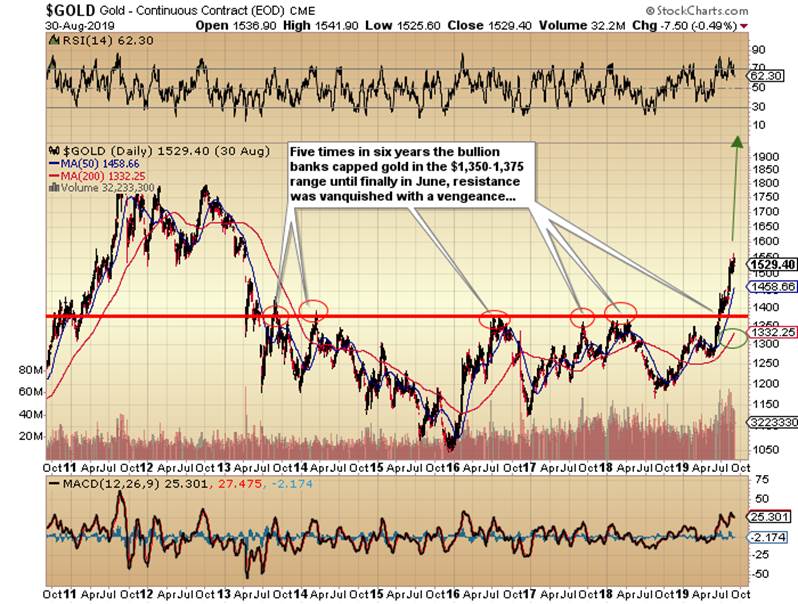
As I wrote about in June, “when conditions change, I change,” and just as it appeared as though the commercial cretins at the bullion banks were about to reject gold’s probe above the six-year resistance at $1,3501,375, a level rejected five times in six years, the U.S. dollar price for gold exploded northward and despite shockingly high and persistent RSI (relative strength index) and MACD (moving average convergence/divergence) readings, dragging the miners to multiyear highs with silver finally catching that all-too-elusive bid not seen in decade. During this past three-month orgy of golden worship, I have slowly been paring positions, building cash, tightening stops and reducing risk with the full knowledge that I would be leaving some of the profits on the table, a discipline so difficult that enforcing it requires massive medications and libational stress relief, both of which are in copious quantity in the MJB trading cockpit. Not an easy task when Led Zeppelin’s “When the Levee Breaks” drowns out the sputtering squawks of CNBC’s clueless anchors.
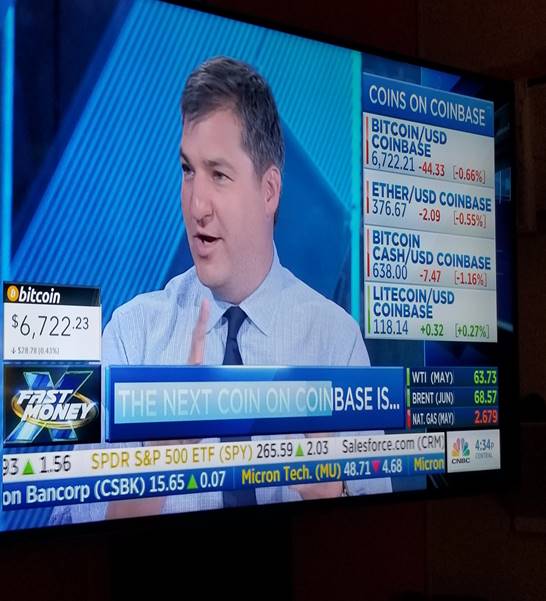
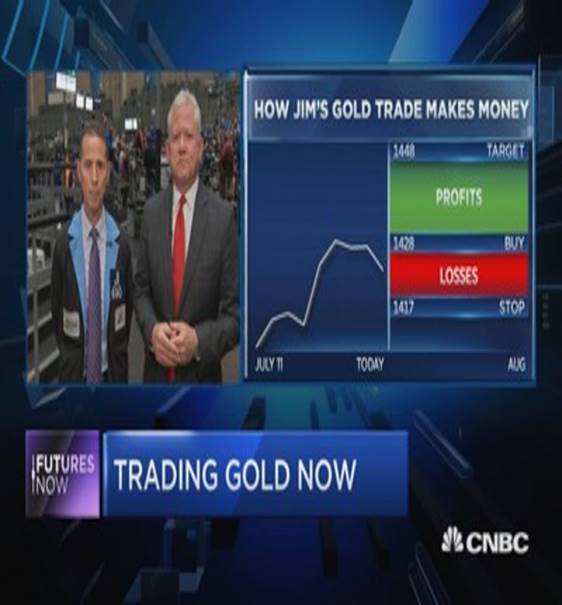
As the title of this missive imbues, “to be or not to be” an “all-in” gold and silver bull is a question that begs to be asked, because after forty years of covering the precious metals in one form or another, the wheels and axles on the gold and silver bandwagon are now straining and creaking under the weight of a deluge of newly anointed gold “experts,” all of whom are clamoring for recognition that they were “THE FIRST” to “call the turn.” With the Daily Sentiment Index (of gold bulls) now scraping 95% and Barron’s and the WSJ running gold-and-silver-friendly stories recently, all that is left in order to cement the short-term top in the precious metals is a brand new sidebar similar to the one in late 2017 offering viewers a running Bitcoin price update, which I noted in this publication in December 2017 as one of the key “topping indicators” for the BTC mania. Well, we aren’t quite there yet but CNBC has been forced, kicking and screaming, into having gold and silver “guest commentators” as more frequent fixtures in the CNBC daily landscape. Mind you, the CNBC reporters are just that reporters not market mavens as some might imagine, so if ratings can be goosed by some mutt plugging gold, on he or she comes and the circle of cable news life goes on.
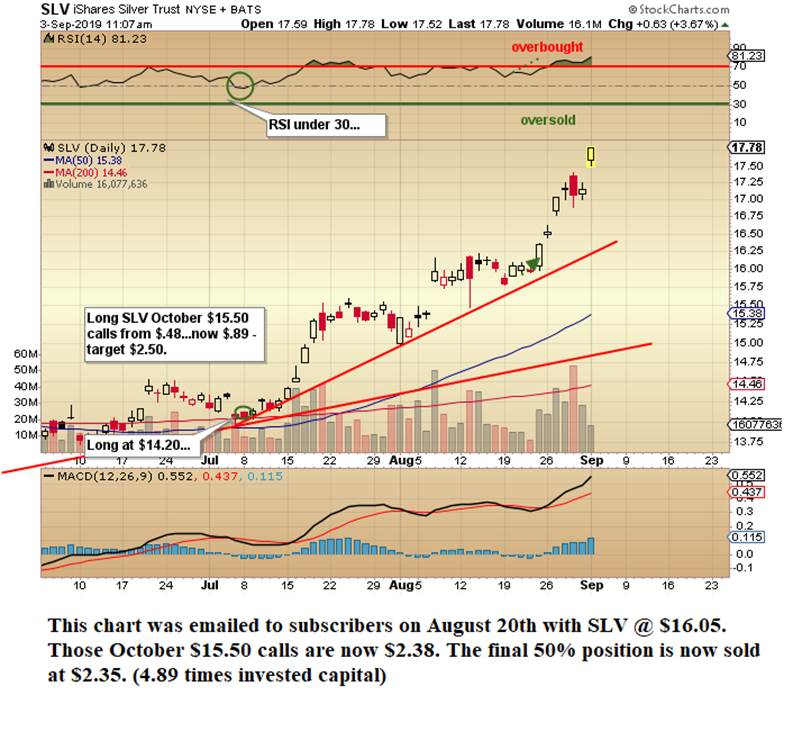
As a boater slave to the whims of the weather, I have learned to trust the direction of the barometer over the clouds on the horizon because clear skies and calm seas at daybreak can be transformed into 3-meter waves and 40-knot winds in an afternoon. The arrival of storms usually follows a sharp directional change in barometric pressure not unlike the role of the gold DSI (Daily Sentiment Index) in gauging just how crowded the gold trade has become. Short-term momentum gauges like RSI and MACD can be misleading but when combined with sharp and unusual increases in media coverage (with special attention to the blogosphere), it appears to me that barometric pressure for gold is dropping sharply with silver only marginally so. This favors my Trade of the Year, long silver and short gold whereby in early July, I effectively shorted the gold-silver ratio (GSR) at around 93, setting the likelihood of a winning trade at 98%. Today, the GSR resides at 81.72 for a 12.09% gain paid for with profits from the leveraged trades that I exited in late-June/early-July when gold first touched $1,375 and RSI spiked above 75. It should be noted that I DID go long a massive position in the SLV August $14 calls, which tripled and were legged out to the October $15.50 calls (@ $0.47) where half were sold at $1.80 (3.75-bagger) with the balance sold this morning at $2.31. (Needless to say, this was my BEST trade for the year thus far.)
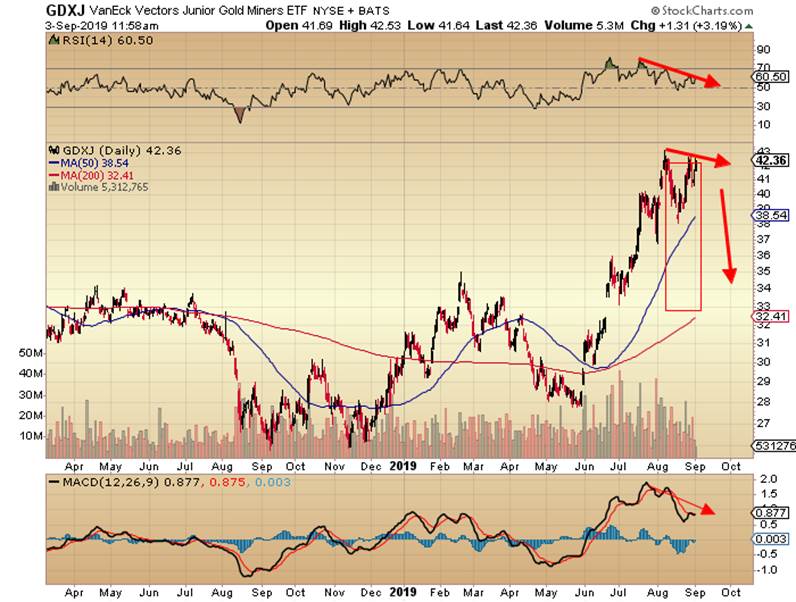
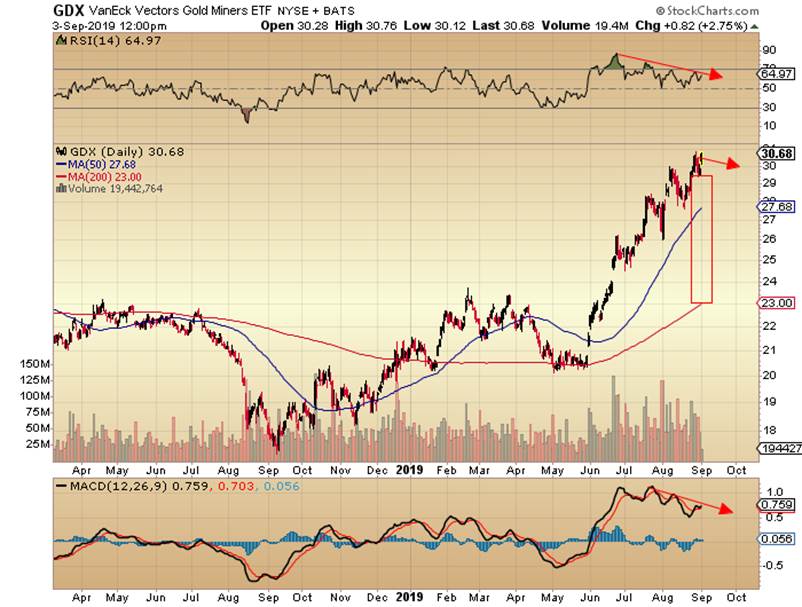
The gold market today looks more vulnerable to a correction than does the silver market but please don’t confuse the GSR with directional probability for the precious metals complex. We could see a 35% drop in gold accompanied by a 12% drop in silver, elongating the drop in the GSR while taking prices in real terms lower. As of this morning, I am once again flat the leveraged silver trade (SLV calls) but still short the GSR from 93. I have not touched (nor will I EVER) my physical gold and silver but remain 50% long GDXJ (from $30.22) and 50% long GDX (from $21.09) having reduced both positions around where they are this morning. I am considering a sale of the last of these holdings into any further strength. (To do so may require shattering the locks on both liquor cabinet and medicine chest in order to bolster resolve, a quality sorely lacking from years of excess )
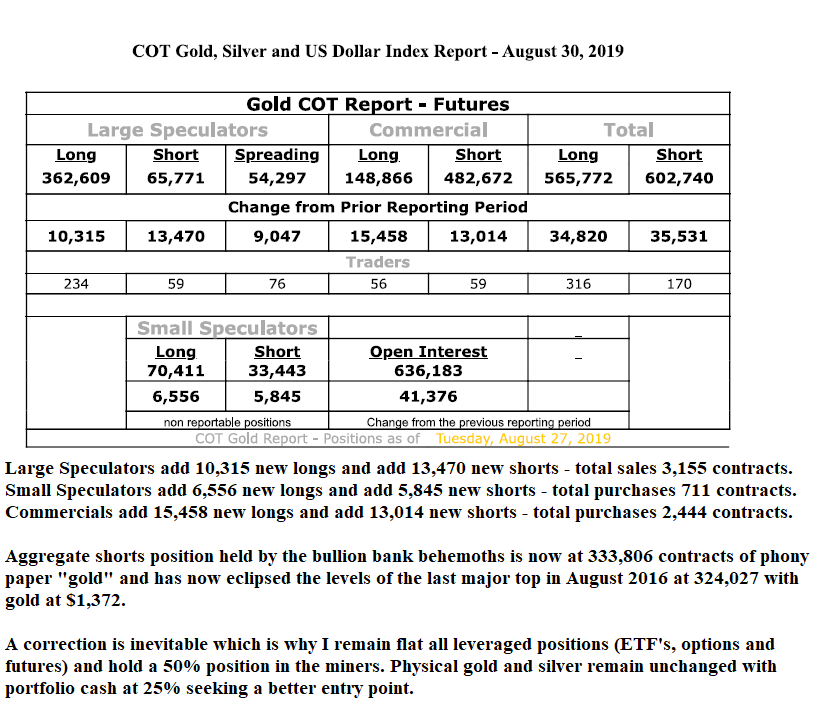
The Commitment of Traders report has been largely ineffective in calling a top for this particular move, unlike the 20162019 period whereby exaggerated moves in the aggregate short position held by Commercials allowed me to scurry to the sidelines avoiding what was about $400/ounce in drawdowns during that period. After the $1,375 breakout in June, the Commercials have certainly ceded control of the gold market to the newly minted bulls but have been steadily adding to short interest such that as of this weekend, a record 333,806 contracts of counterfeit “gold” representing 33,380,600 ounces worth over $51 billion U.S. dollars are now short. History has proven that when the bullion banks get this short, a correction (or perhaps an intermediate top) is looming.
If the “new paradigm” that everyone now uses as the reason to ignore all of the historical warnings proves itself out, then taking profits on positions (put on last January when everyone hated the precious metals) will be either early or outright wrong. However, my gut is telling me that the powers that be are going to pull out all the stops to keep the global stock rally marching on and WITHOUT competition from the precious metals markets. And it is times like this when everyone laughs you out of the room for being a Cassandra that vengeance is drawn. So, if I wind up with only physical gold and silver and a portfolio up 65% YTD (excluding trading profits in the leveraged positions), I will remain a satisfied investor with a ton of cash to deploy when and if the correction arrives.
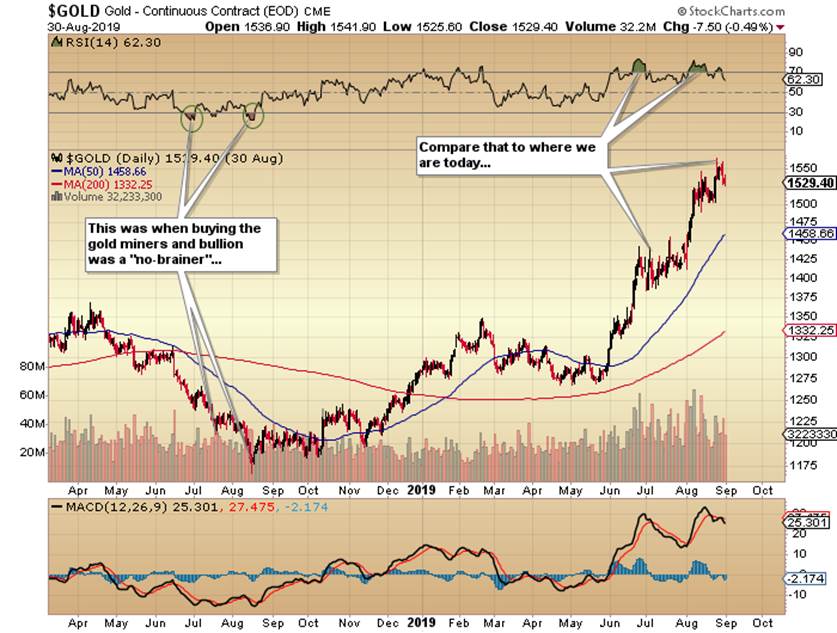
To be or not to be an investor in gold was NOT the question on most people’s minds last summer with gold below $1,200; I took out massive positions in the metals and the miners back when they were both universally hated by the mainstream. I leave you with one final chart that depicts this sudden and newfound love affair within which the mainstream is now embroiled. Taking positions in gold and gold miners after this kind of advance is NOT the “no-brainer” it was in August 2018. For this simple reason, I urge caution and the removal of a significant portion of the chips you have on the table, a table located in the precisely in the middle of a criminally rigged casino called the Comex. I am still trading but doing so with approximately one quarter of the significant profits locked in and banked, never to resurface under the covetous, ravenous, watchful eye of the bullion bank cartel. Trading with “house money” is at once both delightful and effective, but it carries a hidden danger because the cartel will let out just enough line to try to lure you back with your banked profits. They want THEIR money back and nothing drives a bullion bank into a mindless rage more than an investor trading with funds lifted from their greed-stained trousers. The permabulls will tell you that the bullion banks and their Treasury Department conspirators have lost all power in this “new paradigm” and we should relax and refrain from worry. I tend to disagree because wounded animals are the singular most dangerous of all creatures on this debt-ravaged planet and with gold at $1,552, these cartel cretins are now wounded, angry and very desperate animals.
A rose by any other color. . .
Originally trained during the inflationary 1970s, Michael Ballanger is a graduate of Saint Louis University where he earned a Bachelor of Science in finance and a Bachelor of Art in marketing before completing post-graduate work at the Wharton School of Finance. With more than 30 years of experience as a junior mining and exploration specialist, as well as a solid background in corporate finance, Ballanger’s adherence to the concept of “Hard Assets” allows him to focus the practice on selecting opportunities in the global resource sector with emphasis on the precious metals exploration and development sector. Ballanger takes great pleasure in visiting mineral properties around the globe in the never-ending hunt for early-stage opportunities.
Disclosure: 1) Statements and opinions expressed are the opinions of Michael Ballanger and not of Streetwise Reports or its officers. Michael Ballanger is wholly responsible for the validity of the statements. Streetwise Reports was not involved in any aspect of the article preparation. Michael Ballanger was not paid by Streetwise Reports LLC for this article. Streetwise Reports was not paid by the author to publish or syndicate this article. 2) This article does not constitute investment advice. Each reader is encouraged to consult with his or her individual financial professional and any action a reader takes as a result of information presented here is his or her own responsibility. By opening this page, each reader accepts and agrees to Streetwise Reports’ terms of use and full legal disclaimer. This article is not a solicitation for investment. Streetwise Reports does not render general or specific investment advice and the information on Streetwise Reports should not be considered a recommendation to buy or sell any security. Streetwise Reports does not endorse or recommend the business, products, services or securities of any company mentioned on Streetwise Reports. 3) From time to time, Streetwise Reports LLC and its directors, officers, employees or members of their families, as well as persons interviewed for articles and interviews on the site, may have a long or short position in securities mentioned. Directors, officers, employees or members of their immediate families are prohibited from making purchases and/or sales of those securities in the open market or otherwise from the time of the interview or the decision to write an article until three business days after the publication of the interview or article. The foregoing prohibition does not apply to articles that in substance only restate previously published company releases.
Charts provided by the author.
Michael Ballanger Disclaimer: This letter makes no guarantee or warranty on the accuracy or completeness of the data provided. Nothing contained herein is intended or shall be deemed to be investment advice, implied or otherwise. This letter represents my views and replicates trades that I am making but nothing more than that. Always consult your registered advisor to assist you with your investments. I accept no liability for any loss arising from the use of the data contained on this letter. Options and junior mining stocks contain a high level of risk that may result in the loss of part or all invested capital and therefore are suitable for experienced and professional investors and traders only. One should be familiar with the risks involved in junior mining and options trading and we recommend consulting a financial adviser if you feel you do not understand the risks involved.
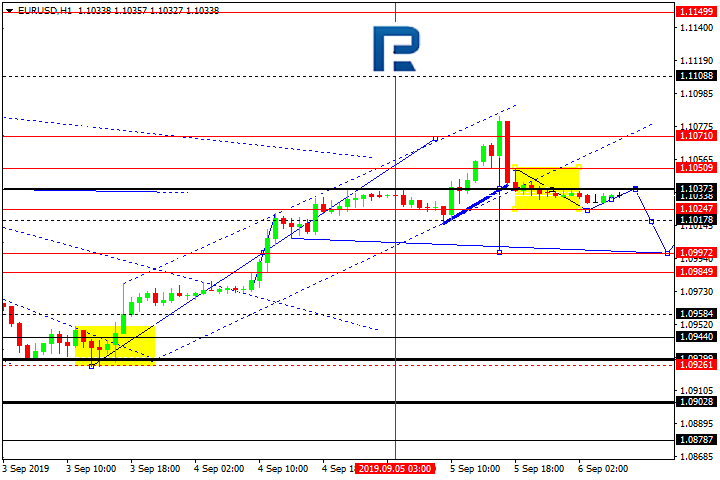
EURUSD is consolidating around 1.1037. Possibly, today the pair may fall to break 1.1024 and then continue trading inside the downtrend with the first target at 1.0997.
GBPUSD, “Great Britain Pound vs US Dollar”
GBPUSD is consolidating at the top of the ascending wave. According to the main scenario, the price is expected to form the first descending impulse towards 1.2200 and then resume trading upwards with the first target at 1.2280.
USDCHF, “US Dollar vs Swiss Franc”
USDCHF is forming the second ascending impulse with the target at 0.9892. Later, the market may form a new descending structure to reach 0.9870 and then resume trading upwards with the first target at 0.9913.
USDJPY, “US Dollar vs Japanese Yen”
USDJPY is consolidating at the top. Today, the pair may fall to reach 106.52 and start a new growth towards 106.80. After that, the instrument may continue trading downwards with the first target at 106.20.
AUDUSD, “Australian Dollar vs US Dollar”
AUDUSD is still consolidating above 0.6809. Today, the pair may form a new descending structure to reach 0.6783 and then return to 0.6809. Later, the market may start another decline with the target at 0.6760.
USDRUB, “US Dollar vs Russian Ruble”
USDRUB is consolidating below 66.12. Possibly, the pair may trade downwards to break 65.60 and then continue falling with the first target at 65.20.
USDCAD, “US Dollar vs Canadian Dollar”
USDCAD has completed the ascending impulse along with the correction. Today, the pair may grow to reach 1.3296 and then start a new correction towards 1.3250. After that, the instrument may form one more ascending structure with the target at 1.3350.
XAUUSD, “Gold vs US Dollar”
Gold has completed the descending impulse at 1508.33; right now, it is consolidating. Possibly, the pair may continue moving downwards to reach 1478.78. However, if the price grows to break 1522.20, the instrument may start a new correction towards 1537.70 and then resume trading downwards to return to 1508.30.
BRENT
Brent has finished the ascending wave at 62.60; right now, it is correcting towards 60.06. After that, the instrument may resume trading inside the uptrend with the target at 64.25.
BTCUSD, “Bitcoin vs US Dollar”
After forming the descending impulse, BTCUSD has completed the correction at 10715.00. Today, the pair may fall to reach 10430.00. However, if later the price breaks this level to the downside, the instrument may continue trading inside the downtrend with the first target at 9900.00.
Attention! Forecasts presented in this section only reflect the author’s private opinion and should not be considered as guidance for trading. RoboForex LP bears no responsibility for trading results based on trading recommendations described in these analytical reviews.
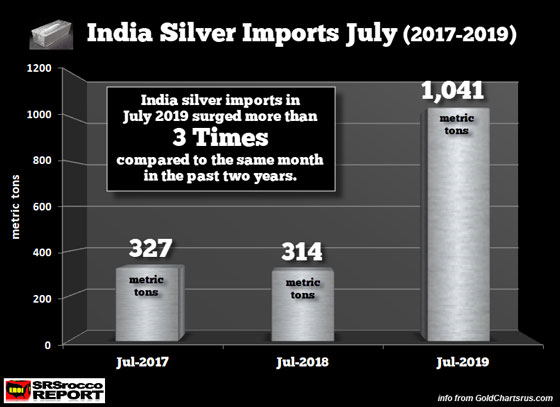
As the silver price began to take off in July, Indian silver imports surged three-fold versus the same period last year. Something must have motivated the Indians to import more silver because the summer months haven’t typically been a strong buying season. However, one factor that may have caused the huge increase of Indian silver demand in July may have been due to the big jump in the gold price.
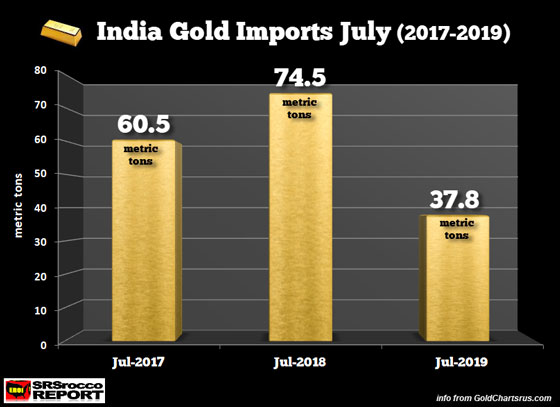
India’s gold imports in July plunged 55% from a year ago to the lowest level in three years as a rally in local prices to a record high and a hike in import taxes curtailed demand, a government source said on Monday.
If we look at India’s July gold imports for the past three years, we can plainly see the higher price has indeed impacted demand:
India gold imports this July fell to 37.8 metric tons (mt) versus the 74.5 mt during the same month last year. However, we see quite the opposite for silver. With the higher gold price and the hike in import taxes, Indians switched to buying silver:
Indian silver imports more than tripled to 1,041 mt in July compared to 314 mt during the same month last year.
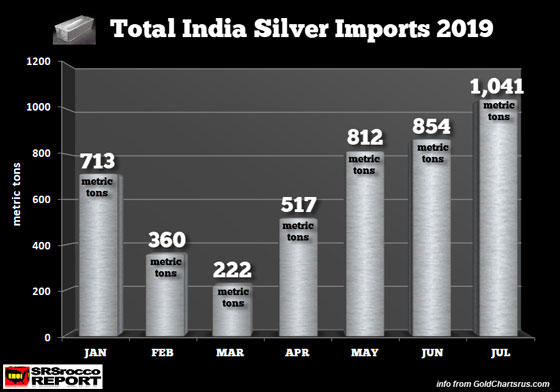
Furthermore, we can see that Indian silver imports in July 2017 were also quite low at 327 mt. Normally, Indian precious metals demand picks up in September after a successful Monsoon season. However, we are seeing increased demand for silver in June and July this year:
With Indian silver imports accounting for nearly 30% of total global mine supply in 2018, the situation in the silver market could become quite interesting if Indian demand really picked up this year. I am curious to see what the Indian silver imports will turn out be in August when the data is released as the silver price jumped more than $2 to $18.38 at the end of the month.
Will Indian silver demand continue to be strong in August even though prices are rising quickly? At some point, investors are going to learn that there really isn’t that much physical silver to go around. As I mentioned in a previous video, there’s about the same amount of physical silver investment in the world, 2.45 billion oz compared to 2.4 billion oz of gold.
As the price of gold continues higher, it will make silver even more attractive to the masses. Even when silver reaches $25 an ounce, it’s much more affordable for the public than $1,600-$1,700 for gold.
The Money Metals News Service provides market news and crisp commentary for investors following the precious metals markets.
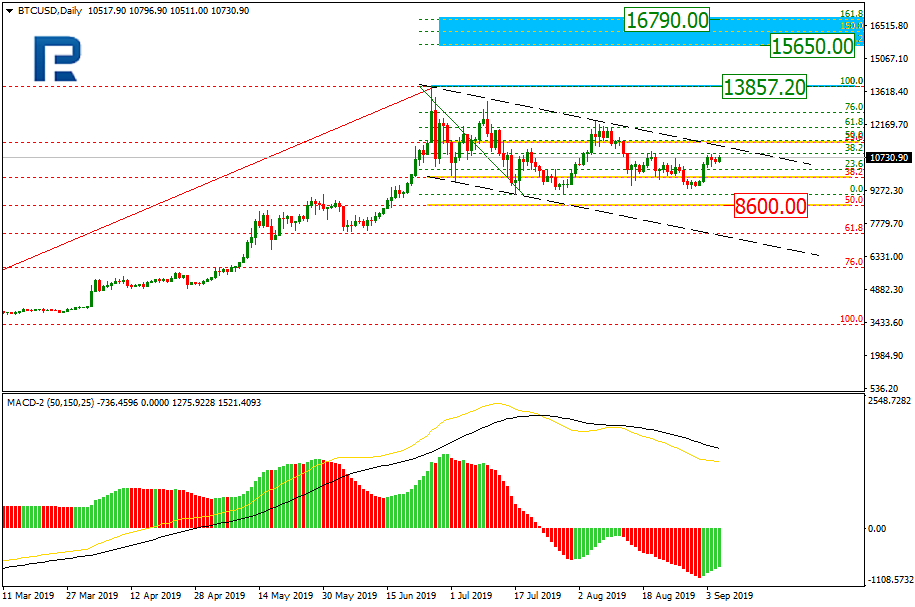
As we can see in the daily chart, the correctional channel is transforming into Triangle. If the price breaks the current resistance live, BTCUSD will continue growing towards the high at 13857.20. More significant upside targets are inside the post-correctional extension area between 138.2% and 161.8% fibo at 15650.00 and 16790.00 respectively. At the same time, MACD lines are heading downwards, which means that the decline may yet continue towards 50.0% fibo at 8600.00.
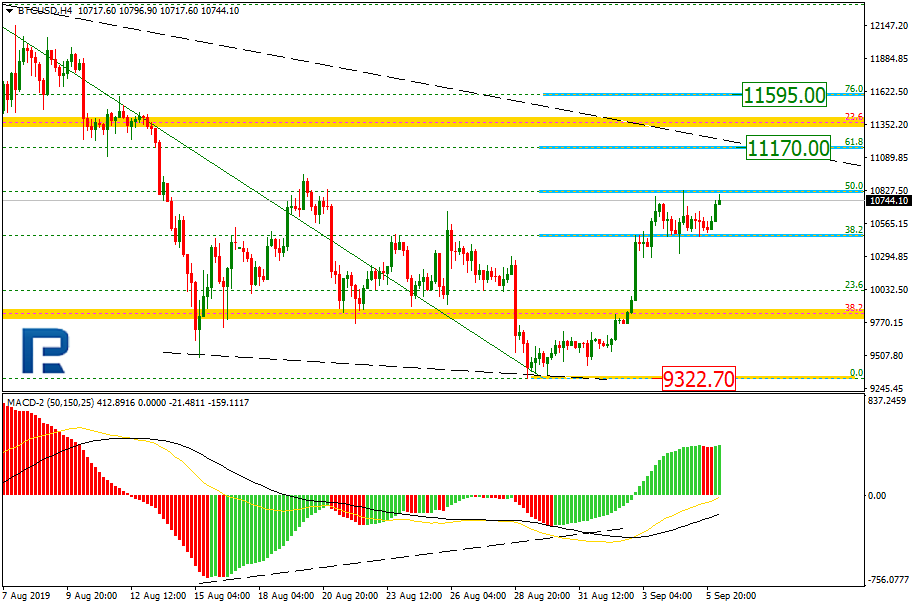
In the H4 chart, the pair is correcting to the upside after finishing another descending wave and has already reached 50.0% fibo. In the future, the correction may continue towards 61.8% and 76.0% fibo at 11170.00 and 11595.00 respectively. The support is the low at 9322.70.
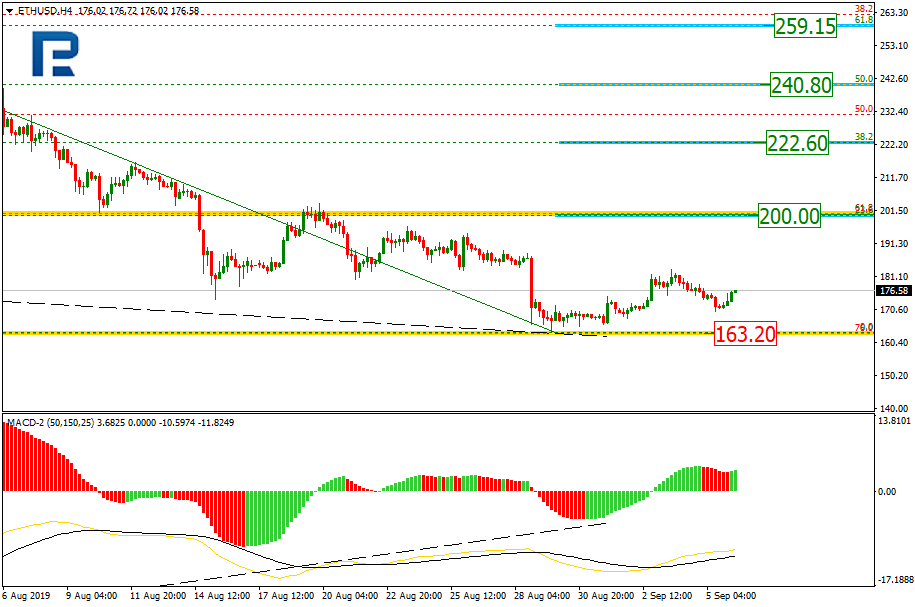
ETHUSD, “Ethereum vs. US Dollar”
As we can see in the H4 chart, the descending tendency reached 76.0% fibo and then there was a convergence on MACD. In this case, ETHUSD may start a new growth towards 23.6%, 38.2%, 50.0%, and 61.8% fibo at 200.00, 222.60, 240.80, and 259.15 respectively.
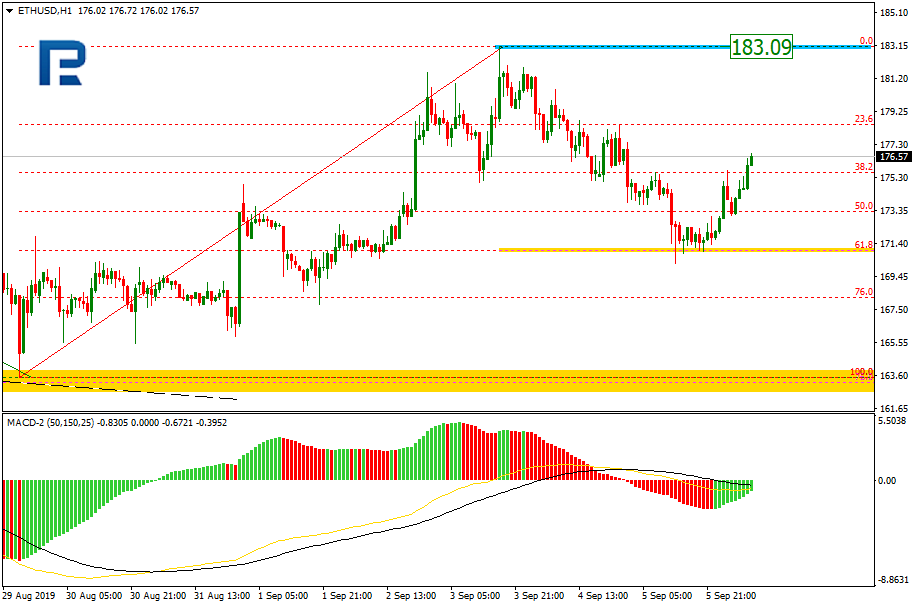
In the H1 chart, after completing the descending correction at 61.8% fibo, the price is starting a new impulse to the upside to reach the high at 183.09.
Attention! Forecasts presented in this section only reflect the author’s private opinion and should not be considered as guidance for trading. RoboForex LP bears no responsibility for trading results based on trading recommendations described in these analytical reviews.
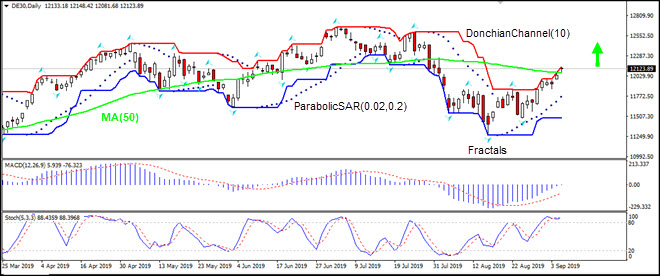
Improving German private sector activity bullish for DE30
Germany’s private sector activity expansion was stronger than expected. Will the DE30 stock index continue advancing?
German data lately were positive on balance: contraction in manufacturing sector slowed while the services sector expansion accelerated in August. Markit’s manufacturing PMI inched up to 43.5 from 43.2 in July, and services PMI rose to 54.8 from 54.5. Readings above 50 indicate expansion, below 50 mark contraction. Composite PMI rose to 51.7 from 50.9 in July, indicating accelerating expansion in private sector activity for August. Increasing private sector activity is bullish for Germany’s stock market index.
On the daily timeframe DE30: D1 is rising after breaking above 50-day moving average MA(50).
The Donchian channel indicates uptrend: it is widening up.
We believe the bullish momentum will continue as the price breaches above the upper boundary of Donchian channel at 12071.45. This level can be used as an entry point for placing a pending order to buy. The stop loss can be placed below the lower Donchian boundary at 11486.40. After placing the order, the stop loss is to be moved every day to the next fractal low, following Parabolic signals. Thus, we are changing the expected profit/loss ratio to the breakeven point. If the price meets the stop loss level (11486.40) without reaching the order (12071.45), we recommend cancelling the order: the market has undergone internal changes which were not taken into account.
The US dollar has stabilized against a basket of world currencies. Financial market participants are waiting for the publication of the US labor market report for August. Recent economic releases from the US have been rather optimistic. We recommend that you pay attention to the difference between the actual and forecasted values of the indicators. At the moment, EUR/USD quotes are consolidating in around 1.10100-1.10500. You should open positions from these levels and keep an eye on the head of the Federal Reserve who will make a speech today.
The Economic News Feed for 06.09.2019:
– Preliminary GDP Report (EU) – 12:00 (GMT+3:00);
– Labour Market Report (US) – 00:00 (GMT+3:00);
The price fixed above 50 MA and 100 MA, which signals the strength of buyers.
The MACD histogram is located near the 0 mark. There are no signals at the moment.
The Stochastic Oscillator is near the overbought zone, the %K line crossed the %D line. There are no signals at the moment.
Trading recommendations
Support levels: 1.10100, 1.09650, 1.09300
Resistance levels: 1.10500, 1.10850, 1.11150
If the price consolidates above 1.10500, expect further growth toward 1.11000.
Alternatively. the quotes can decrease toward 1.09800-1.09600.
The GBP/USD currency pair
Technical indicators of the currency pair:
Prev Open: 1.22518
Open: 1.23260
% chg. over the last day: +0.59
Day’s range: 1.23204 – 1.23429
52 wk range: 1.1995 – 1.3385
The pound continues to recover against the US dollar. Yesterday, the growth of GBP/USD quotes exceeded 80 points. The trading tool has updated the key extremes. Demand for GBP resumed due to a possible delay of Brexit. British Prime Minister Boris Johnson said that the situation with Brexit requires early elections. We recommend that you keep track of current information on this issue. At the moment, the GBP/USD currency pair is consolidating in the range of 1.23000-1.23550. Investors expect labor statistics from the US for August. Positions must be opened from key levels.
The Economic News Feed for 06.09.2019 is calm.
Indicators do not signal the strength of buyers: the price has fixed above 50 MA and 100 MA.
The MACD histogram is in the positive zone, but below the signal line, which gives a weak signal to buy GBP/USD.
The Stochastic Oscillator is in the neutral zone, the %K line is above the %D line, which also indicates bullish sentiment.
Trading recommendations
Support levels: 1.23000, 1.22550, 1.22100
Resistance levels: 1.23550, 1.24000
If the price consolidates above 1.23550, expect further growth toward 1.24000.
Alternatively, the quotes could drop toward 1.22600-1.22300.
The USD/CAD currency pair
Technical indicators of the currency pair:
Prev Open: 1.32216
Open: 1.32264
% chg. over the last day: +0.05
Day’s range: 1.32067 – 1.32351
52 wk range: 1.2727 – 1.3664
The USD/CAD currency pair stabilized after a sharp decline the day before. Looney is currently in lateral motion. The key support and resistance levels are: 1.31900 and 1.32450, respectively. A trading instrument has the potential to further decline. Today, participants in financial markets will evaluate labor statistics from the United States and Canada. We also recommend paying attention to the dynamics of oil quotes. Positions must be opened from key levels.
At 15:30 (GMT+3:00) a report on the labor market in Canada will be published.
The price fixed below 50 MA and 100 MA, which signals the strength of sellers.
The MACD histogram is in the negative zone and below the signal line, which gives a strong signal to sell USD/CAD.
The Stochastic Oscillator is in the oversold zone, the %K line began to cross the %D line. There are no signals at the moment.
Trading recommendations
Support levels: 1.31900, 1.31500
Resistance levels: 1.32250, 1.32450, 1.32800
If the price consolidates below 1.31900, expect a further frop toward 1.31500-1.31400.
Alternatively, the quotes could recover toward 1.32600-1.32900.
The USD/JPY currency pair
Technical indicators of the currency pair:
Prev Open: 106.303
Open: 106.925
% chg. over the last day: +0.64
Day’s range: 106.888 – 107.102
52 wk range: 104.97 – 114.56
The USD/JPY currency pair continues to show positive dynamics. The trading tool has updated local highs. Quotes USD/JPY found resistance at 107.200. Mark 106.700 is already a “mirror” support. Demand for the safe haven currencies weakened after reports of the resumption of trade negotiations between Washington and Beijing in October. Today we recommend paying attention to the news background on the US economy. Positions must be opened from key levels.
Mixed data on household spending in Japan were published during the Asian trading session.
Indicators signal the strength of buyers: the price has fixed above 50 MA and 100 MA.
The MACD histogram is in the positive zone, but below the signal line, which gives a weak signal to buy USD/JPY.
The Stochastic Oscillator is in the neutral zone, the %K line is below the %D line, which indicates a bearish sentiment.
Trading recommendations
Support levels: 106.700, 106.300, 105.850
Resistance levels: 107.200, 107.500
If the price consolidates above 107.200, expect further growth toward 107.500-107.700.
Alternatively, the quotes could drop toward 106.400-106.200.
US oil started the week on bad footing on the back of China’s 5% tariff on US crude. The Chinese initiated the first round of tariffs on September 1st and plan to begin the second batch on December 15.
With the US stepping up their game on Iran with their own sanctions, affecting their production levels, crude was able to recover some of the earlier losses and reversed its course despite API’s huge build.
API Weekly Inventories Ignored
The American Petroleum Institute (API) reported a huge build in crude stocks for the week ending August 29. Analysts had expected a small build of 400 thousand barrels. However, the real results proved their projections were way off, posting 3.5 million barrels instead.
Luckily for oil bulls, headlines involving yet another seized oil tanker and OPEC-led cuts pushed sentiment for oil demand lower. That supported the prices of oil as bullish bets had already increased amid the US-Iran drama.
Huge EIA Draw Sends WTI to Fresh Monthly High
The Saudis have been looking to take action to support prices higher along with OPEC this week. Meanwhile, the French President’s attempt to relieve US pressures on Iran have failed. As a result, crude shifted further away from registering a loss for this week. The geopolitical developments drove prices up to last week’s high of $56.50 per barrel.
On Thursday, following a huge crude oil draw of 4.8 million barrels, not only were oil traders able to mask US/Sino and US/Iran related concerns, but they were also able to reach a fresh monthly high.
The prices of oil rose at $57.80 per barrel, however only momentarily, after the EIA report. Regardless of the factors affecting oil prices positively, there seems to be more focus on trade war-led forecasts, rather than OPEC policies and EIA reports.
Adding to that, gasoline and US oil production lent a heavy hand on bears, driving prices to a Thursday low of $56 per barrel.
US Oil Seems Mixed Medium-Term, Bullish in the Short-Term
Headline news indicates that the OPEC and Non-Opec partners’ approach to stabilize the market are failing. On the one hand, they are talking about production increases, on the other about production cuts. That brings on mixed messages to oil traders.
Uncertainty is likely to remain intact in the oil markets, as volatility levels turn increasingly flat, yet remain at large. With positive-influence developments taking place, WTI could head up to $61 levels, to potentially complete the 3-3-5 flat pattern.
As NY opened following some relatively good ISM Non-Manufacturing and ADP numbers, sentiment shifted a tad. This allowed the US index to recover all losses and push some FX majors near their opening levels.
Meanwhile, positive trade war developments supported high-risk assets with SPX registering yet another “best-performer” session.
In today’s trade…
High-Risk Assets Biased to the Upside
The greenback has been weighing on most FX majors compared to how weak it has been trading since the contractionary ISM Manufacturing PMI figures released last Tuesday. Despite this, high-risk assets were able to register marginal gains yesterday. And this is continuing into today’s trading session up to now.
Aussie, kiwi and US equities moved up. The 68 cent barrier is now past for AUDUSD, NZDUSD just tagged the 64 cents and SPX seems bid after the breakout above 2938. Equities could also well be affected by increasing expectations of another Fed cut.
Off the high-risk FX majors, Loonie ended the session unchanged on the back of oil’s reversal. This is despite EIA’s crude draw surprise. However, it is currently pushing the dollar lower. Note that the psychological $1.32 level is likely to reject USDCAD. Meanwhile, forex traders patiently await the Canadian jobs data.
Safe-Havens Under Pressure on Trade War Optimism
Despite USDJPY, USDCHF and gold being dollar de/nominated FX assets, dollar-negative flows did not affect them. Market participants perhaps found an opportunity to pocket some profits ahead of the NFP. Especially since US-Sino relations are improving.
Safe-haven demand seems to be persistently weakening this morning, with the Swiss Franc and gold feeling the most pain. Yen, on the other hand, remains muted at the 107 psychological level against the buck.
EURUSD Reversed Gains on German Data, Now Mixed
EURUSD was bid yesterday and reached a high of $1.1082. Sentiment shifted, however, after Germany reported poor Factory Orders figures not seen since April 2019. Interestingly enough, but expectedly, EURUSD ended the session mixed.
In today’s session, the most popular currency pair remains glued around yesterday’s close at $1.1030despite the slight uptick in year-on-year employment and GDP figures.
It seems that forex traders are getting ready for the monthly NFP.
Pound Performs Worse Compared to Last Session
GBPUSD reached yet another high yesterday, breaking the $1.23 psychological resistance for good. Parliament is likely to dismiss BoJo’s strategy for a snap election as well. Following his previous failure to leave the EU with a “no-deal,” Brexit pound traders took the latest defeat as a good sign.
Into this session, however, market participants are looking into pocketing some profits ahead of major-impact releases, and as the HPI figures registered a softening. With that being said, the weakening has taken cable only marginally below $1.23.
Equity markets rallied modestly on Thursday following reports that China and the United States will resume trade talks. The fresh round of talks is slated for October after China’s vice premier, Liu He and US officials spoke over the phone. Meanwhile, private payrolls grew by 195k in August. This beat the forecasts of a 140k increase. July’s numbers were revised lower by 14k to 142,000. The numbers come amid concerns of a slowdown in the economy.
Euro Retreats from a Five-Day High
The common currency tested a five-day high intraday, rising to 1.1083. The common currency gained largely due to the flows in the US dollar. Economic data was mixed with ADP payrolls released stronger than expected. But the services PMI from Markit came out lower than forecasts. However, this was overshadowed by the ISM’s non-manufacturing PMI. Activity in the non-manufacturing sectors rose to 56.4 in August.
EURUSD Retests Minor Resistance
The currency pair was seen rising to a weekly high as price action promptly gave up the gains. The retest of the previously breached support area at 1.1065 has been tested for resistance. This could mean that the euro currency could be looking to pare gains. The downside looks limited for the moment with the trend line coming in likely as dynamic support.
Pound Sterling Holds Up Amid UK Political Drama
The British pound was seen posting gains for the third consecutive day. This came after UK lawmakers rejected PM Boris Johnson’s request for general elections. The UK parliament is due to debate again, this coming Monday. The currency held up strongly despite rising uncertainty in UK politics ahead of the October 31st Brexit deadline.
GBPUSD Rises to a Two-Week High
The currency pair was seen posting gains, rising to a two-week high on Thursday. The lower price level of interest is seen at 1.2295. If support is established here, there is scope for further gains. However, given the current bullish momentum, we expect GBPUSD to continue rising higher. The next resistance level is seen in the 1.2428–1.2400 region.
Gold Drops on Upbeat US Data
The precious metal was seen falling over 2% on Thursday. This came following a string of better than expected economic reports from the US. Mostly, the ISM non-manufacturing PMI alongside ADP payrolls and US factory orders helped to strengthen the USD on the day. Positive news from US/China trade talks also helped investors’ risk appetite to improve.
Further XAUUSD Declines Ruled Out as Support Holds for Now
The precious metal was seen extending the declines to the initial support area. The support level of 1508 was briefly tested but prices were rejected promptly. We expect to see a firmer retest of this level in the near term. There is also scope for price to post a modest rebound in the near term. However, a lower high is likely to be formed.