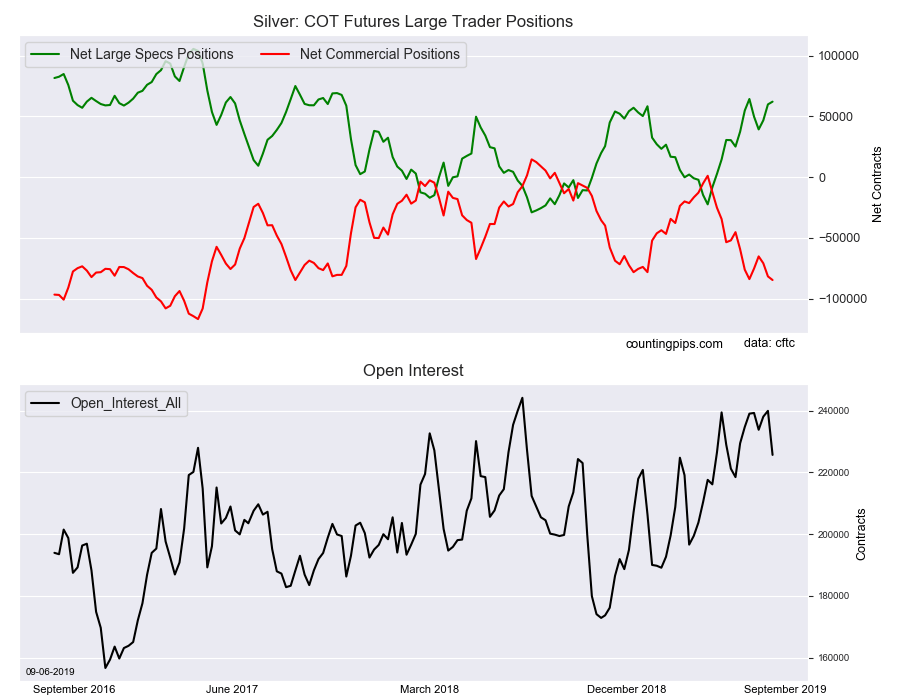
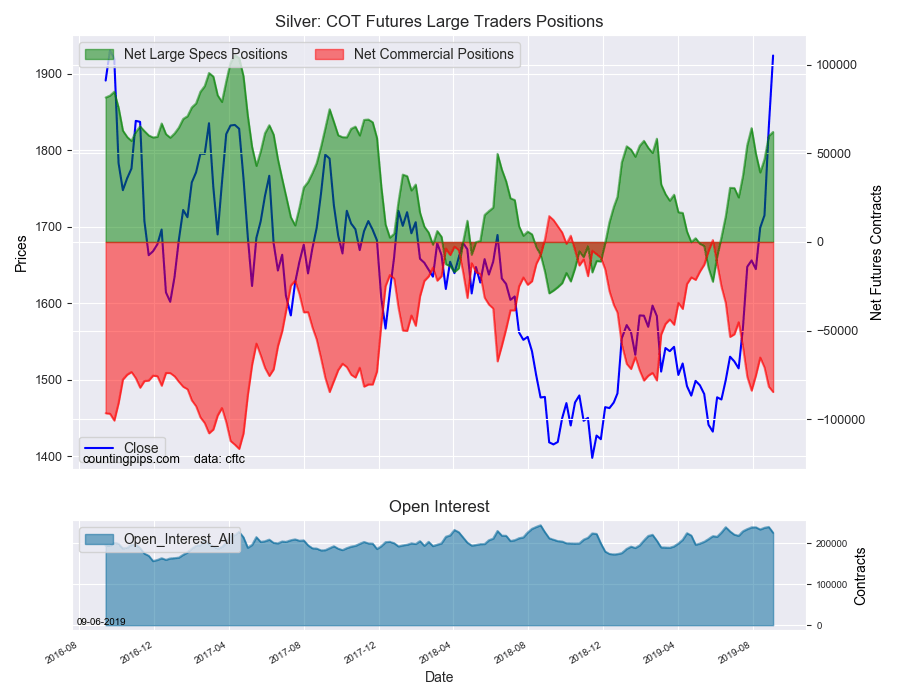
Large precious metals speculators boosted their bullish net positions in the Silver futures markets again this week, according to the latest Commitment of Traders (COT) data released by the Commodity Futures Trading Commission (CFTC) on Friday.
The non-commercial futures contracts of Silver futures, traded by large speculators and hedge funds, totaled a net position of 62,125 contracts in the data reported through Tuesday September 3rd. This was a weekly rise of 2,273 net contracts from the previous week which had a total of 59,852 net contracts.
The week’s net position was the result of the gross bullish position (longs) advancing by 1,489 contracts (to a weekly total of 104,977 contracts) while the gross bearish position (shorts) declined by -784 contracts for the week (to a total of 42,852 contracts).
Silver speculators were back at adding to their bullish bets this week for a third straight week and after a few down weeks on August 6th and 13th. Spec positions have now risen by a total of over +22,000 net contracts in the past three weeks and the overall position sits at the highest bullish level since July 30th.
Silver Commercial Positions:
The commercial traders position, hedgers or traders engaged in buying and selling for business purposes, totaled a net position of -84,678 contracts on the week. This was a weekly shortfall of -2,997 contracts from the total net of -81,681 contracts reported the previous week.
Silver Futures:
Over the same weekly reporting time-frame, from Tuesday to Tuesday, the Silver Futures (Front Month) closed at approximately $1923.70 which was a rise of $93.90 from the previous close of $1829.80, according to unofficial market data.
*COT Report: The COT data, released weekly to the public each Friday, is updated through the most recent Tuesday (data is 3 days old) and shows a quick view of how large speculators or non-commercials (for-profit traders) as well as the commercial traders (hedgers & traders for business purposes) were positioned in the futures markets.
The CFTC categorizes trader positions according to commercial hedgers (traders who use futures contracts for hedging as part of the business), non-commercials (large traders who speculate to realize trading profits) and nonreportable traders (usually small traders/speculators).
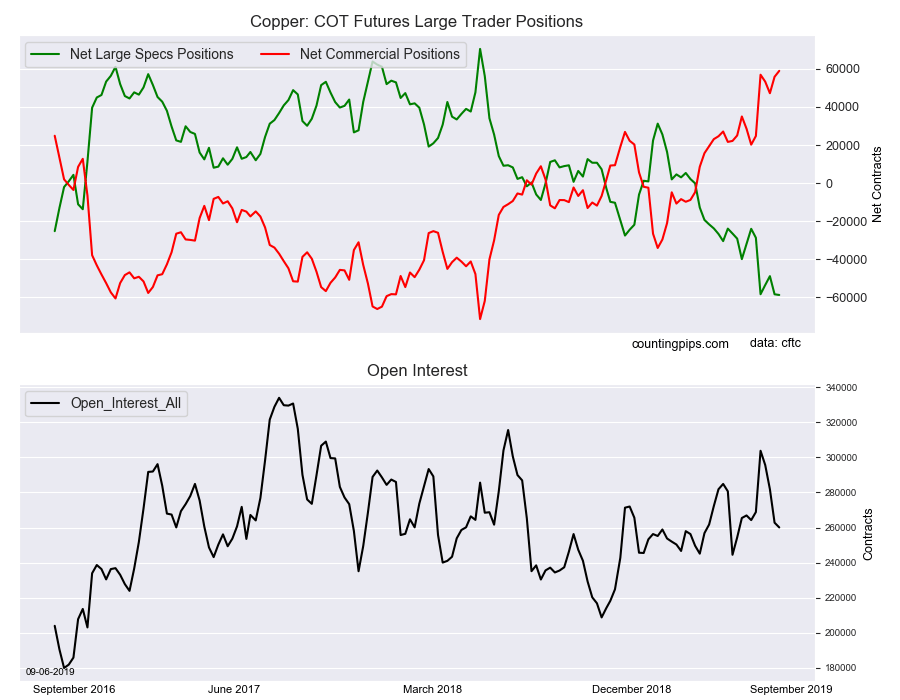
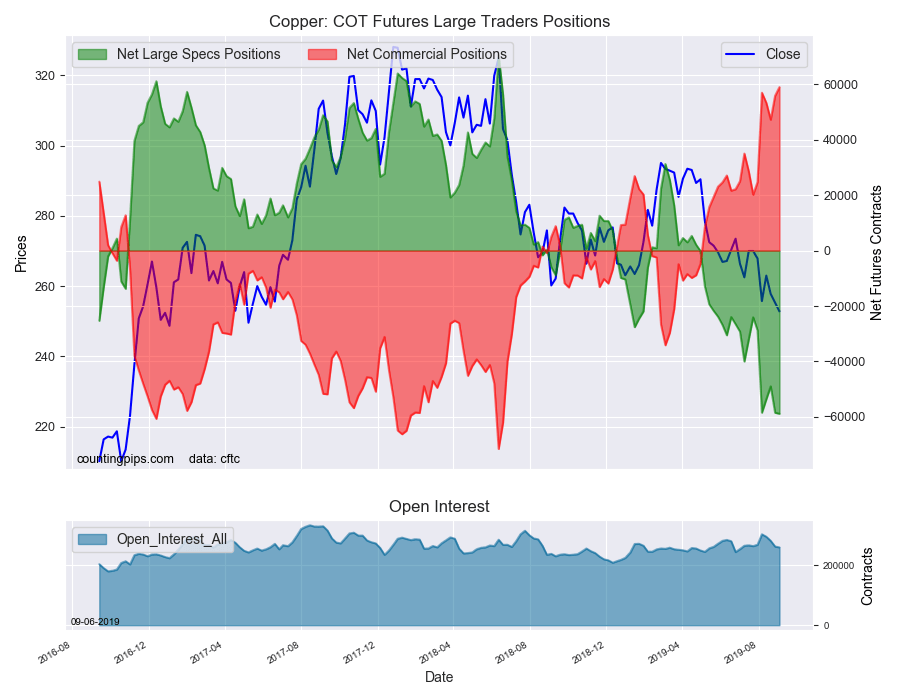
Large precious metals speculators added to their bearish net positions in the Copper futures markets again this week, according to the latest Commitment of Traders (COT) data released by the Commodity Futures Trading Commission (CFTC) on Friday.
The non-commercial futures contracts of Copper futures, traded by large speculators and hedge funds, totaled a net position of -58,841 contracts in the data reported through Tuesday September 3rd. This was a weekly change of -361 net contracts from the previous week which had a total of -58,480 net contracts.
The week’s net position was the result of the gross bullish position (longs) going up by 3,304 contracts (to a weekly total of 76,099 contracts) while the gross bearish position (shorts) rose by a greater amount of 3,665 contracts for the week (to a total of 134,940 contracts).
Speculators raised their bearish bets higher for a second straight week and the bearish position reached the most bearish level on record for a second straight week as well, according to CFTC data going back to 1989.
Copper speculators had held an overall bullish position as recently as April 23rd before sentiment turned sour and spec positions declined for fourteen out of the next nineteen weeks through this week.
Copper Commercial Positions:
The commercial traders position, hedgers or traders engaged in buying and selling for business purposes, totaled a net position of 58,997 contracts on the week. This was a weekly gain of 3,112 contracts from the total net of 55,885 contracts reported the previous week.
This week’s data also marked a record high for the commercial positions on the bullish side, surpassing the previous record on August 6th.
Copper Futures:
Over the same weekly reporting time-frame, from Tuesday to Tuesday, the Copper Futures (Front Month) closed at approximately $252.80 which was a shortfall of $-2.50 from the previous close of $255.30, according to unofficial market data.
*COT Report: The COT data, released weekly to the public each Friday, is updated through the most recent Tuesday (data is 3 days old) and shows a quick view of how large speculators or non-commercials (for-profit traders) as well as the commercial traders (hedgers & traders for business purposes) were positioned in the futures markets.
The CFTC categorizes trader positions according to commercial hedgers (traders who use futures contracts for hedging as part of the business), non-commercials (large traders who speculate to realize trading profits) and nonreportable traders (usually small traders/speculators).
Welcome to this week’s Market Wrap Podcast, I’m Mike Gleason.
Later in today’s program we’ll hear a fascinating interview with Greg Weldon of Weldon Financial. Greg breaks down the recent move in silver, a move off of a breakout point he called spot on on this program a few weeks ago, and also gives us his thoughts on the pullback we saw on Thursday.
Greg also tells us at what price on the downside he expects will provide major support in both gold and silver if we do see a further pullback from here. So, don’t miss my interview with the man they call the Gold Guru, coming up after this week’s market update.
This week brought more big moves in precious metals markets. The biggest mover, no surprise, is silver.
The silver market spiked up to as high as $19.75 mid week before finally succumbing to heavy selling pressure on Thursday. The selling continued into Friday morning as the white metal fell all the way back to $18 before rallying strongly off that level. As of this recording, spot prices come in at $18.69 an ounce as silver hangs on to a weekly gain of 1.4%.
Silver continued to show strong relative strength versus gold earlier this week, sending the gold to silver ratio below 80 – its lowest reading in more than a year.
Gold ran into resistance around the $1,550 level for the second straight week before pulling back. The monetary metal currently trades at $1,520 per ounce, essentially unchanged now since last Friday’s close.
Turning to platinum, the latest precious metal to break out of a long consolidation base touched the $1,000 level for the first time since early 2018. Platinum prices are now settling down at $958 but are still registering a gain of 2.5% this week.
And finally, palladium has re-gained its premium over gold on the heels of a 1.0% weekly advance. Palladium prices currently come in at $1,552 per ounce.
Looking ahead to next week, metals investors should brace for a continuation of volatile market conditions. We’re seeing some near-term overbought signals, coupled with relative weakness in gold and silver mining stocks, which sold off hard on Thursday.
For long-term gold and silver bulls, pullbacks down to more sustainable trendlines would be welcome developments.
Volatility may begin to ratchet down ahead of the Federal Reserve’s policy meeting on September 17th-18th. Then, as is the usual pattern, markets will likely move in reaction to the Fed’s decision. It is widely expected to be a quarter point rate cut, and based on today’s weak jobs report, that anticipated cut appears to be solidifying.
The Fed has also ended its Quantitative Tightening program sooner than originally expected. It is now effectively expanding its massive balance sheet by reinvesting interest back into Treasuries and swapping mortgage-backed securities for Treasuries.
The odds of a more dramatic half-point cut by the Fed are diminishing as the yield curve begins to straighten out from its recent inversion. The 30-year Treasury yield is back above 2% while the 10-year surged above 1.5% on Thursday.
Still, the major trend appears to be that of falling yields across the board. If a recession hits in the coming months, the Federal Reserve can be expected to take its benchmark rate down to zero – or perhaps even below zero. Former Fed chairman Alan Greenspan said in an interview this week that it’s only a matter of time before negative rates arrive in the U.S.
Globally, more than $16 trillion worth of paper promises now carry the promise of a negative return. The skyrocketing proliferation of negative yielding bonds across Europe and Japan over the past couple years is perhaps the most head-scratching asset bubble of all-time.
The question is whether it will get bigger – much bigger – when rates in the U.S. turn negative, or whether a mass exodus from these losing propositions occurs first. Either way, a bond offers more risk than reward these days – or as others have put it, bonds now offer return-free risk.
The nominally positive yields still available on U.S. bonds will almost certainly translate into negative real yields as the Fed pursues its “symmetrical” 2% inflation target.
Meanwhile, millions of young people who don’t necessarily have any funds to invest in financial markets face the dim prospect of negative real returns on their overpriced college degrees. Given declining academic standards and rising emphasis on ideological indoctrination at most colleges, economist Peter Morici suggests students might actually be better off buying gold coins.
Stuart Varney – Fox Business News: You say that about half of the college students who are going to college this week are making a lousy investment. Right from the get-go, tell us why you’re saying that?
Peter Morici: Well, the graduation rate is so low. I mean it’s about 60% is the average graduation rate. Okay? And then you have about a quarter of the people that actually graduate don’t earn any more than the average high school graduate. These humanities colleges, basically they teach them eco-feminism, and they prepare them to work on the AOC campaigns. But there’s only so many jobs on Capitol Hill for hysterical liberals. About 40% of college graduates cannot pass a generic exam in critical thinking. Other examinations show that the colleges have no value added. That the students are about as dumb as they were going out as when they came in or as bright as they were coming in.
A lot of people go for a year or two, pile up 10, 20 $30,000 worth of debt, even more at a private school. Other people spend all four years pile up even more debt. The students that don’t do well tend to pile up the most debt, because they get the least amount of financial aid. For them, college they had been better off buying gold.
Stuart Varney: Yeah. You’re right.
Peter Morici: Buying, those coins, burying them in the backyard and digging them up when they’re 40, when they’re too old to squander them.
Student loans are now the second largest category of American consumer debt, behind only mortgages. The student loan bubble is another sad consequence of government incentives and subsidies.
The U.S. government essentially nationalized the student loan market in 2010. It has issued more than $1 trillion in student loans since.
More than 5 million college educated Americans are now in default on their student loans. Millions more are foregoing things like home ownership and family formation because their bloated student loan payments are financially equivalent to having a mortgage.
The government-subsidized student loan bubble has enabled college administrators to raise tuitions and fees at a far steeper pace than overall price inflation.
Defenders of the traditional four-year college insist that it’s still a good investment for those who take their studies seriously. College is certainly a viable path to certain types of well-paying professions. But sending a kid off to college with no particular career path in mind other than to explore vague intellectual interests doesn’t work anymore.
When it comes to humanities, social sciences, and economics, ideological bias taints just about everything. Most economics students won’t even be exposed to alternative schools of thought such as Austrian economics. Free-thinking students will have to seek out those few schools and professors that teach non-Keynesian economics or else pursue independent studies.
Students won’t hear much discussion of sound money in a typical Economics 101 class. Standard economics textbooks portray the supposedly wise and informed decisions of central bankers and bureaucrats as being superior to sound money backed by gold and silver.
In reality, sound money is widely scorned in the economics establishment because gold is more effective than any number of Ph.D’s at constraining debt in the economy and spending by government.
For students who are interested in sound money principles, we do have some good news! Money Metals Exchange is teaming up with the Sound Money Defense to help students pay for the ever-increasing costs of college. We have set aside 100 ounces of physical gold to endow a long-term fund to reward outstanding students who display an understanding of economics, monetary policy, and sound money.
The Sound Money Scholarship is the first gold-backed scholarship of the modern era. It is open to high school seniors – as well as undergraduate and graduate students. Winners will be determined by a blue-ribbon panel of judges with professional backgrounds in economics.
The deadline to submit applications is coming up fast. They must be turned in by the end of the month, September 30th. You can find more information at moneymetals.com/scholarship.
Well now, without further delay, let’s get right to this week’s exclusive interview.
Mike Gleason: It is my privilege now to welcome back our good friend Greg Weldon, CEO and president of Weldon Financial. Greg has decades of market research and trading experience specializing in the metals and commodity markets, he even authored a book back in 2006 titled, Gold Trading Boot Camp where he accurately predicted the implosion of the U.S. credit market and urged people to buy gold when it was only $550 an ounce. He’s been making some other excellent calls in the metals here recently and it’s great to have him back with us.
Greg, thanks again for coming on and welcome. How are you?
Greg Weldon: I’m great, thank you Mike. My pleasure. I’m just very grateful that the storm spared us the carnage that it inflicted on The Bahamas. I’m here in Jupiter, Florida and it was supposed to be a direct hit here, so it was a pretty stressful holiday weekend down here.
Mike Gleason: Yeah, lots of different models that were kind of all over the place with that, but yeah, good thing for your part of the world there. I’m glad to hear that.
Well for starters here, Greg, you nailed it yet again. We spoke back at the end of June and you were on the verge of making a major move into silver, and you’re saying that if we could just take out $16.20 it would run pretty quickly from there, which it finally has.
So give us a sense of what you’ve been seeing here recently in silver and what finally got the white metal moving, which got well over $19 earlier in the week. Now it is suffering a pretty big pullback here today as we’re talking late morning on Thursday. So let’s start with silver, Greg. What did you see that led you to believe that we were finally going to break to the upside from that years long trading range and then also talk about this pullback here today?
Greg Weldon: Well I think it’s actually a common thread to both parts of the answer to your two-part question. And the first part is, what we saw was a dissociation in gold and silver, much more so gold, clearly from the dollar and the spread of gold rallying and then making new highs in such a widening basket of currencies, a lengthening list of global currencies. And it wasn’t just, you know, some of the emerging market currencies where you can no longer except the local currency in a place like Angola, a big OPEC producer… Pakistan, Argentina, of course, the currency blown up since even more. But then you had places like Australia and Sweden and it fed through to the whole thing in Europe where, you know, you had the Swedish Central Bank and the Swiss National Bank with interest rates that were beyond minus 1% at the official rate.
And the bottom line for me, Mike, the whole time, was you know the dollar is going to have to be the relief valve because you have intense this disinflation deflation building just from the pure fact you have so much sovereign debt in a negative interest rate, and I think that this was a big misstep by the central banks globally, particularly in Europe, because the goal was to kind of do what the Fed did at one point up to 2009, which was create a scenario and create an environment where it kind of forced you and your money into risk assets. The Fed did this very effectively after the 2009 crisis and reflated through the stock market and let consumers borrow again and so on and so forth.
In Europe, though, the misstep has been kind of in terms of guidance. The BIS did a really interesting study on this not too long ago. It’s 80 something pages. I read the whole thing. It was fascinating in terms of forward guidance to where the ECB basically said there’s no scenario that will be good enough, that would even cause us to think about raising interest rates in the next year, this is what they said a year ago. They should have been raising them by now.
But that forward guidance is such that it caused fear among investors, among households and consumers and instead of spending, instead of investing in stocks, what they did was, they were so fearful that the message here was what does the Central Bank know that we don’t know that’s coming down the pike next? That makes them so afraid to even contemplate raising rates to zero, that this was an issue now where you’re willing to pay a government for 30 years to safeguard your cash. I mean that is insanity and it draws all that money out of the real economy and boom, this is what you have in Europe. It’s an absolute mess.
You tie all this together, given the European Central Bank situation, what are they going to do. It left the dollar, it leaves the Central Bank here in the U.S., the Fed, as the one that has to move. We said way back in August, this wasn’t going to be quick. This was going to be a multi-step process to get the Fed to where they are today. I think the Fed made two mistakes. They hiked rates in December when they shouldn’t have. And then they didn’t give any kind of hint of forward guidance at the last central bank meeting when they did in fact cut rates. And now you’re even in a more intense situation where the fixed income markets demanding even more rate cuts down the road… throw in the Chinese trade factor… and you’ve got a real mess.
And the bottom line out of all of this, I can shave down what’s a really long answer into a very short one. What you have here is growing lack of confidence, anxiety, if not even fear and discomfort around all paper. And it’s around paper currencies, paper debt. It’s all the same, it’s all one big IOU. And the central banks are going to keep doing this and what they going to do next time around, $23 trillion in sovereign debt here in the U.S. versus nine? Are they going to print six to 9 trillion this time around? Well, if they do, and they probably will because you know they don’t want a debt deflation. It just creates enormously bullish outcomes on the probability curve for the precious metals. And we saw that developing, we saw the way the currencies were acting, that gold had broken away from the dollar, gold was rallying with the dollar. That was huge.
We swapped into silver because the gold/silver ratio had gotten completely out of whack, a 30-year high, and you knew then that there was a point and it was really kind of the next terrace, the next round of this trade dispute where people became really concerned that they’re going to go down such a deep hole here that maybe the central banks are not going to have such an easy time to lift them out of it. And then it became a monetary move more than kind of a bigger picture emerging market, you know, global macro move. Now it’s strictly a monetary move. And that’s when silver and even platinum just broke out.
Mike Gleason: Silver is outperforming gold now after lagging gold earlier in the rally. We talked about that 90 plus to one silver to gold ratio back in late June. And I know that extreme ratio was part of your reason that you liked silver at the time, as you just mentioned. Now historically, silver does outperform gold when prices are trending higher, but it took a little while for silver to play catch up. What are you expecting from silver given where we are today? Does it continue to outperform and will we see the ratio fall further in your view?
Greg Weldon: Yeah, absolutely. From the longer-term view, this is a three to five-year move. You may have seen a year of it already, so you still have a long term 24 to 48 month dynamic underway here. Having said that, there is some chance of a pullback here. Our upside targets, $1,505 was the first one in gold and you kind of went through it and silver $18.65 and that kind of gave us 21 bucks. You’re kind of almost halfway between those two levels. So that’s kind of interesting. You got kind of a reversal pattern here going on, on a short term basis.
But what’s interesting is to see this happen today (Thursday) as stock markets breakout on the back of what is now potentially a risk to the dollar. So we just did a big special piece on this yesterday in Weldon Live, which is our other publication other than the Gold Guru in which we were talking about the risk to the dollar here because of the movement in rate differentials.
And one of the things that has held the dollar up, two things fundamentally, has been a fear of a dollar debt dynamic and then demand for dollars to repay debt in some kind of debt deflationary scenario would be high and would circumvent anything the Fed did. And there’s evidence to suggest that because the dollar didn’t follow the Fed fund futures market, that’s for sure. And that correlation had been very tight since 2014 and completely got demolished. But what happened in that vein was yeah, U.S. rates were coming down but not as fast as they were in other places, particularly Europe. So, what you had happen was the yield differential, the bond yield, particularly the 30-year, most highly correlated to the dollar, blew out in terms of the U.S. yield premium because Germany’s 30-year was dropping towards zero.
Well, great that the U.S. 30-year went from three and a quarter to two and made record low at the meantime, the German 30-year’s, flirting with negative yields. So, what’s happened more recently is that there are limits in physics as to how far and how much these bonds can go negative. No matter how much they talk about this, not the next big move. You and I have talked about a little bit probably coming next, it’s going to QE rather on steroids…. probably first from the ECB but that’s still another maybe one, if not two steps away as well.
And in the meantime there is some concern here that in the first phase of a dollar kind of crack if you will, that might boost stock to where money rotates out of metals back into stocks. A very short-term correction could develop here. We’re traders so we’re more in tune with that, for investors who cares? Because the longer term picture, the two to four year picture, is very bullish and silver will outperform because this is going to be a monetary dynamic that exceeds all the other monetary dynamics.
Look at 1987 and the stock market crash on any chart, monthly chart of the Dow now. Do you, I mean it really, it looks like nothing even happened. That gives you the magnitude where we are now. When you’re talking about a 30,000 on the Dow Jones Industrial Average, you know, a one third correction, that’s a lot of money now. It’s 10,000 points. So, everything’s extrapolated and it kind of gets back to even our hurricane situation, because there’s a lot of this has to do, and we could get really deep here, but we won’t… but a lot of this has to do with astrophysics and where our solar system is in the Milky way right now. What tends to happen in physics, you have certain readings, Schumann resonance, and the gas readings. What you have right now is things are increasingly stretched. They’re polarized. You see it in everything.
You see it in politics in this country for sure, but you see it in the weather. It’s not necessarily that it’s global warming, although it is. It’s record cold, record heat, record flooding, record drought, record hurricanes, record volcanic activity, record everything. That’s only going to continue. And in that vein, as you apply that to the markets, the map around the money that’s been created, the debt that’s been created when you have to keep this thing going, because to let a debt deflation take over central banks, that’s the absolute last thing they want to see.
And we said in the book in 2006 and I say it again here, when facing the abyss of a debt deflation, they will do whatever they have to do to reflate. And what’s probably coming next is going to be shock and awe and you’re going to want to be long gold, because they are devaluing the purchasing power of all paper and people are finally starting to see that.
Mike Gleason: Switching gears here a little bit, Greg, we saw a former FOMC member, William Dudley, write an op-ed in which he suggests the Fed tried to un-elect President Trump by refusing to provide stimulus and letting the President’s trade war pull the U.S. economy into recession. That is a remarkable position for a former central banker to take. And it raises the question about whether the Fed might take an active role in the 2020 election. What do you think? Will the Fed go along with the President and with some of the pressure from the markets and reduced rates in the months ahead or are they going to allow a recession here for reasons which might include politics?
Greg Weldon: Well, this is such a double-edged machete, because of course the Fed’s political, but of course the Fed’s not political. So, as an independent body, and let’s not forget the Fed was created in 1913 to offset crashes in the stock market. So, it’s kind of funny that everyone says, “Oh, this isn’t the Fed’s job.” Of course this is what they do. It’s what they’ve always done. Alan Greenspan, in 1987, I was there. I was surprised. They continually give us more and more creative ways to do things.
In terms of what William said, it’s almost like ding dong, the witch is dead, because what he’s done is it’s almost like, I mean, it’s kind of like he’s an ex-Postal employee. He’s gone in and shot up the place because the Fed wants to remain, at least to have the appearance of being totally independent and totally apolitical. And this guy just threw that out the window. I mean, this is one of those things where if you go into the criminal world, right, and the gangs and whatever they call them, cartels and stuff, I mean, you snitch, you’re done. So, I wouldn’t be surprised they have hit squads looking for this guy because it’s so taints the Fed and no, they’re not going to do that.
I don’t think they would do that. I don’t think Powell seems like he’s that ego driven. This is Donald Trump’s ego. It’s not Powell’s ego. I know some people that work with Trump, not that I’m supporting either side of any of this, but I think people generally agree, even those close to him, that he can be his own worst enemy. Sometimes you just got to shut it. Keep it quiet.
And my suggestion with the Fed is the less you say, the better off you are and he’s put himself in a bad position. Why would the Fed then want to feed into that? I don’t know. The whole thought process around bringing the economy to a recession, to un-elect Donald Trump. That is a symptom of what’s happening in this country, where the hatred for one man, for his personality, his aura, not his policies. Nobody’s really able to separate these two things. And they’re different because in many ways he’s not a likable character. His ego and his persona, he’s kind of bombastic and bit of a buffoon sometimes and waving his hands. He doesn’t have the greatest vocabulary.
His policies are spot on. So, I think the difficulty in separating those two things is, when you get a situation like this where the hatred for one man is now trumping, yes, pun intended, trumping the love for country. We see it everywhere and it just blows my mind. And frankly, it’s symptomatic of the things I’ve been talking about in more of a scientific angle because this has an impact on the way human beings act too. And you see it, you see it. It’s increasing random acts of violence and it’s increasing random acts of kindness.
And I’ll tell you what, we got a ton of random acts of kindness taking place down here in terms of relief for The Bahamas because there was a great connection between South Florida and The Bahamas. So, you see it on both ends of the spectrum. And for Williams to say something that only damages the Fed’s credibility and it’s only bullish for gold because it does so.
Mike Gleason: Yeah. Well put. Well Greg, as we begin to wind things down in the interview here, I wanted to get your thoughts on platinum because I had a pretty good move here recently over the last week. What do you have to say about platinum, Greg? Is it finally emerging from its years long hibernation?
Greg Weldon: Well absolutely. I think when you started to see platinum at exceeding $500 an ounce discount to gold. Again, kind of getting back to some of the physics, you know as well as I know, stuff is created in a supernova platinum is more rare than is gold. And from that perspective it should command a premium. I understand that it’s not that black and white, but to me that makes it interesting when you see it as a $600, $700 discount to gold. And when you see and know that the next wave is more of a monetary thing in a bigger picture, then really kind of a setup for that, which is when the dollar was declining against gold. And when gold was making new highs in so many different currencies, record highs, Australia dollar, Swedish krona… it’s that simple, you throw those two currencies out there. And in that vein, platinum, absolutely was the laggard because, if this is something that causes the trade war to become bigger, that would hurt platinum at the expense of gold simply as an industrial metal. But how much of that a price then at minus $700?
To me, these were steals in platinum and silver at the levels at which they had reached against gold were extreme and that has really paid off for us. We actually, kept the core holding of gold, but we swapped our big position in gold that we bought at like $1,196 and I forget where we sold it. It was above, $1,400… $1,411 maybe, and pushed everything into platinum and silver, which had barely still moved. And that turned out to be a really good move.
Mike Gleason: Well Greg, as we close here, any other final comments? I would like to hear kind of where you’re thinking we go from here in the precious metals and then also maybe tie in the the new Gold Guru site.
Greg Weldon: Yeah. Well, where we go from here I think is you have probably some short-term volatility, maybe some downside, but it’s an opportunity if you’re not invested to get invested. It’s an opportunity if you’re not, don’t have like what you might consider the full position you want to have to put it on. We’re looking at, for example, the GDX has been one of our picks. We have a lot of picks. Gold Guru, it’s Gold-Guru.com. We have all of this and today’s piece really kind of gives you about what I’m giving you now and even in a broader sense, but when you look at the GDX. It topped out at almost 31 bucks. It’s had a pretty decent, what will be potentially a key outside/downside reversal week here in a lot of these things.
Not only that, you have upside reversals in the base metals I might mention too copper, tin, zinc, particularly the metals that are in short supply in LME warehouses. But all of this kind of plays into a lower dollar, which is bullish, longer term. So, you’re looking to buy dips. I’ll give you what we’re looking for in gold. If you get gold below $1,370 it’s a gift. Your first major Fibonacci is $1,407 and you have a low just under there, just under $1,400, it’s kind of where we ended up getting out and getting into silver and platinum. So I would think if, frankly if you see a 13 anything print, you’re even potentially backing up the truck here to buy gold.
And in terms of silver, it might have a little more of a downside, but I’m telling you, I mean there’s solid, solid support at $17.25 to $17.50 so in any… anything really below $18 and when you get down to $17.50. It may not last real long down there. I think you might have a correction, get some chop, wait and see what the Fed does. And when you come out of this in the next phase when the ECB has to do something, because the other part we’re working on, you know, we also do Weldon Live as well. So it’s the Gold-Guru.com and it’s WeldonOnline.com for a Weldon Live, which is our institutional product. But today we’re working on a piece on places like Poland and Hungary that have been very strong because Germany’s export juggernaut, had been so strong while Germany’s export juggernaut is not only slowed, it’s tipping into a recession, terrible data today, terrible data last week. We highlighted all Italy, France, Belgium, all these countries.
But when you look at Poland, Hungary, and the Czech Republic, they had really been the second derivatives of a global economic strength out of Germany… shipping, unfinished goods to be finished in Germany to be shipped out…. these economies, the inflation numbers there, the production, are really starting to fall. Europe has a problem. And ultimately when they pull the trigger on what’s coming next, I think it’d be very bullish for gold, short-lived, shallow-ish correction. But don’t wait too long and don’t hesitate if it happens, because I think you know you’re going to come out of the shoots again to the upside very quickly in the not too distant future.
Mike Gleason: There’s a lot of information flying around out there in the financial world and one thing that I’ve noticed about you, Greg, is you understand which ones to really look at and pay attention to that drive these markets and obviously that’s what’s helped you make some fantastic calls over the last several months and years. And I always love having you on and getting a chance to talk to you about that stuff.
Hope you have a wonderful weekend. Glad you’re going to stay safe from the hurricane there. All our best to those that may be affected by that in the coming days and thanks Greg, can’t wait for our next conversation. Bye for now.
Greg Weldon: Always my pleasure, Mike. Thank you.
Mike Gleason: Well, that will do it for this week. Thanks again to Greg Weldon of Weldon Financial. For more information, simply go WeldonOnline.com where you can sign up for a free trial. Be sure to check out the Gold Trading Bootcamp and now the new site Gold-Guru.com. Be sure to check that out as well.
Mike Gleason: And check back here next Friday for our next Weekly Market Wrap Podcast. Until then, this has been Mike Gleason with Money Metals Exchange, thanks for listening and have a great weekend everybody.
The Money Metals News Service provides market news and crisp commentary for investors following the precious metals markets.
In the increasingly risky FX landscape single pair/cross risk may no longer be the best option to trade due to gapping and being stopped out.
We only have to look back at the month of August to see this kind of risk playing out.
EUR, GBP, AUD, NZD and the Scandinavian currencies all took a hit on geopolitics, global growth fears and the bond market rally. EM FX in particularly had a shocker in August, and if we look at the current setups in EM FX the likelihood of further steep losses is high as event risk and growth fears continue to unfurl throughout September.
Similar issues are facing the EUR and GBP. Germany on the verge of a technical recession, France is stuck in a lackluster inflation and manufacturing environment and Italy facing further political upheaval from its government.
Couple this with the expected suite of monetary policy changes from the ECB and we have an EUR under real pressure. Now, even if the ECB disappoints and doesn’t go as hard as the market is pricing it will be quickly overrun by the above issues.
Brexit is also moving into an ‘end-game’ scenario as the October 31 st deadline looms large. The developments in the Parliament are changing thick and fast and even though a hard Brexit now looks less likely after the events of this week which has pushed the GBP back above $1.22 it does not hide the fact that no actual agreeable deal is near.
Furthermore, the Fed remains on a path of ‘cautious easing’ the likelihood of disappointing a market that is wanting a move aggressive cut is high. Watch for a snapback in the US curve and DXY of this ‘disappointment’.
Caveat: all these factors are relatively well known don’t expect a prolonged sell-off or a structural change in momentums. But, it does all point to single pair risk being high.
This is why DXY is probably a good option to turn too. It gives some ‘diversification’ risk management and does allow techincals to feed into your trading.
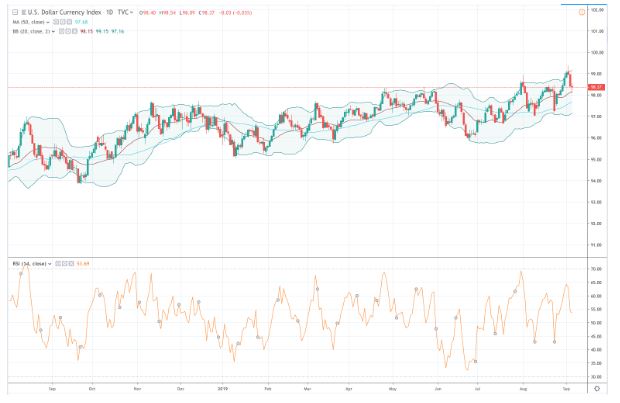
If look at the daily chart, DXY has moderately shifted higher over the past 52 weeks. However, the main has traded nicely inside its Bollinger bands reverting back to mean each time it has tested the top or the bottom band.
The RSI confirms this view and shows that DXY hasn’t gone through overbought or oversold territory all year but above 62 it tends to be sold off and on or below 40 its brought back.
DXY then, should, at leas,t give some confidence that your techincals can give you direction with being trumped by single pair event risk that stops you out or is run over by a gap.
The firm’s final quarter and full-year results are reviewed in a Ladenburg Thalmann report.
In an Aug. 30 research note, Ladenburg Thalmann analyst Jeffrey Cohen reported Mesoblast Ltd.’s (MESO:NASDAQ; MSB:ASX) financial results for Q4/19 and fiscal year 2019 (FY19).
As for Q4/19, revenue came in at $2 million, above Ladenburg’s $1.9 million estimate but below consensus’ $2.3 million projection. Of the total $2 million, $0.3 million came from interest, the remainder from royalties. Royalty revenue increased about 54% during the quarter from sales of TEMCELL HS Inj. in Japan. Operating expenses were $19.5 million.
Mesoblast posted a Q4/19 net loss of $20.7 million, less than both Ladenburg and the Street’s projections of $25.2 million and $37.4 million, respectively.
Regarding FY19, the regenerative medicine company generated $16.7 million in revenue. Of that, $11 million came from milestones, $5 million from commercialization and $0.7 million from interest.
FY19 opex totaled $97 million, composed of $21.6 million for general and administrative (G&A) expenses, $59.8 million for research and development and $15.4 million for manufacturing and commercialization. As expected, G&A and manufacturing expenses drove the higher FY19 opex.
For the year, Mesoblast had a net loss of $90 million.
Cohen presented some of the company’s recent highlights that management mentioned in the earnings conference call.
One, Mesoblast submitted an investigational new drug application to the U.S. Food and Drug Administration (FDA) for remestemcel-L in children with graft versus host disease (GvHD). Management reiterated it intends to further expand its remestemcel-L clinical program to include adults with GvHD.
Also, in a meeting with the FDA, the agency outlined the most efficient pathway for Mesoblast to get marketing authorization for Revascor. Because reduced major GI bleeding events is an important clinical outcome for patients with a left ventricular assist device, data from the placebo-controlled Revascor trial that demonstrated that outcome could support marketing authorization through a biologics license application.
Cohen highlighted that Mesoblast is “set up for a robust 2020 with multiple late-stage data readouts.” For instance, readout of 24-month data from its trial evaluating MPC-06-ID is expected by mid-calendar year 2020.
Ladenburg Thalmann has a Buy rating and an $11.25 per share price target on Mesoblast, whose stock is now trading at around $4.88 per share.
Disclosure: 1) Doresa Banning compiled this article for Streetwise Reports LLC and provides services to Streetwise Reports as an independent contractor. She or members of her household own securities of the following companies mentioned in the article: None. She or members of her household are paid by the following companies mentioned in this article: None. 2) The following companies mentioned in this article are billboard sponsors of Streetwise Reports: None. Click here for important disclosures about sponsor fees. 3) Comments and opinions expressed are those of the specific experts and not of Streetwise Reports or its officers. The information provided above is for informational purposes only and is not a recommendation to buy or sell any security. 4) The article does not constitute investment advice. Each reader is encouraged to consult with his or her individual financial professional and any action a reader takes as a result of information presented here is his or her own responsibility. By opening this page, each reader accepts and agrees to Streetwise Reports’ terms of use and full legal disclaimer. This article is not a solicitation for investment. Streetwise Reports does not render general or specific investment advice and the information on Streetwise Reports should not be considered a recommendation to buy or sell any security. Streetwise Reports does not endorse or recommend the business, products, services or securities of any company mentioned on Streetwise Reports. 5) From time to time, Streetwise Reports LLC and its directors, officers, employees or members of their families, as well as persons interviewed for articles and interviews on the site, may have a long or short position in securities mentioned. Directors, officers, employees or members of their immediate families are prohibited from making purchases and/or sales of those securities in the open market or otherwise from the time of the interview or the decision to write an article until three business days after the publication of the interview or article. The foregoing prohibition does not apply to articles that in substance only restate previously published company releases.
Disclosures from Ladenburg Thalmann, Mesoblast Ltd., August 30, 2019
ANALYST CERTIFICATION: I, Jeffrey S. Cohen, attest that the views expressed in this research report accurately reflect my personal views about the subject security and issuer. Furthermore, no part of my compensation was, is, or will be directly or indirectly related to the specific recommendation or views expressed in this research report, provided, however, that:
The research analyst primarily responsible for the preparation of this research report has or will receive compensation based upon various factors, including the volume of trading at the firm in the subject security, as well as the firms total revenues, a portion of which is generated by investment banking activities.
COMPANY SPECIFIC DISCLOSURES:
Ladenburg Thalmann & Co. Inc. intends to seek compensation for investment banking and/or advisory services from Mesoblast Ltd. and Vericel Corporation within the next 3 months. Ladenburg Thalmann & Co. Inc. makes a market in Vericel Corporation. Ladenburg Thalmann & Co. Inc. has managed or co-managed a public offering for Vericel Corporation within the past 12 months. Ladenburg Thalmann & Co. Inc received compensation for investment banking services from Vericel Corporation within the past 12 months. Ladenburg Thalmann & Co. Inc had an investment banking relationship with Vericel Corporation within the last 12 months.
The MACD (typically read as “mac D”) is one of the most popular indicators among forex traders. It’s a very useful tool in your trading arsenal. And it’s helpful even if you aren’t using it as your main signal generator!
One of the reasons it’s so popular is that it’s a very versatile trading indicator, despite being relatively simple in construction. This allows it to have multiple and varied applications which help forex traders develop their own style when using it.
Because of its versatility, you could probably write a whole book on how to squeeze the last drops of utility out of it. So, let’s focus on the basics to get a good understanding of how the MACD’s gears synch. And, from there, you can customize it to your preference.
The Converging Divergence
The MACD combines one of the most effective and popular forex trading styles; divergence, with crossovers. This allows it to generate a wealth of signals to suit most FX trading styles. It even allows it to “check” itself in providing parallel analysis points.
The name comes from Moving Average Convergence Divergence. It works based on two exponential moving averages, a fast and a slower one. The difference between those is then represented in the “histogram” (the solid bars). The slower EMA is graphed on top of the histogram, providing the signals (and thus is often called the “signal line”).
The Theory
By playing two exponential moving averages off each other, the MACD is looking to identify a forex market trend, and then find when it’s becoming exhausted. This allows for the “crossover” function of the signals. By definition, before the market can go in a new direction, it has to cross over the prior trend.
The MACD offers a level of sophistication to this basic principle by plotting the difference between the slow and fast EMA, showing the momentum of the market. Signals are produced when the momentum crosses through the trendline, not just when the EMA does. You see this on the chart when the trend in histogram bars cross underneath the signal line.
The Practice
Because the idea is to catch changes in trend, generally you’d say a signal was produced when the histogram crosses the signal line in the direction towards the centerline (0 on the chart). Why? Well, because the histogram measures the difference between the long and short term trend. If the long trend is changing direction, then the difference between it and the short term trend will shrink until they are running parallel. Then the trend changes.
This means that the bigger the histogram bars, the further the short term trend has drifted from the long term one. And the more likely the market is to reverse to the mean. This is why it’s popular among swing forex traders, as well. The deviation of the histogram from the signal line can show the market becoming oversold or overbought.
Divergences
By generating a histogram, the MACD can also be used quite effectively to show market divergences as well. This happens as the market trends in one direction, but the histogram moves in the other. At the end of the divergence, you’ll expect to have a market reversal, the favorite position for most forex traders.
Why this happens is that the longer a trend exists, the more likely it is to get exhausted. This presents as smaller movements in the short term trend, and that allows the long term trend to catch up. The histogram bars become shorter, indicating market exhaustion. Eventually, the counter move will push the histogram to cross the signal line, showing you have an opportunity to get into the market.
The Caveats
No indicator is perfect and complete. While the MACD is very useful and versatile, it’s always better to trade an indicator in conjunction with another to verify signals. And always keep an eye on the price action to set your safeties properly.
Hopefully now that you know why the signals are produced by the MACD, you can have a better understanding of strategy development using this neat indicator.
The study data and their implications are provided in a BTIG report.
In an Aug. 29 research note, BTIG analyst Thomas Shrader reported that just released topline data are “as hoped” from Esperion Therapeutics Inc.’s (ESPR:NASDAQ) Phase 2 trial of bempedoic acid-ezetimibe combination therapy in patients with hypercholesterolemia and type 2 diabetes.
Shrader relayed the results, which were from the study’s 12-week point.
The trial met primary and key secondary endpoints. For one, low density lipoprotein (LDL) cholesterol dropped “an impressive” 40% versus 20% in patients getting ezetimibe alone. HsCRP decreased 25%. Glycemic control did not worsen, and there were no increases in adverse events.
In about 40% of the patients, LDL cholesterol decreased by more than 50% to levels under 70 milligrams per deciliter. This compares to about 5% in the ezetimibe-only cohort. These combination patients also experienced 27% reductions in total cholesterol and ApoB along with a 33% drop in non-high density lipoprotein (HDL) cholesterol.
What this means, highlighted Shrader, is the bempedoic acid combination got “two times the number of patients to a moderately better place (LDL cholesterol less than 100) and nearly eight times the patients to the new happy zone (LDL cholesterol lower than 70).” In other words, 20% of the market is not achieving the latter.
Shrader pointed out that “a potentially a nice attribute of” bempedoic acid is it might be a better choice for people on the cusp of developing type 2 diabetes because other statins at high doses tend to increase HbA1c. However, “a lot more work needs to be done to establish this claim,” he added.
Esperion is currently working with payers to get the drug into the lowest co-pay tiers, noted Shrader. “We see these negotiations with payers as important and a key read on market ‘pull’ for bempedoic acid.”
BTIG has a Buy rating and an $82 per share target price on Esperion. The stock is currently trading at around $33.59 per share.
Disclosure: 1) Doresa Banning compiled this article for Streetwise Reports LLC and provides services to Streetwise Reports as an independent contractor. She or members of her household own securities of the following companies mentioned in the article: None. She or members of her household are paid by the following companies mentioned in this article: None. 2) The following companies mentioned in this article are billboard sponsors of Streetwise Reports: None. Click here for important disclosures about sponsor fees. 3) Comments and opinions expressed are those of the specific experts and not of Streetwise Reports or its officers. The information provided above is for informational purposes only and is not a recommendation to buy or sell any security. 4) The article does not constitute investment advice. Each reader is encouraged to consult with his or her individual financial professional and any action a reader takes as a result of information presented here is his or her own responsibility. By opening this page, each reader accepts and agrees to Streetwise Reports’ terms of use and full legal disclaimer. This article is not a solicitation for investment. Streetwise Reports does not render general or specific investment advice and the information on Streetwise Reports should not be considered a recommendation to buy or sell any security. Streetwise Reports does not endorse or recommend the business, products, services or securities of any company mentioned on Streetwise Reports. 5) From time to time, Streetwise Reports LLC and its directors, officers, employees or members of their families, as well as persons interviewed for articles and interviews on the site, may have a long or short position in securities mentioned. Directors, officers, employees or members of their immediate families are prohibited from making purchases and/or sales of those securities in the open market or otherwise from the time of the interview or the decision to write an article until three business days after the publication of the interview or article. The foregoing prohibition does not apply to articles that in substance only restate previously published company releases.
Disclosures from BTIG, Esperion Therapeutics Inc., August 29, 2019
Analyst Certification I, Thomas Shrader, PhD, CFA, hereby certify that the views about the companies and securities discussed in this report are accurately expressed and that I have not received and will not receive direct or indirect compensation in exchange for expressing specific recommendations or views in this report. I, Julian Harrison, hereby certify that the views about the companies and securities discussed in this report are accurately expressed and that I have not received and will not receive direct or indirect compensation in exchange for expressing specific recommendations or views in this report.
The research analyst(s) responsible for the preparation of this report receives compensation based upon a variety of factors, including the quality and accuracy of research, internal/client feedback, and overall Firm revenues.
The argument for deeper interest rate cuts by the Federal Reserve was reinforced on Friday after hiring in the United States stumbled in August.
Total nonfarm payrolls disappointed market expectations by rising 130,000 versus the 160,000 forecasts. When considering how the figure was boosted by 25,000 temporary government workers because of the upcoming US consensus count, the underline jobs growth was only 105,000. Although unemployment rate held steady at 3.7% and average hourly earnings increased by 0.4% month-on-month, the sore spot in the report was the soft headline NFP figure. Concerns over weakness in the US labour market threatening consumer spending should fuel speculation over the Fed cutting interest rates again beyond September.
Appetite towards the Dollar took a slight hit following the jobs report with the Dollar Index trading around 98.11 as of writing. Sustained weakness below 98.50 should encourage a decline towards 98.00 in the week ahead.
Disclaimer: The content in this article comprises personal opinions and should not be construed as containing personal and/or other investment advice and/or an offer of and/or solicitation for any transactions in financial instruments and/or a guarantee and/or prediction of future performance. ForexTime (FXTM), its affiliates, agents, directors, officers or employees do not guarantee the accuracy, validity, timeliness or completeness, of any information or data made available and assume no liability as to any loss arising from any investment based on the same.
The compelling reasons behind those descriptors are explored in a Dawson James Securities report.
In an Aug. 26 research note, analyst Jason Kolbert reported that DawsonJames Securities initiated coverage on Fortress Biotech Inc. (FBIO:NASDAQ) with a Buy rating and a $19 per share price target. The stock is currently trading at around $1.74 per share.
Kolbert described Fortress as having “a unique model that manages risk but keeps the upside.” The company has more than 25 candidates across six markets in development. Its robust, diversified pipeline encompasses seven commercialized products, along with eight late-stage and seven early-stage clinical products. “Combined, Fortress’ clinical phase products have a market opportunity in the billions,” the analyst pointed out.
Also, the biopharmaceutical firm has key investments in about 10 companies that contribute to its overall valuation. The analyst reviewed a handful of them along with their estimated potential value to Fortress.
1. Through its roughly 32% ownership of Avenue Therapeutics, Fortress “stands to pick up a $55 million milestone,” noted Kolbert. Avenue is developing intravenous Tramadol to treat more moderate postsurgical pain without causing addiction. In two recent Phase 3 trials, Avenue’s product showed statistically significant improvement in its primary endpoint(s) and all key secondary endpoints.
2. Fortress owns about 30% of Mustang Therapeutics and is entitled to a 4.5% royalty in MB-107, as well as a 2.5% equity dividend annually, Kolbert indicated. MB-107 is a gene therapy that Mustang is developing for bubble boy disease. MB-107 alone could result in an estimated $75 million for Fortress just for the partial ownership. Adding in the royalty and dividend takes it closer to $100 million.
3. With Checkpoint Therapeutics, Fortress owns 32% of the company and is entitled to a 4.5% royalty on sales of CK-101, an EGFR tyrosine kinase inhibitor (TKI), and cosibelimab, an anti-PD-L1 antibody, along with an annual 2.5% equity dividend. “Clinical progression of the TKI could go pivotal in 2020 and the PD-L1 in 2021,” wrote Kolbert. Accounting for Fortress’ percentage ownership only, these programs could generate about $640 million in value it.
4. As for Cyprium Therapeutics, Fortress owns 89% of the company and gets a 4.5% royalty. Cyprium is developing CUTX-101 for the rare genetic disorder, Menkes disease. With a Phase 3 trial in progress, receipt of a new drug application approval could potentially happen in 2020.
5. Caelum Biosciences’ lead candidate is CAEL-101, a therapy designed to reduce or eliminate amyloid deposits in patients with AL amyloidosis. It is being developed in partnership with Alexion Pharmaceuticals. Fortress owns 43% of Caelum, a position valued at about $50 and $75 million “and we note that acquisition is triggered if Alexion is acquired,” added Kolbert.
Fortress is the 100% owner pf Journey Medical Corp., whose dermatology franchise generated $23 million in revenue in 2018 and whose lead candidate is Targadox for acne. “The company is cash flow positive today and could contribute $510 million in cash annually depending on the growth of the core franchise,” Kolbert relayed.
Additionally, Fortress owns a number of internal, early-stage private companies, including Aevitas Therapeutics (gene therapy), Cellvation (traumatic brain injury), Helocyte (cytomegalovirus) and Tamid Bio (adenoassociated virus gene therapies).
Kolbert concluded that, yes, undoubtedly, Fortress’ pipeline and equity positions offer value, but the company’s “real value is in the discovery, licensing, company infrastructure (access to a pool of EO/CFO/CMO/CSOs and the right boards) as well as established vendors (CROs, investment banks, regulatory expertise) to create the next company.”
Disclosure: 1) Doresa Banning compiled this article for Streetwise Reports LLC and provides services to Streetwise Reports as an independent contractor. She or members of her household own securities of the following companies mentioned in the article: None. She or members of her household are paid by the following companies mentioned in this article: None. 2) The following companies mentioned in this article are billboard sponsors of Streetwise Reports: None. Click here for important disclosures about sponsor fees. 3) Comments and opinions expressed are those of the specific experts and not of Streetwise Reports or its officers. The information provided above is for informational purposes only and is not a recommendation to buy or sell any security. 4) The article does not constitute investment advice. Each reader is encouraged to consult with his or her individual financial professional and any action a reader takes as a result of information presented here is his or her own responsibility. By opening this page, each reader accepts and agrees to Streetwise Reports’ terms of use and full legal disclaimer. This article is not a solicitation for investment. Streetwise Reports does not render general or specific investment advice and the information on Streetwise Reports should not be considered a recommendation to buy or sell any security. Streetwise Reports does not endorse or recommend the business, products, services or securities of any company mentioned on Streetwise Reports. 5) From time to time, Streetwise Reports LLC and its directors, officers, employees or members of their families, as well as persons interviewed for articles and interviews on the site, may have a long or short position in securities mentioned. Directors, officers, employees or members of their immediate families are prohibited from making purchases and/or sales of those securities in the open market or otherwise from the time of the interview or the decision to write an article until three business days after the publication of the interview or article. The foregoing prohibition does not apply to articles that in substance only restate previously published company releases.
Disclosures for Dawson James Securities, Fortress Biotech Inc., August 26, 2019,
The Firm does not make a market in the securities of the subject company(s). The Firm has NOT engaged in investment banking relationships with Dare in the prior twelve months, as a manager or co-manager of a public offering and has NOT received compensation resulting from those relationships. The Firm may seek compensation for investment banking services in the future from the subject company(s). The Firm has not received any other compensation from the subject company(s) in the last 12 months for services unrelated to managing or co-managing of a public offering.
Neither the research analyst(s) whose name appears on this report nor any member of his (their) household is an officer, director or advisory board member of these companies. The Firm and/or its directors and employees may own securities of the company(s) in this report and may increase or decrease holdings in the future. As of July 31, 2019, the Firm as a whole did not beneficially own 1% or more of any class of common equity securities of the subject company(s) of this report. The Firm, its officers, directors, analysts or employees may affect transactions in and have long or short positions in the securities (or options or warrants related to those securities) of the company(s) subject to this report. The Firm may affect transactions as principal or agent in those securities.
Analysts receive no direct compensation in connection with the Firm’s investment banking business. All Firm employees, including the analyst(s) responsible for preparing this report, may be eligible to receive non-product or service specific monetary bonus compensation that is based upon various factors, including total revenues of the Firm and its affiliates as well as a portion of the proceeds from a broad pool of investment vehicles consisting of components of the compensation generated by investment banking activities, including but not limited to shares of stock and/or warrants, which may or may not include the securities referenced in this report.
Analyst Certification: The analyst(s) whose name appears on this research report certifies that 1) all of the views expressed in this report accurately reflect his (their) personal views about any and all of the subject securities or issuers discussed; and 2) no part of the research analysts compensation was, is, or will be directly or indirectly related to the specific recommendations or views expressed by the research analyst in this research report; and 3) all Dawson James employees, including the analyst(s) responsible for preparing this research report, may be eligible to receive non-product or service specific monetary bonus compensation that is based upon various factors, including total revenues of Dawson James and its affiliates as well as a portion of the proceeds from a broad pool of investment vehicles consisting of components of the compensation generated by investment banking activities, including but not limited to shares of stock and/or warrants, which may or may not include the securities referenced in this report.
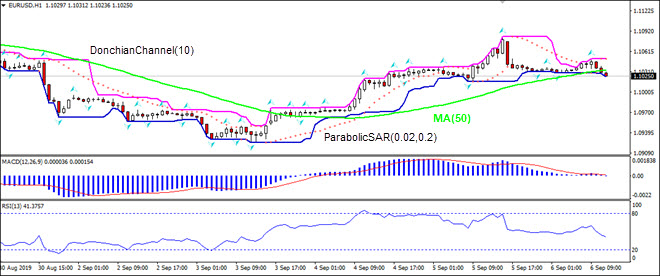
Germany’s industrial orders decline bearish for EURUSD
Factory orders in Germany fell more than expected in July. Will the EURUSD continue falling?
A look at the price chart on 1-hour timeframe shows EURUSD: H1 is still trading sideways. The price has fallen below the 50-period moving average MA(50) which is levelling off. And the RSI is falling toward oversold zone. There is no trend yet formed, traders have to decide when would be a best time to enter the market.