Dollar strengthening intact despite disappointing jobs report
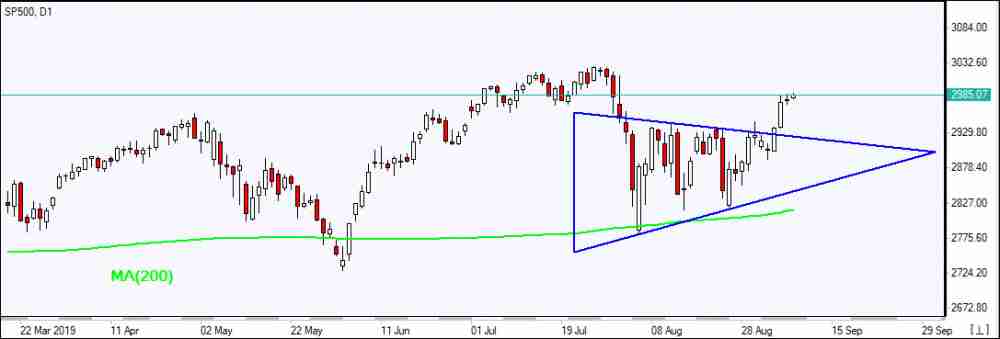
US stock indexes ended marginally higher on Friday despite disappointing August jobs report . The S&P 500 gained 0.1% to 2978.71, extending gains 1.5% for the week. Dow Jones industrial rose 0.3% to 26797.46. The Nasdaq however slipped 0.2% to 8103.07. The dollar strengthening continued even as the Labor Department reported US economy added below expected 130,000 jobs in August. The live dollar index data show the ICE US Dollar index, a measure of the dollar’s strength against a basket of six rival currencies, inched up 0.02% to 98.41 and is higher currently. Stock index futures point to higher openings today.
DAX leads European indexes movement
European stocks rose third straight session on Friday as reports US and China will resume trade talks next month boosted market sentiment. Both EUR/USD and GBP/USD turned lower Friday with euro rising currently against the dollar while Pound continuing its slide. The Stoxx Europe 600 Index gained 1.7% for the week. The DAX 30 rose 0.5% Friday to 12191.73 despite unexpected decline in German industrial output in July. France’s CAC 40 advanced 0.2% and UK’s FTSE 100 added 0.2% to 7282.34.
Shanghai Composite leads Asian indexes gains
Asian stock indices are mostly higher today. Nikkei rose 0.6% to 21328.42 despite a stronger yen against the dollar even after a downgrade of Q2 GDP to 1.3% from 1.5% first estimate. China’s markets are mixed after Friday data showed decline in China’s trade with US in August: the Shanghai Composite Index is up 0.8% while Hong Kong’s Hang Seng Index is 0.1% lower. Australia’s All Ordinaries Index ticked up 0.01% with the Australian dollar’s climb against the greenback intact.
Brent futures prices are extending gains today as Saudi Arabia signals OPEC will continue crude output cuts under new Energy Minister Prince Abdulaziz bin Salman. Prices rose on Friday: Brent for November settlement ended 1% higher at $61.54 a barrel Friday, adding 3.9% for the week.
Note: This overview has an informative and tutorial character and is published for free. All the data, included in the overview, are received from public sources, recognized as more or less reliable. Moreover, there is no guarantee that the indicated information is full and precise. Overviews are not updated. The whole information in each overview, including opinion, indicators, charts and anything else, is provided only for familiarization purposes and is not financial advice or а recommendation. The whole text and its any part, as well as the charts cannot be considered as an offer to make a deal with any asset. IFC Markets and its employees under any circumstances are not liable for any action taken by someone else during or after reading the overview.
Bob Moriarty of 321 Gold explains what one indicator is showing for the precious metals.
When you are climbing the steepest of mountains, especially at high altitudes, it can be tiring. If you start getting a nosebleed, you are simply working too hard and need a break.
The DSI (Daily Sentiment Index) on gold hit 97 four weeks ago and while it has struggled to keep up with its fellow climbers with their burst of speed, both silver and platinum are starting to look shaky.
On September 4th the DSI for silver hit 95 for the 2nd day in a row while platinum vaulted to 94.
Those are nosebleed readings.
With $17 trillion in sovereign debt around the world showing negative interest rates the old saw of “gold doesn’t have a return” has changed to “gold doesn’t lose money for holding it.” Indeed Central Banks around the world have been net buyers of gold for the last ten years.
I suppose I will have to change my tune as clearly the Central Banks have been manipulating gold and I never even noticed. I wonder why no one warned us they were forcing gold higher. Good for them, guys, keep it up.
Gold, silver and platinum will rest for a while but we haven’t seen a top. The upcoming bubble in real money is going to surprise everyone.
Well, almost everyone.
Bob and Barb Moriarty brought 321gold.com to the Internet almost 16 years ago. They later added 321energy.com to cover oil, natural gas, gasoline, coal, solar, wind and nuclear energy. Both sites feature articles, editorial opinions, pricing figures and updates on current events affecting both sectors. Previously, Moriarty was a Marine F-4B and O-1 pilot with more than 832 missions in Vietnam. He holds 14 international aviation records.
Disclosure: 1) Statements and opinions expressed are the opinions of Bob Moriarty and not of Streetwise Reports or its officers. The auther is wholly responsible for the validity of the statements. Streetwise Reports was not involved in any aspect of the article preparation. The author was not paid by Streetwise Reports LLC for this article. Streetwise Reports was not paid by the author to publish or syndicate this article. 2) This article does not constitute investment advice. Each reader is encouraged to consult with his or her individual financial professional and any action a reader takes as a result of information presented here is his or her own responsibility. By opening this page, each reader accepts and agrees to Streetwise Reports’ terms of use and full legal disclaimer. This article is not a solicitation for investment. Streetwise Reports does not render general or specific investment advice and the information on Streetwise Reports should not be considered a recommendation to buy or sell any security. Streetwise Reports does not endorse or recommend the business, products, services or securities of any company mentioned on Streetwise Reports. 3) From time to time, Streetwise Reports LLC and its directors, officers, employees or members of their families, as well as persons interviewed for articles and interviews on the site, may have a long or short position in securities mentioned. Directors, officers, employees or members of their immediate families are prohibited from making purchases and/or sales of those securities in the open market or otherwise from the time of the interview or the decision to write an article until three business days after the publication of the interview or article. The foregoing prohibition does not apply to articles that in substance only restate previously published company releases.
Shares of Global Blood Therapeutics are trading more than 14% higher after the FDA accepted its New Drug Application filing for Voxelotor, a drug used in the treatment of sickle cell disease.
Earlier today clinical-stage biopharmaceutical firm Global Blood Therapeutics Inc. (GBT:NASDAQ)announced that the U.S. Food and Drug Administration (FDA) has accepted for filing the company’s New Drug Application (NDA) seeking accelerated approval for voxelotor, an oral, once-daily therapy in development for the treatment of sickle cell disease (SCD). If approved, voxelotor would be the first therapy available to patients that targets hemoglobin polymerization, the root cause of SCD damage.
This timely announcement comes as September is designated as National Sickle Cell Awareness month. The company states that it is proud to show its support for the approximately 100,000 Americans affected by SCD. Together with the Sickle Cell Disease Association of America Inc., Global Blood Therapeutics will be hosting the 8th Annual Sickle Cell Disease Therapeutics Conference on September 10, 2019, in Washington, D.C.
In today’s release, the firm noted that the FDA has granted Priority Review for the NDA for voxelotor, which provides for a six-month review, and assigned a Prescription Drug User Fee Act (PDUFA) target action date of February 26, 2020. The agency also indicated in the NDA filing acceptance notification letter that it is not currently planning to hold an advisory committee meeting to discuss the application for voxelotor.
Ted W. Love, M.D., the company’s president and CEO, stated, “The FDA’s acceptance of our NDA for voxelotor under Priority Review is a major milestone in the development of this investigational therapy and further illustrates the significance the Agency places on getting important and innovative treatments to individuals living with SCD as quickly as possible…We look forward to working with the FDA during this process, with the goal of potentially changing the treatment paradigm for SCD.”
The company advised that Priority Review is granted to therapies that the FDA determines have the potential to provide a significant improvement in the safety or effectiveness of the treatment, diagnosis or prevention of a serious condition. Under the PDUFA, a Priority Review targets an accelerated review time of six months compared to a standard review time of 10 months.
The firm states that the NDA for voxelotor is supported by data from the multi-national Phase 3 HOPE Study of voxelotor in patients ages 12 and older with SCD who enrolled in the study from 60 institutions across 12 countries. The company indicated that the HOPE Study results were recently published in The New England Journal of Medicine, and that voxelotor has been granted FDA Breakthrough Therapy, Fast Track, Orphan Drug and Rare Pediatric Disease designations for the treatment of patients with SCD.
The company explains that Sickle Cell Disease (SCD) is a lifelong inherited blood disorder caused by a genetic mutation in the beta-chain of hemoglobin, which leads to the formation of abnormal hemoglobin known as sickle hemoglobin (HbS). Beginning in childhood, SCD patients typically suffer unpredictable and recurrent episodes or crises of severe pain due to blocked blood flow to organs, which often lead to psychosocial and physical disabilities.
Global Blood Therapeutics is based in South San Francisco, Calif., and describes its business as a clinical-stage biopharmaceutical company determined to discover, develop and deliver innovative treatments that provide hope to underserved patient communities. The firm is also developing another therapy for the potential treatment of sickle cell disease.
GBT shares opened higher today at $54.45 (+$6.96, +14.66%) over yesterday’s close of $47.49. The stock has traded today between $52.61 and $56.50/share and is currently trading at $54.42 (+$6.93, +14.59%).
Disclosure: 1) Stephen Hytha compiled this article for Streetwise Reports LLC and provides services to Streetwise Reports as an independent contractor. He or members of his household own securities of the following companies mentioned in the article: None. He or members of his household are paid by the following companies mentioned in this article: None. 2) The following companies mentioned in this article are billboard sponsors of Streetwise Reports: None. Click here for important disclosures about sponsor fees. 3) Comments and opinions expressed are those of the specific experts and not of Streetwise Reports or its officers. The information provided above is for informational purposes only and is not a recommendation to buy or sell any security. 4) The article does not constitute investment advice. Each reader is encouraged to consult with his or her individual financial professional and any action a reader takes as a result of information presented here is his or her own responsibility. By opening this page, each reader accepts and agrees to Streetwise Reports’ terms of use and full legal disclaimer. This article is not a solicitation for investment. Streetwise Reports does not render general or specific investment advice and the information on Streetwise Reports should not be considered a recommendation to buy or sell any security. Streetwise Reports does not endorse or recommend the business, products, services or securities of any company mentioned on Streetwise Reports. 5) From time to time, Streetwise Reports LLC and its directors, officers, employees or members of their families, as well as persons interviewed for articles and interviews on the site, may have a long or short position in securities mentioned. Directors, officers, employees or members of their immediate families are prohibited from making purchases and/or sales of those securities in the open market or otherwise from the time of the interview or the decision to write an article until three business days after the publication of the interview or article. The foregoing prohibition does not apply to articles that in substance only restate previously published company releases.
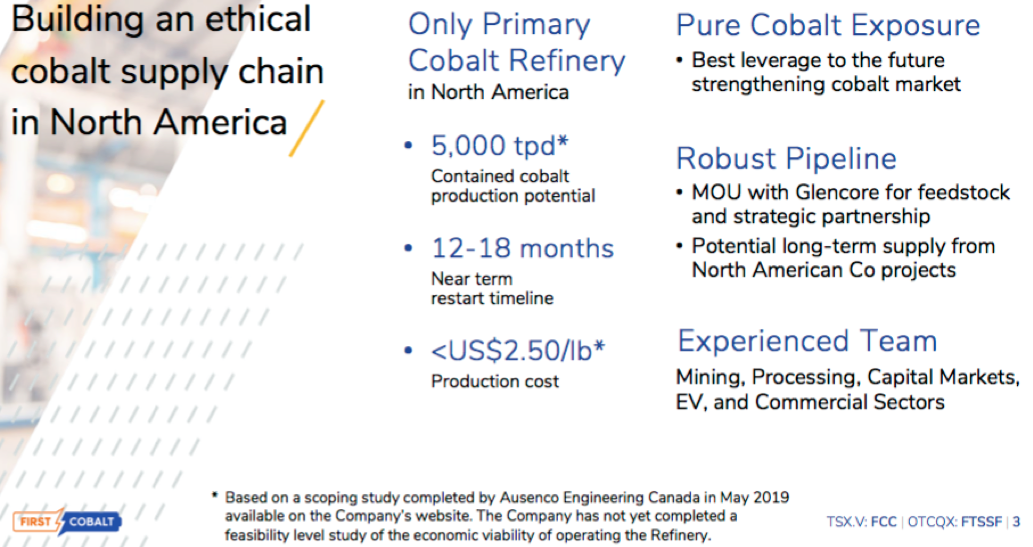
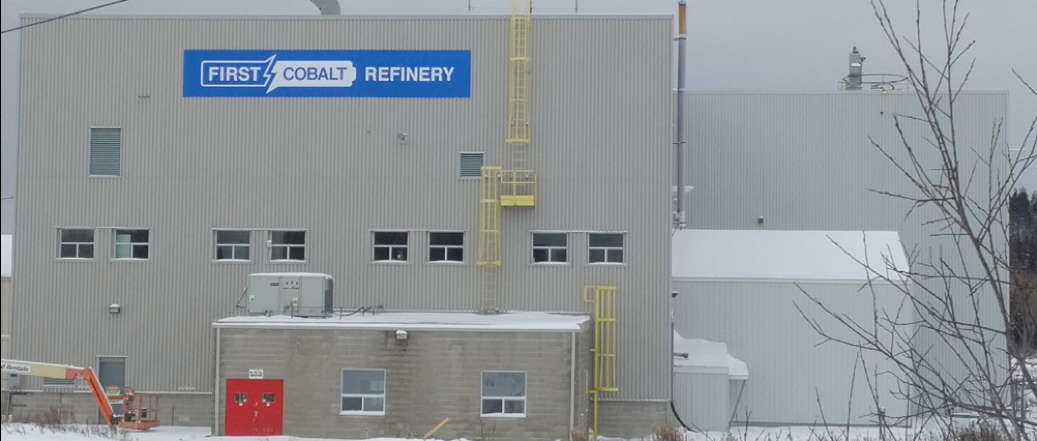
An agreement with Glencore enabling advancement of recommissioning and expansion plans for the junior’s cobalt refinery makes First Cobalt a good bet for investors, according to Peter Epstein of Epstein Research.
First Cobalt Corp. (FCC:TSX.V; FTSSF:OTCQX; FCC:ASX) announced it has entered into a US$5 million loan facility with Glencore International Plc (GLEN:LSE) to complete advanced engineering, metallurgical testing, field work and permitting associated with the recommissioning and expansion of its 100%-owned cobalt refinery in Canada. The loan facility bears interest of LIBOR + 5%, and has a two-year term, extendable by one year, at the company’s election.
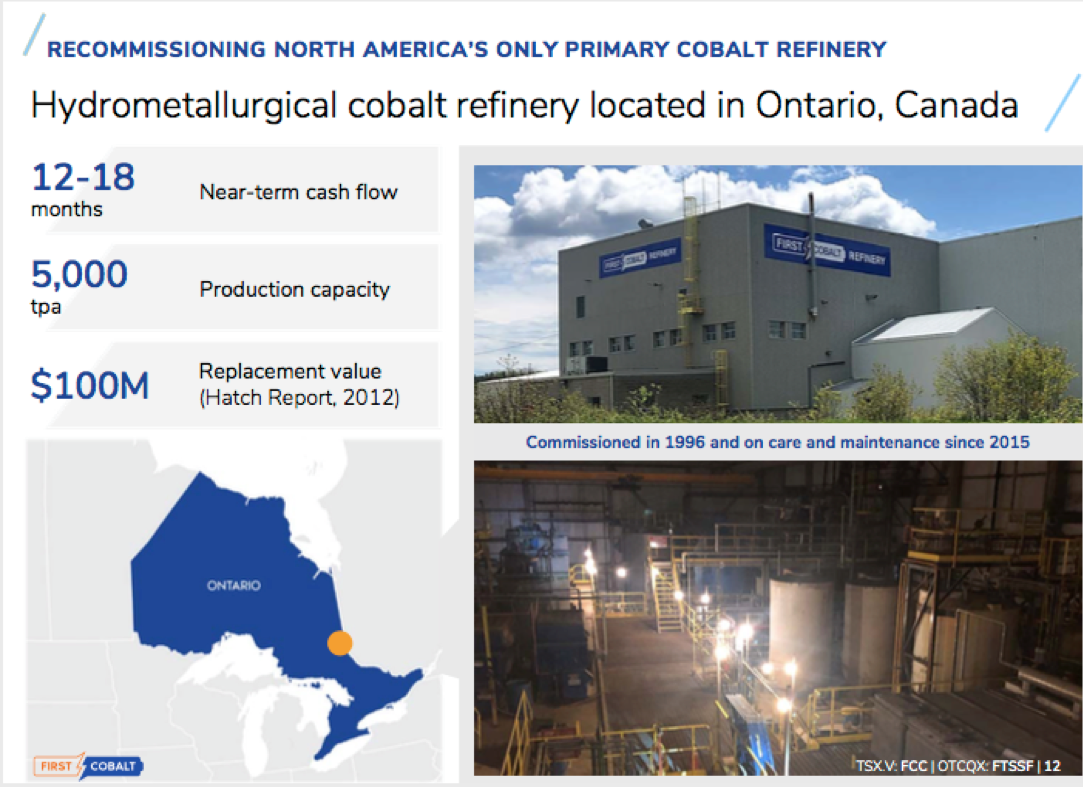
The First Cobalt refinery is a hydrometallurgical facility in the Canadian Cobalt Camp of Ontario, Canada, roughly 600 km from the U.S. border. It’s the only permitted primary cobalt (Co) refinery in North America. It can produce either a Co sulfate for lithium-ion batteries or a Co metal for the aerospace industry. This is a long-lasting, very valuable, hard asset with decades of use ahead of it.
Upon completion of a positive definitive feasibility study (DFS) for a 55 tonnes per day (tpd) facility, and subject to other terms and conditions, Glencore has agreed to advance an additional $40 million (all figures in US$ unless indicated otherwise) in three stages. However, not all of the $45 million in funding will necessarily be needed. A 30% contingency is built into that figure.
On Sept. 4 the company announced it has awarded key contracts to complete a DFS on a 55-tpd operation. Fieldwork commences this month, with expected delivery of a DFS in Q1 2020. Ausenco is leading the effort, supported by SGS for advanced metallurgical testwork, Knight Piésold Consulting for tailings studies and Story Environmental and Geomatics for environmental services and permitting.
Glencore will provide technical support through its affiliate, Expert Process Solutions. Deliverables from these esteemed groups include a NI-43-101-compliant DFS on a 55-tpd refinery restart and a prefeasibility study (PFS) on a 12-tpd interim operating scenario. [Note: A conference call will be held Sept. 9; details to follow.]
Three-phased approach to get refinery up to 55-tpd (5,020 tonnes/year Co sulfate)
In phase one, the initial loan amount will be used to assess the suitability of the refinery to treat Glencore-sourced material under a long-term supply agreement to produce Co sulfate for the North American electric vehicle (EV) market.
Also in phase one is the completion of advanced engineering and estimating, metallurgical testing, fieldwork and permittingincluding delivery of a PFS for a 12-tpd recommissioning next year, and a DFS for an expansion to 55 tpd.
Phase two entails the actual recommissioning of the refinery by late next year, under existing permits, at a feed rate of 12 tpd. This will allow the parties to prequalify products with customers in the EV supply chain.
Phase three contemplates an expansion from 12 tpd to 55 tpd in 2021, using existing buildings and infrastructure.
Ausenco scoping study shows attractive refinery economics
An Ausenco conceptual study for the First Cobalt Refinery Restart Project (available on the company’s website) estimated that using hydroxide feed grading 30% Co, at 55-tpd throughput, the refinery could produce 5,020 tonnes/year (11.067 million pounds) of cobalt sulfate.
That would be a meaningful proportion of total finished (refined) Co coming from friendly, reliable, safe countries. It’s estimated that 5,020 tonnes/year would be about 5% of global refined Co supply. The refinery would be a globally significant suppler, and even more so in North America, as soon as 2021.
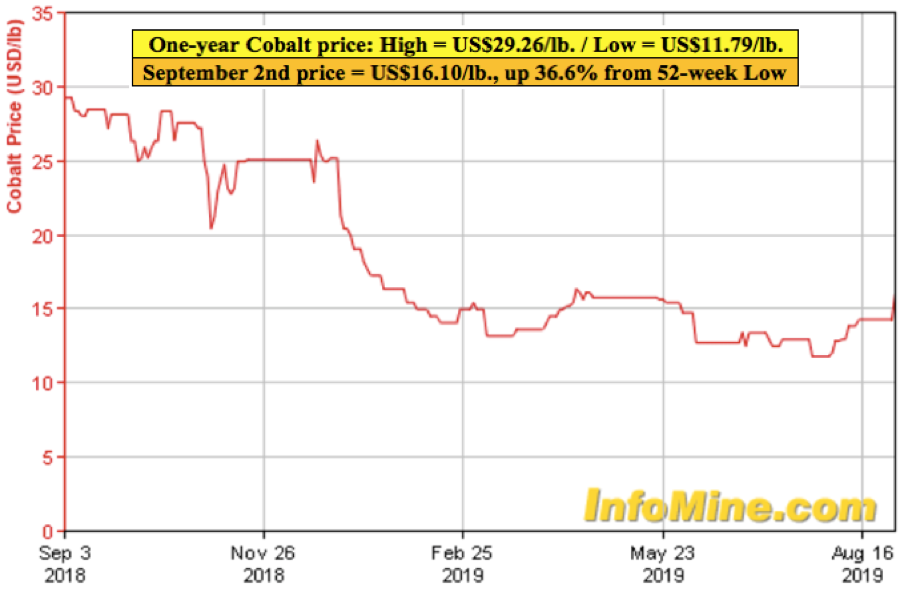
At the current (Sept. 2) InfoMine Co price of $16.10/pound ($16.10/lb), 5,020 tonnes would generate annualized gross revenue of ~$178 million. Importantly, Ausenco recently lowered its operating cost estimate contained in the scoping study by about 30% due to lower reagent costs. Therefore, annual opex at 55 tpd is now expected to be ~$25.4 million.
Cobalt prices up ~35% in past month on Glencore mine closure news
Each $1/lb change in the Co price amounts to nearly CA$15 million in annualized gross revenue at the refinery level. According to InfoMine, the Co price is up $4.30 to $16.10/lb from its 52-week low of $11.80/lb. That increase would equate to ~$47.7 million in incremental revenue. Yet, despite the Co price being up ~37%, First Cobalt’s share price is up just 12.5% from its low of CA$0.12 to CA$0.135.
As the refinery project continues to be de-risked, there could be a nice move upward in the share price. First Cobalt could be one of the best remaining pure-play bets on Co prices, and certainly one of the very best, if not the best, North American junior.
Trent Mell, First Cobalt’s president and CEO, commented, “We are delighted to be working with Glencore to bring a domestic supply of battery-grade Cobalt to the North American market. Subject to results over the next six months, first production is targeted for late 2020, followed by the commissioning of an expanded 55-tpd facility in 2021. Cobalt prices have increased considerably over the past several weeks and the outlook for the EV market remains exceptionally strong.”
Experts like Benchmark Mineral Intelligence are calling for significant increases in demand for cobalt, lithium and graphite in the early 2020s, when hundreds of new EV models hit the road.
I asked senior cobalt analyst Caspar Rawles of Benchmark for his view on the news of Glencore shutting the Mutanda mine. Mutanda is the world’s largest cobalt/copper mine, accounting for approx. 20% of cobalt supply.
“The Glencore announcement is significant, the reaction has seen prices rise by ~35% for some cobalt products. This increase might sound significant, but it has just seen prices pushed back in to the historical range in most cases. Whilst the market has reacted, there is no change to supply in the near term, as the closure doesn’t take place until year-end,” Rawles said. “This closure, assuming it happens, would pull Benchmark’s forecasted supply deficit forward by 1218 months. That, in turn, could lead to higher pricing sooner than many were expecting. However, the exact impact won’t be known until we see how other producers in the industry reacts to the shutdown.”
Low cobalt prices are the cure to low cobalt prices
In a recent article, Eurasian Resources Group’s (ERG) senior management stated that at the current cobalt price, 20% to 30% of global mine supply is at risk of disappearing next year. They say that in the longer-term, US$20+/lb is required to attract much-needed capital to the industry.
On top of the huge Glencore/Mutanda mine shutdown news, in mid-August, Reuters reported that China’s largest cobalt refiner, Zhejiang Huayou Cobalt’s overseas unit, is pulling out of a deal to invest in a cobalt mine in the Democratic Republic of Congo (DRC). In July, Mining.Com reported that production of hand-dug cobalt (artisanal mining) in the DRC is falling due to the plunge in Co prices.
Thousands of artisanal miners are said to be switching their focus to copper. In addition to much lower cobalt prices, mining cost inflation (such as sulfuric acid) and higher taxes in the DRC are kicking in to squeeze profits.
Payback of Glencore debt over six years from 2022?
There will be some sort of revenue or profit split between First Cobalt and Glencore, the terms of which are still being negotiated. In a tolling scenario I estimate debt advanced to the company could be paid off in six years, 20222027 ($7.5 million/year).
That assumes First Cobalt retains 25% of the economics until the debt is repaid. I assume a $20/lb Co price, cobalt sulfate production of 11.067 million pounds/year, $25.4 million in operating expenses, 95% recoveries and a 70% payable rate on feedstock costs.
Conclusion
What more can I say? First Cobalt is one of the only companies moving forward in a battery metals market, where investment sentiment is very weaknot just for cobalt, but for lithium, graphite and vanadium as well.
However, unlike so many battery metals peers with capex hurdles in the hundreds of millions or billion dollar+ ranges, First Cobalt is fully funded through commercial production in the fourth quarter of 2020, and maintains 100% ownership of its valuable primary cobalt refinery.
Glencore is not busy de-risking or funding a lot of other junior cobalt companies/assets, but it’s strongly backing First Cobalt Corp. on the refinery. That says a lot about the long-term value of this key strategic facility in North America.
Peter Epstein is the founder of Epstein Research. His background is in company and financial analysis. He holds an MBA degree in financial analysis from New York University’s Stern School of Business.
Disclosures: The content of this article is for information only. Readers fully understand and agree that nothing contained herein, written by Peter Epstein of Epstein Research [ER], (together, [ER]) about First Cobalt Corp., including but not limited to, commentary, opinions, views, assumptions, reported facts, calculations, etc. is to be considered implicit or explicit investment advice. Nothing contained herein is a recommendation or solicitation to buy or sell any security. [ER] is not responsible for investment actions taken by the reader. [ER] has never been, and is not currently, a registered or licensed financial advisor or broker/dealer, investment advisor, stockbroker, trader, money manager, compliance or legal officer, and does not perform market making activities. [ER] is not directly employed by any company, group, organization, party or person. The shares of First Cobalt Corp. are highly speculative, not suitable for all investors. Readers understand and agree that investments in small cap stocks can result in a 100% loss of invested funds. It is assumed and agreed upon by readers that they will consult with their own licensed or registered financial advisors before making any investment decisions.
At the time this interview was posted, Peter Epstein owned shares of First Cobalt Corp., and the company was an advertiser on [ER].
While the author believes he’s diligent in screening out companies that, for any reasons whatsoever, are unattractive investment opportunities, he cannot guarantee that his efforts will (or have been) successful. [ER] is not responsible for any perceived, or actual, errors including, but not limited to, commentary, opinions, views, assumptions, reported facts & financial calculations, or for the completeness of this article or future content. [ER] is not expected or required to subsequently follow or cover any specific events or news, or write about any particular company or topic. [ER] is not an expert in any company, industry sector or investment topic.
Streetwise Reports Disclosure: 1) Peter Epstein’s disclosures are listed above. 2) The following companies mentioned in the article are billboard sponsors of Streetwise Reports: None. Click here for important disclosures about sponsor fees. The information provided above is for informational purposes only and is not a recommendation to buy or sell any security. 3) Statements and opinions expressed are the opinions of the author and not of Streetwise Reports or its officers. The author is wholly responsible for the validity of the statements. The author was not paid by Streetwise Reports for this article. Streetwise Reports was not paid by the author to publish or syndicate this article. Streetwise Reports requires contributing authors to disclose any shareholdings in, or economic relationships with, companies that they write about. Streetwise Reports relies upon the authors to accurately provide this information and Streetwise Reports has no means of verifying its accuracy.
4) The article does not constitute investment advice. Each reader is encouraged to consult with his or her individual financial professional and any action a reader takes as a result of information presented here is his or her own responsibility. By opening this page, each reader accepts and agrees to Streetwise Reports’ terms of use and full legal disclaimer. This article is not a solicitation for investment. Streetwise Reports does not render general or specific investment advice and the information on Streetwise Reports should not be considered a recommendation to buy or sell any security. Streetwise Reports does not endorse or recommend the business, products, services or securities of any company mentioned on Streetwise Reports. 5) From time to time, Streetwise Reports LLC and its directors, officers, employees or members of their families, as well as persons interviewed for articles and interviews on the site, may have a long or short position in securities mentioned. Directors, officers, employees or members of their immediate families are prohibited from making purchases and/or sales of those securities in the open market or otherwise from the time of the interview or the decision to write an article until three business days after the publication of the interview or article. The foregoing prohibition does not apply to articles that in substance only restate previously published company releases.
Here are the latest links to our coverage of the Commitment of Traders data changes.
This week in the COT data, currency speculators added to their US Dollar Index bullish positions for a second straight week and pushed the dollar positioning back above the +30,000 net contract level.
The euro speculator bets went more bearish for a 2nd straight week and for the fifth time out of the past seven weeks.
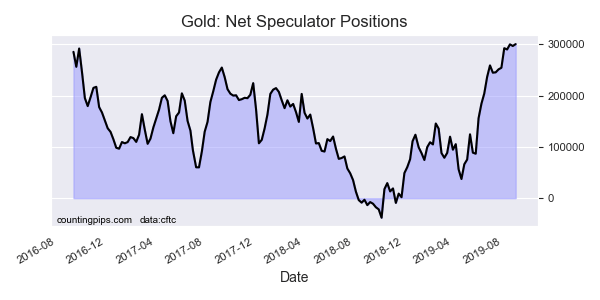
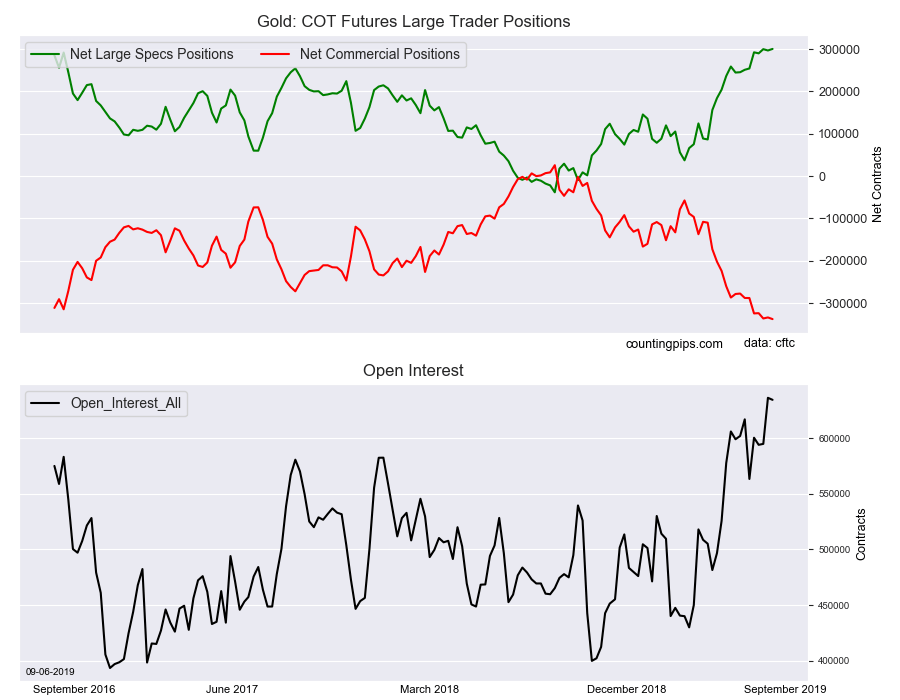
Precious metals speculators finally boosted their Gold positionsover the +300,000 net contract level this week and to the highest level in just about 3 years.
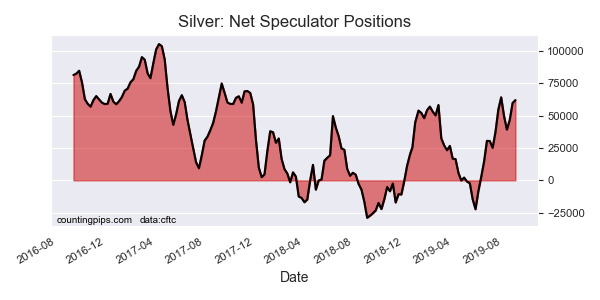
Silver speculator bets rose again this week for a third straight week and reached the most bullish level since late July.
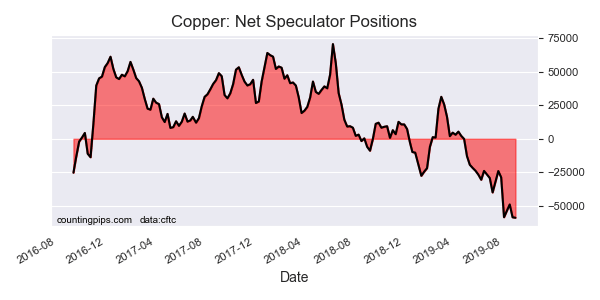
On the opposite side of the precious metal spectrum, Copper speculator positions recorded a new all-time record high bearish position for a second straight week at a total of -58,841 net contracts.
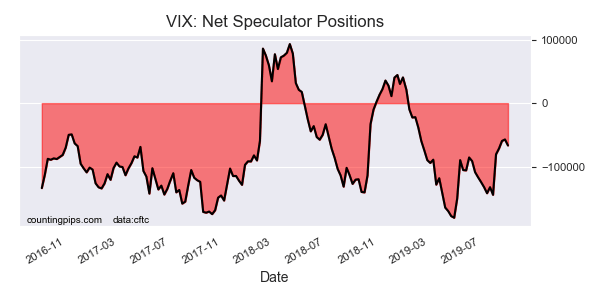
VIX speculatorsrebooted their bearish bets this week for the first time in the last five weeks. From August 6th to August 27th, VIX speculator positions had shed a total of 87,161 contracts from their bearish standing during the bit of risk off market sentiment.
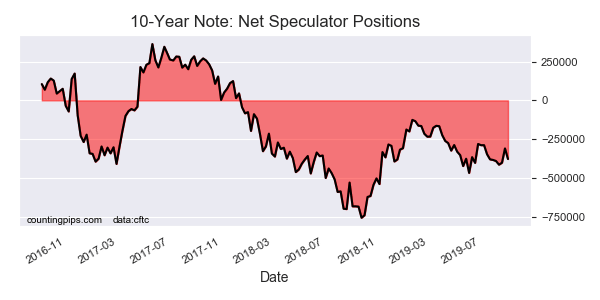
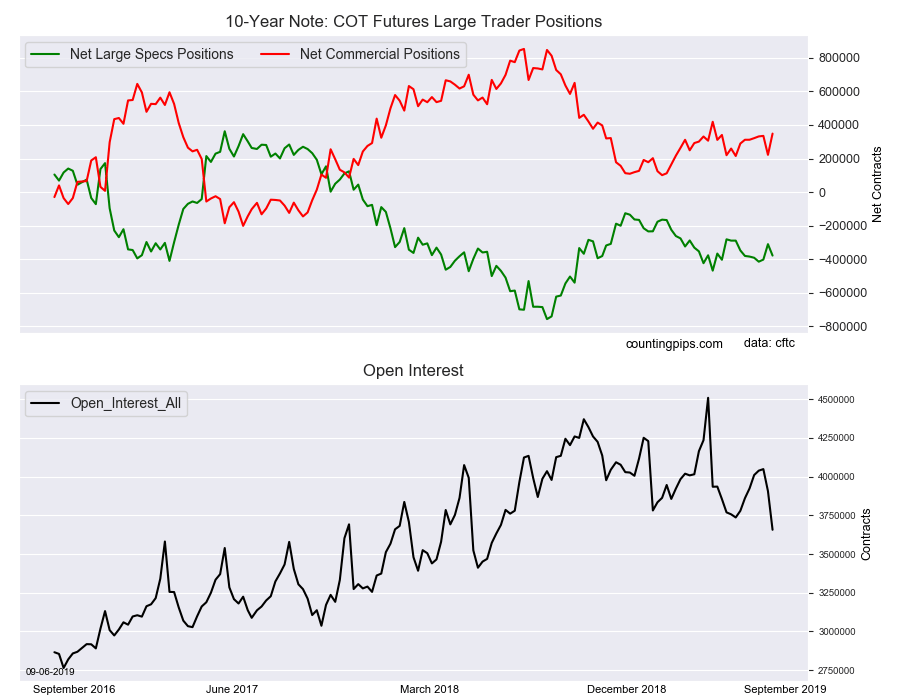
The 10-Year Bond speculators raised their bearish bets this week after shedding over 90,000 contracts from their bearish position last week. Specs continue to hold strong in their bearish sentiment despite the strong trend in the 10-year notes.
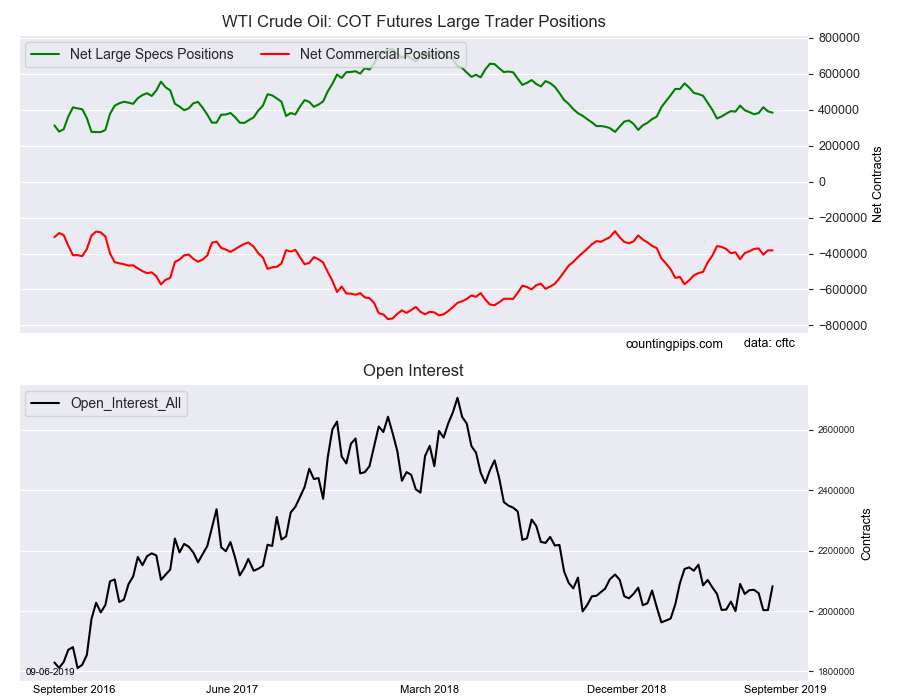
Lastly, the WTI Crude Oil speculators reduced their bullish bets for a second consecutive week. The speculative standing has remained consistently bullish but has been trending lower recently with net positions under the +400,000 contract level for the 11th time out of the past 13 weeks.
Large currency speculators boosted their net positions in the US Dollar Index futures markets this week, according to the latest Commitment of Traders (COT) data released by the Commodity Futures Trading Commission (CFTC) on Friday. See full article.
The large speculator contracts of WTI crude futures totaled a net position of 384,157 contracts, according to the latest data this week. This was a change of -7,493 contracts from the previous weekly total. See full article.
Large speculator contracts of the 10-Year Bond futures totaled a net position of -377,867 contracts, according to the latest data this week. This was a change of -67,963 contracts from the previous weekly total. See full article.
Large precious metals speculator contracts of the Gold futures totaled a net position of 300,547 contracts, according to the latest data this week. This was a change of 3,709 contracts from the previous weekly total. See full article.
Large stock market volatility speculator contracts of the VIX futures totaled a net position of -66,642 contracts, according to the latest data this week. This was a change of -9,489 contracts from the previous weekly total. See full article.
Large precious metals speculator contracts of the silver futures totaled a net position of 62,125 contracts, according to the latest data this week. This was a change of 2,273 contracts from the previous weekly total. See full article.
Metals speculator contracts of the copper futures totaled a net position of -58,841 contracts, according to the latest data this week. This was a change of -361 contracts from the previous weekly total. See full article.
*COT Report: The COT data, released weekly to the public each Friday, is updated through the most recent Tuesday (data is 3 days old) and shows a quick view of how large speculators or non-commercials (for-profit traders) were positioned in the futures markets.
The CFTC categorizes trader positions according to commercial hedgers (traders who use futures contracts for hedging as part of the business), non-commercials (large traders who speculate to realize trading profits) and nonreportable traders (usually small traders/speculators).
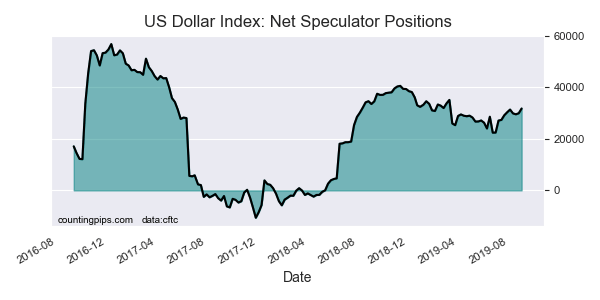
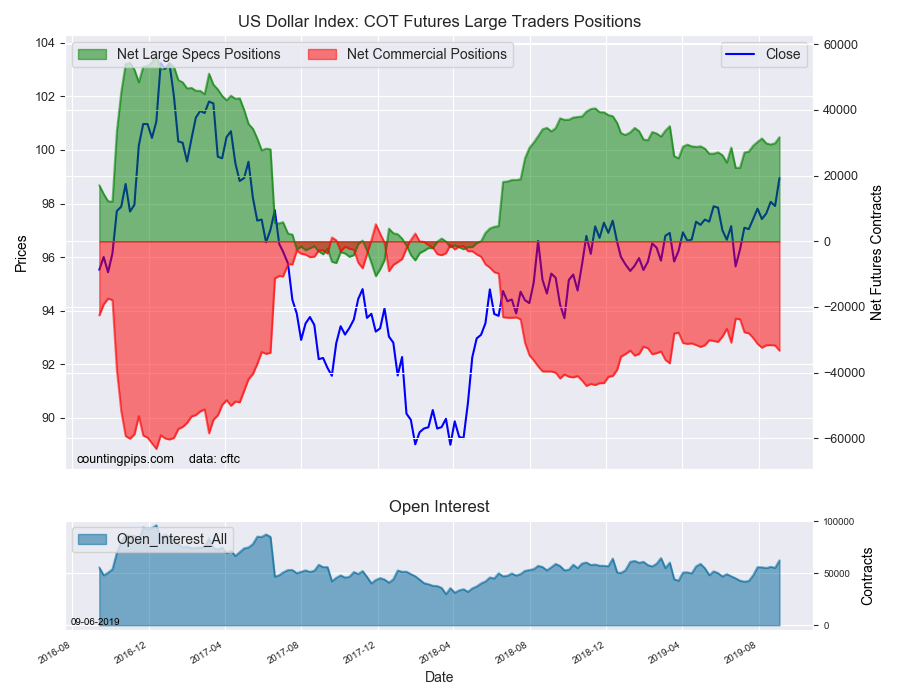
Large currency speculators increased their bullish net positions in the US Dollar Index futures markets this week, according to the latest Commitment of Traders (COT) data released by the Commodity Futures Trading Commission (CFTC) on Friday.
The non-commercial futures contracts of US Dollar Index futures, traded by large speculators and hedge funds, totaled a net position of 31,736 contracts in the data reported through Tuesday September 3rd. This was a weekly advance of 1,839 contracts from the previous week which had a total of 29,897 net contracts.
This week’s net position was the result of the gross bullish position (longs) going up by 6,308 contracts (to a weekly total of 54,410 contracts) compared to the gross bearish position (shorts) which saw a lesser gain of 4,469 contracts on the week (to a total of 22,674 contracts).
US Dollar Index speculative positions rose for a second straight week and for the eighth time out of the past ten weeks as dollar sentiment remains strong. This week’s bullishness bounced the dollar’s net bullish position back above the +30,000 net contract level for the first time since August 6th. Dollar bullish positions have now stayed above the +22,000 net position level for fifty-nine consecutive weeks.
Individual Currencies Data this week:
In the other major currency contracts data, we saw just one substantial change (+ or – 10,000 contracts) in the speculators category this week.
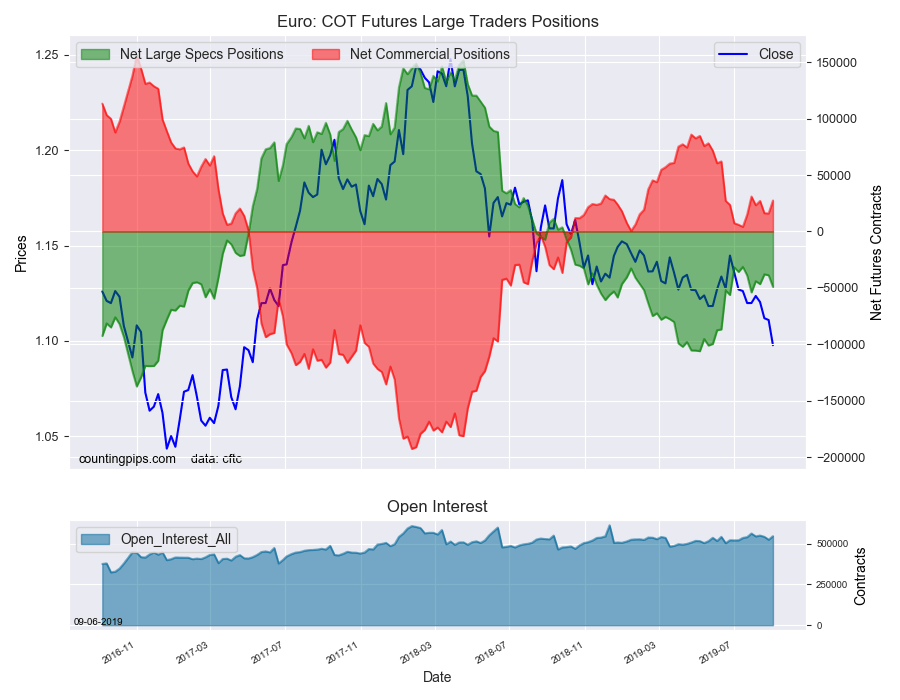
Euro speculators sharply raised their bearish bets this week by over -10,000 net contracts. This is a second straight weekly rise and the fifth time out of the past seven weeks that bearish bets have now gained. Currently, the bearish net position (-49,136 contracts) is modest compared to where the position was on May 21st (-101,102 contracts). Overall, the euro speculative standing has now remained in bearish territory for forty-nine straight weeks dating back to September 25th of 2018.
Overall, the major currencies that saw improving speculator positions this week were the US dollar index (1,839 weekly change in contracts), British pound sterling (4,069 contracts) and the Australian dollar (1,714 contracts).
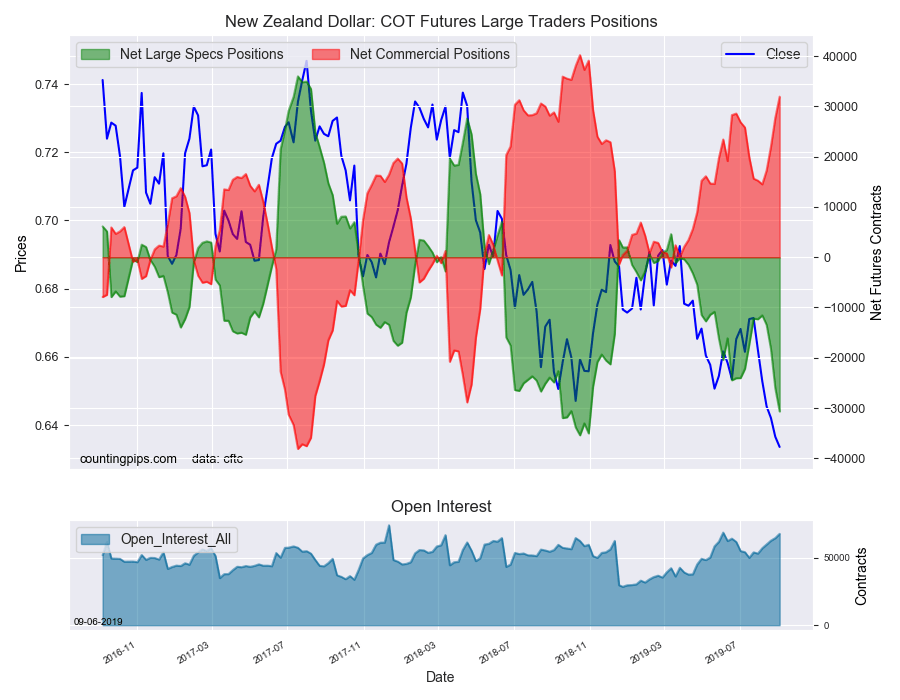
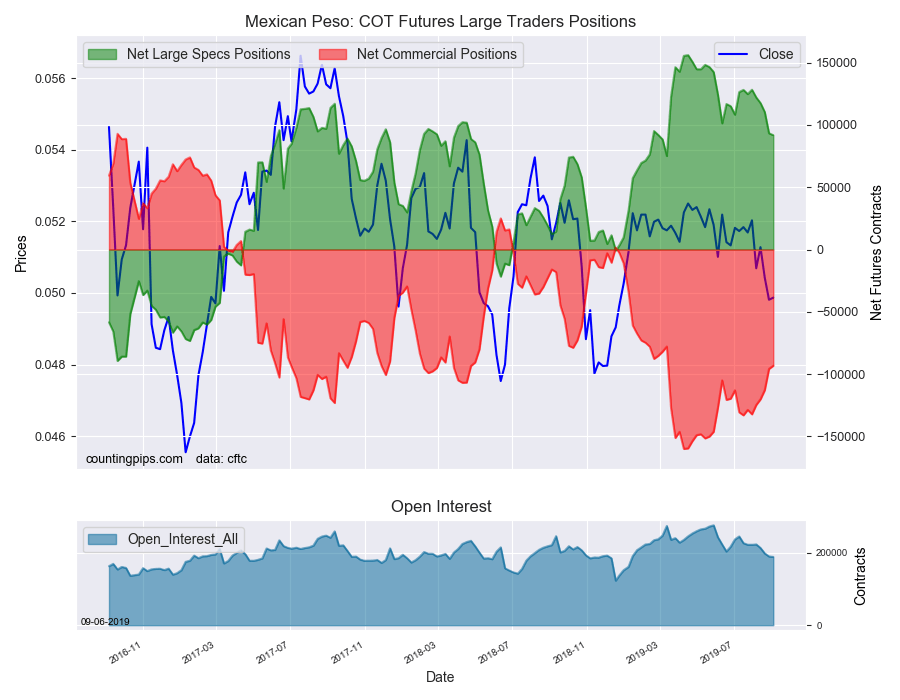
The currencies whose speculative bets declined this week were the euro (-10,332 weekly change in contracts), Japanese yen (-5,925 contracts), Swiss franc (-2,039 contracts), Canadian dollar (-5,556 contracts), New Zealand dollar (-4,629 contracts) and the Mexican peso (-1,523 contracts).
Other Notables for the week:
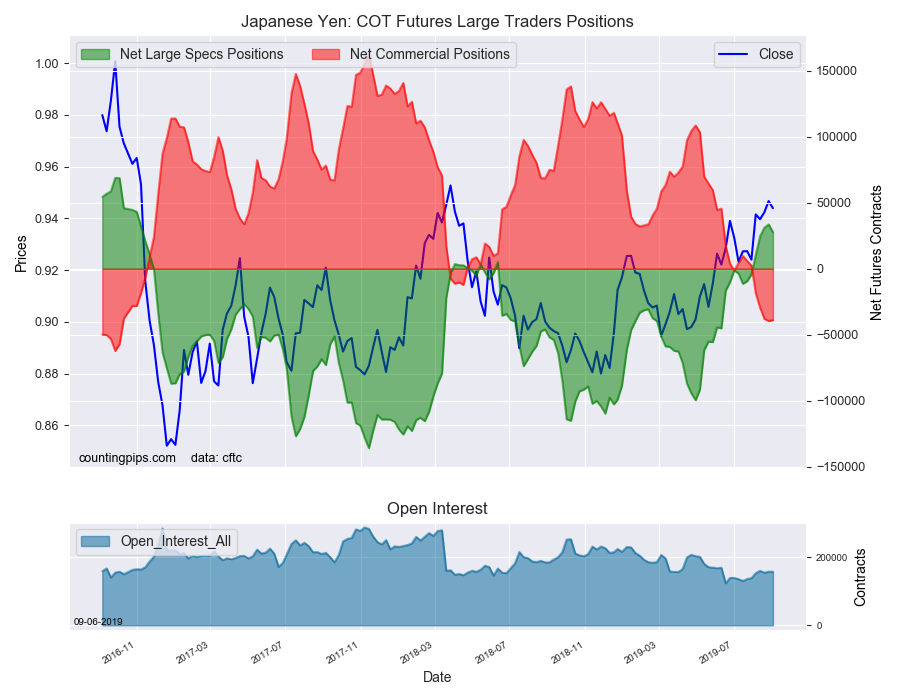
Japanese yen bullish positions dipped this week after rising for six consecutive weeks. The yen turned from net bearish to net bullish on August 6th and has now been in an overall bullish standing for five straight weeks for the first time since the October-November of 2016 time-period.
Mexican peso bullish positions fell for the fifth straight week this week and for the sixth time out of the past seven weeks. Peso positions remain in a strong bullish position at +91,791 contracts but have been sliding lower since reaching a record bullish high in mid-April at +156,030 net contracts.
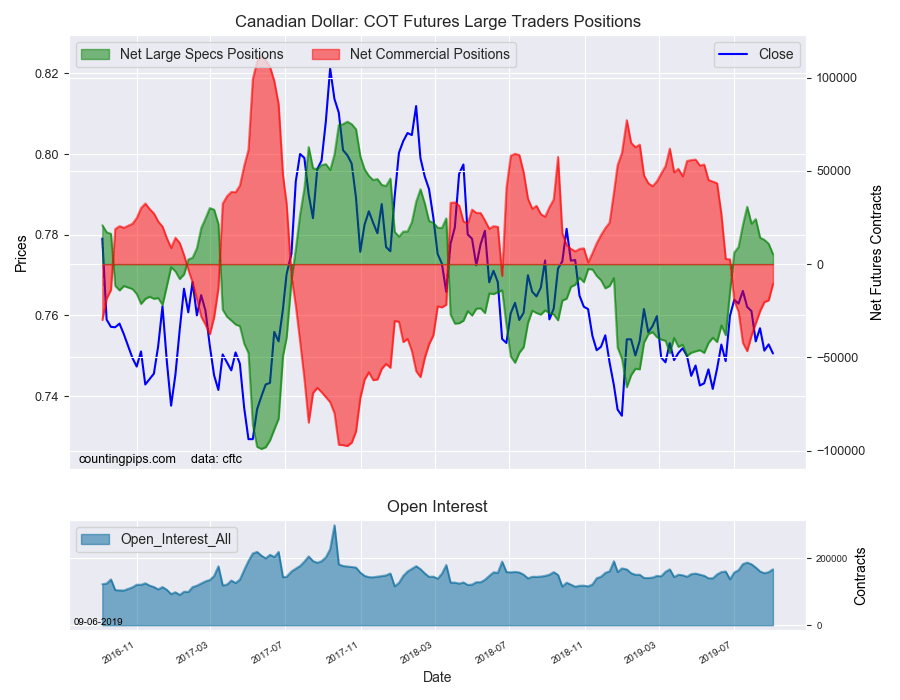
Canadian dollar bullish positions declined for a fourth straight week this week and fell to the lowest bullish position since June. Overall, CAD speculative bets have been in bullish territory for ten weeks now after turning bullish in early July but have been on the decline since reaching a high of +30,750 contracts on July 23rd.
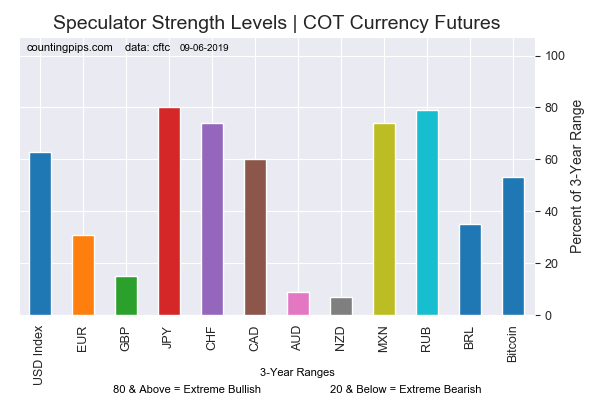
Chart: Current Strength of Each Currency compared to their 3-Year Range
See the table and individual currency charts below.
Table of Large Speculator Levels & Weekly Changes:
Currency
Net Speculator Position
Specs Weekly Change
USD Index
31,736
1,839
EuroFx
-49,136
-10,332
GBP
-84,959
4,069
JPY
27,682
-5,925
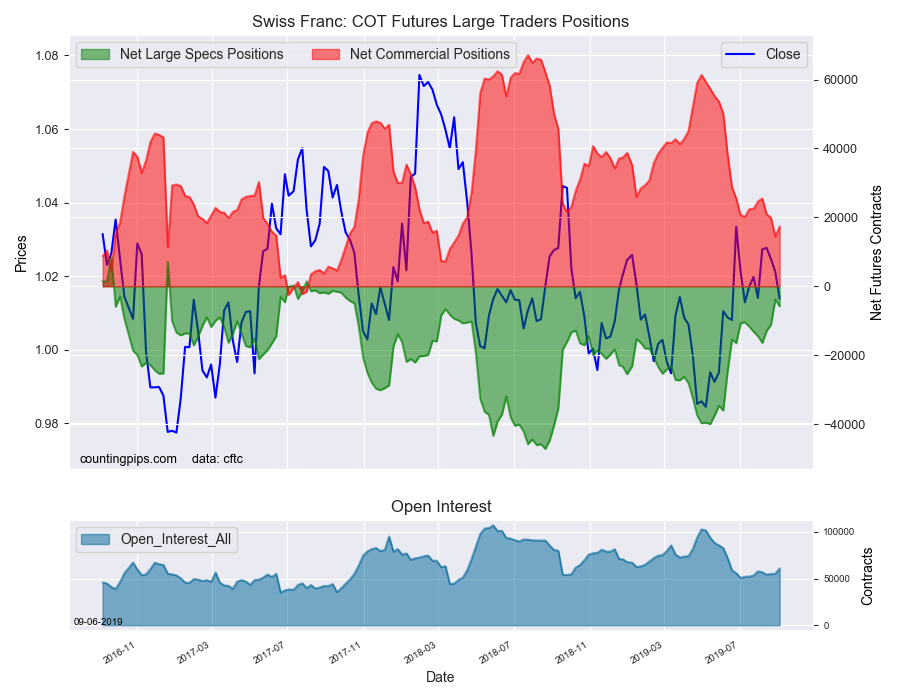
CHF
-5,839
-2,039
CAD
5,349
-5,556
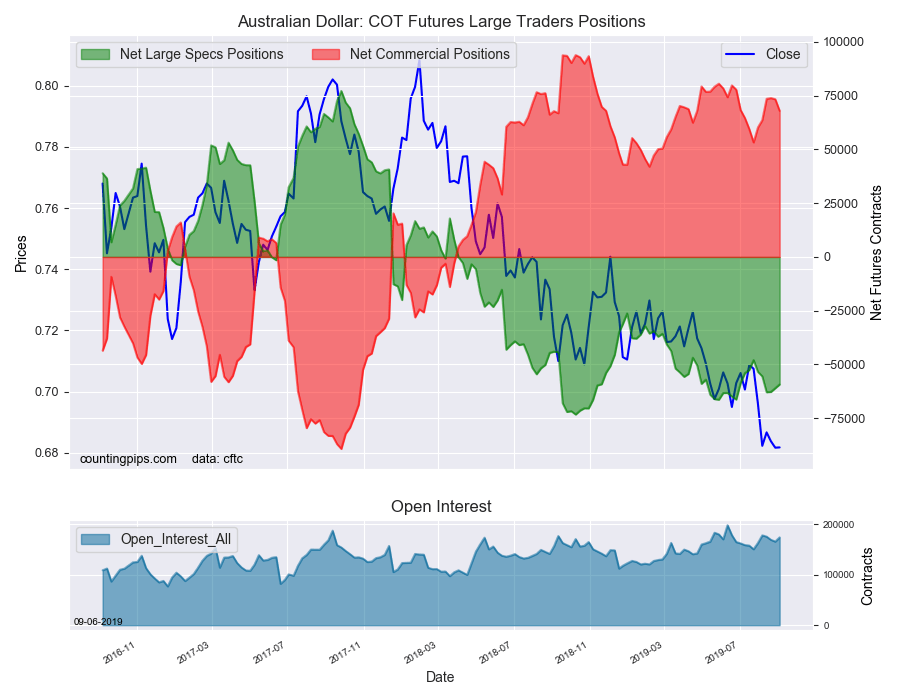
AUD
-59,318
1,714
NZD
-30,676
-4,629
MXN
91,791
-1,523
This latest COT data is through Tuesday and shows a quick view of how large speculators or non-commercials (for-profit traders) were positioned in the futures markets. All currency positions are in direct relation to the US dollar where, for example, a bet for the euro is a bet that the euro will rise versus the dollar while a bet against the euro will be a bet that the dollar will gain versus the euro.
Weekly Charts: Large Trader Weekly Positions vs Price
EuroFX:
The Euro large speculator standing this week came in at a net position of -49,136 contracts in the data reported through Tuesday. This was a weekly lowering of -10,332 contracts from the previous week which had a total of -38,804 net contracts.
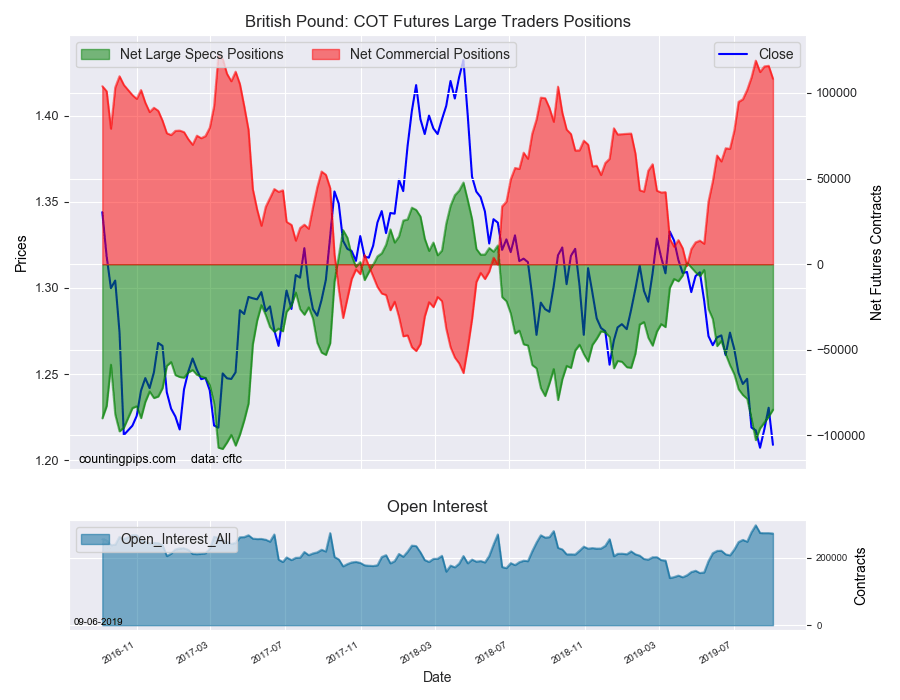
British Pound Sterling:
The large British pound sterling speculator level came in at a net position of -84,959 contracts in the data reported this week. This was a weekly increase of 4,069 contracts from the previous week which had a total of -89,028 net contracts.
Japanese Yen:
Large Japanese yen speculators totaled a net position of 27,682 contracts in this week’s data. This was a weekly lowering of -5,925 contracts from the previous week which had a total of 33,607 net contracts.
Swiss Franc:
The Swiss franc speculator standing this week resulted in a net position of -5,839 contracts in the data through Tuesday. This was a weekly decline of -2,039 contracts from the previous week which had a total of -3,800 net contracts.
Canadian Dollar:
Canadian dollar speculators reached a net position of 5,349 contracts this week. This was a fall of -5,556 contracts from the previous week which had a total of 10,905 net contracts.
Australian Dollar:
The large speculator positions in Australian dollar futures equaled a net position of -59,318 contracts this week in the data ending Tuesday. This was a weekly gain of 1,714 contracts from the previous week which had a total of -61,032 net contracts.
New Zealand Dollar:
The New Zealand dollar speculative standing recorded a net position of -30,676 contracts this week in the latest COT data. This was a weekly lowering of -4,629 contracts from the previous week which had a total of -26,047 net contracts.
Mexican Peso:
Mexican peso speculators came in at a net position of 91,791 contracts this week. This was a weekly fall of -1,523 contracts from the previous week which had a total of 93,314 net contracts.
*COT Report: The COT data, released weekly to the public each Friday, is updated through the most recent Tuesday (data is 3 days old) and shows a quick view of how large speculators or non-commercials (for-profit traders) were positioned in the futures markets.
The CFTC categorizes trader positions according to commercial hedgers (traders who use futures contracts for hedging as part of the business), non-commercials (large traders who speculate to realize trading profits) and nonreportable traders (usually small traders/speculators).
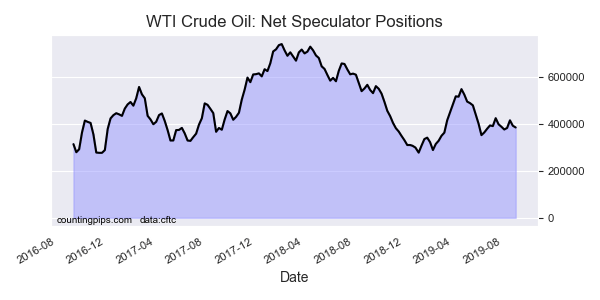
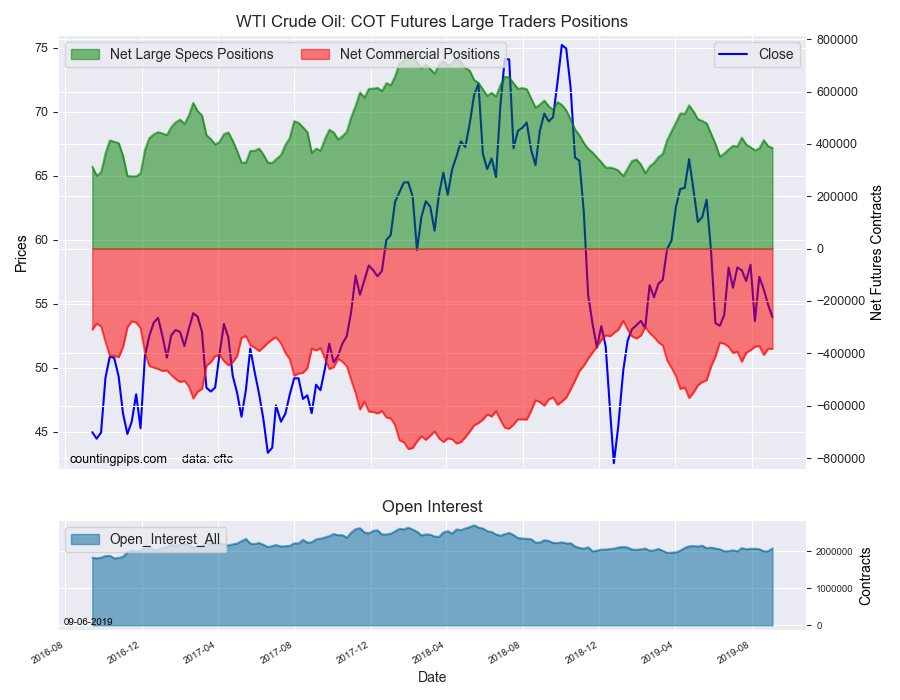
Large energy speculators cut back on their bullish net positions in the WTI Crude Oil futures markets this week, according to the latest Commitment of Traders (COT) data released by the Commodity Futures Trading Commission (CFTC) on Friday.
The non-commercial futures contracts of WTI Crude Oil futures, traded by large speculators and hedge funds, totaled a net position of 384,157 contracts in the data reported through Tuesday September 3rd. This was a weekly fall of -7,493 net contracts from the previous week which had a total of 391,650 net contracts.
The week’s net position was the result of the gross bullish position (longs) falling by -4,525 contracts (to a weekly total of 508,940 contracts) while the gross bearish position (shorts) rose by 2,968 contracts for the week (to a total of 124,783 contracts).
Speculators cut back on their bullish bets for a second straight week and by a total of -30,478 contracts over these past two weeks. Overall, the bullish position has now been under the +400,000 net contract level for a second straight week and for the eleventh time out of the past thirteen weeks.
WTI Crude Oil Commercial Positions:
The commercial traders position, hedgers or traders engaged in buying and selling for business purposes, totaled a net position of -382,119 contracts on the week. This was a weekly advance of 326 contracts from the total net of -382,445 contracts reported the previous week.
WTI Crude Oil Futures:
Over the same weekly reporting time-frame, from Tuesday to Tuesday, the WTI Crude Oil Futures (Front Month) closed at approximately $53.94 which was a decrease of $-0.99 from the previous close of $54.93, according to unofficial market data.
*COT Report: The COT data, released weekly to the public each Friday, is updated through the most recent Tuesday (data is 3 days old) and shows a quick view of how large speculators or non-commercials (for-profit traders) as well as the commercial traders (hedgers & traders for business purposes) were positioned in the futures markets.
The CFTC categorizes trader positions according to commercial hedgers (traders who use futures contracts for hedging as part of the business), non-commercials (large traders who speculate to realize trading profits) and nonreportable traders (usually small traders/speculators).
Large bond speculators raised their bearish net positions in the 10-Year Note futures markets this week following a sharp reduction last week, according to the latest Commitment of Traders (COT) data released by the Commodity Futures Trading Commission (CFTC) on Friday.
The non-commercial futures contracts of 10-Year Note futures, traded by large speculators and hedge funds, totaled a net position of -377,867 contracts in the data reported through Tuesday September 3rd. This was a weekly change of -67,963 net contracts from the previous week which had a total of -309,904 net contracts.
The week’s net position was the result of the gross bullish position (longs) tumbling by -16,137 contracts (to a weekly total of 587,813 contracts) while the gross bearish position (shorts) rose by 51,826 contracts for the week (to a total of 965,680 contracts).
The 10-year speculators boosted their bearish bets this week by the largest one-week amount (-67,963 contracts) since early June. Last week, speculators had reduced their bearish position by over 90,000 net contracts before this week’s turnaround.
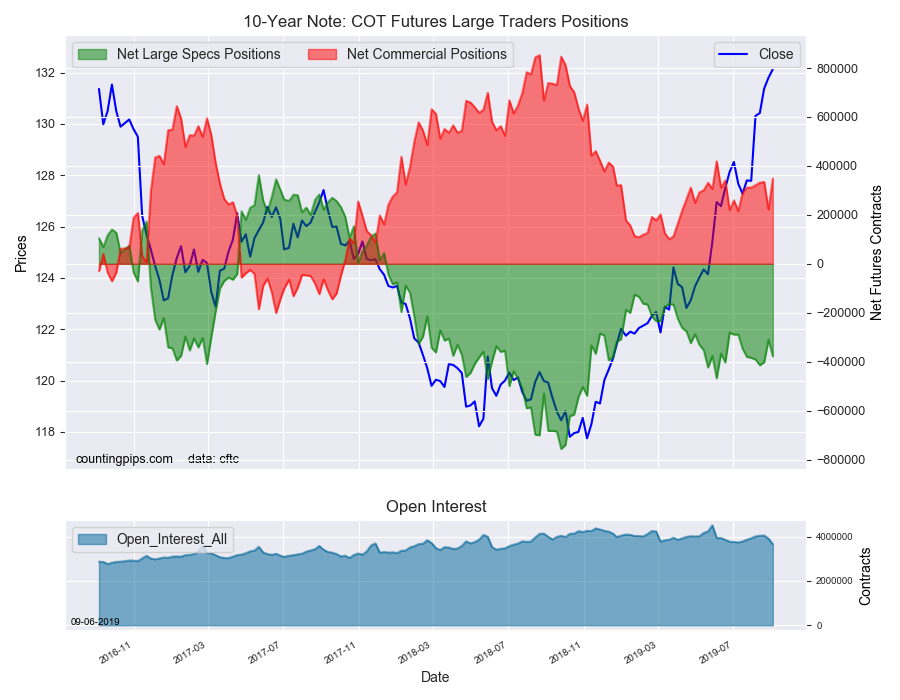
Overall, the speculators continue to hold their bearish sentiment in the face of strong demand and rising prices in the 10-year note that now sports a yield of 1.56 percent (prices up, yields down).
10-Year Note Commercial Positions:
The commercial traders position, hedgers or traders engaged in buying and selling for business purposes, totaled a net position of 348,610 contracts on the week. This was a weekly increase of 126,672 contracts from the total net of 221,938 contracts reported the previous week.
10-Year Note Futures:
Over the same weekly reporting time-frame, from Tuesday to Tuesday, the 10-Year Note Futures (Front Month) closed at approximately $132.12 which was an advance of $0.32 from the previous close of $131.79, according to unofficial market data.
*COT Report: The COT data, released weekly to the public each Friday, is updated through the most recent Tuesday (data is 3 days old) and shows a quick view of how large speculators or non-commercials (for-profit traders) as well as the commercial traders (hedgers & traders for business purposes) were positioned in the futures markets.
The CFTC categorizes trader positions according to commercial hedgers (traders who use futures contracts for hedging as part of the business), non-commercials (large traders who speculate to realize trading profits) and nonreportable traders (usually small traders/speculators).
Large precious metals speculators increased their bullish net positions in the Gold futures markets this week, according to the latest Commitment of Traders (COT) data released by the Commodity Futures Trading Commission (CFTC) on Friday.
The non-commercial futures contracts of Gold futures, traded by large speculators and hedge funds, totaled a net position of 300,547 contracts in the data reported through Tuesday September 3rd. This was a weekly rise of 3,709 net contracts from the previous week which had a total of 296,838 net contracts.
The week’s net position was the result of the gross bullish position (longs) growing by 2,776 contracts (to a weekly total of 365,385 contracts) while the gross bearish position (shorts) slid by -933 contracts for the week (to a total of 64,838 contracts).
Gold speculators continue to show their positive sentiment and pushed the net bullish position above the +300,000 net contract level for the first time since September 6th of 2016, almost exactly three years ago.
Gold speculative bullish positions have now gained for eleven weeks out of the past fourteen (from June 4th to present) which has added a total of +213,859 contracts to the overall bullish standing.
Gold Commercial Positions:
The commercial traders position, hedgers or traders engaged in buying and selling for business purposes, totaled a net position of -337,741 contracts on the week. This was a weekly fall of -3,935 contracts from the total net of -333,806 contracts reported the previous week.
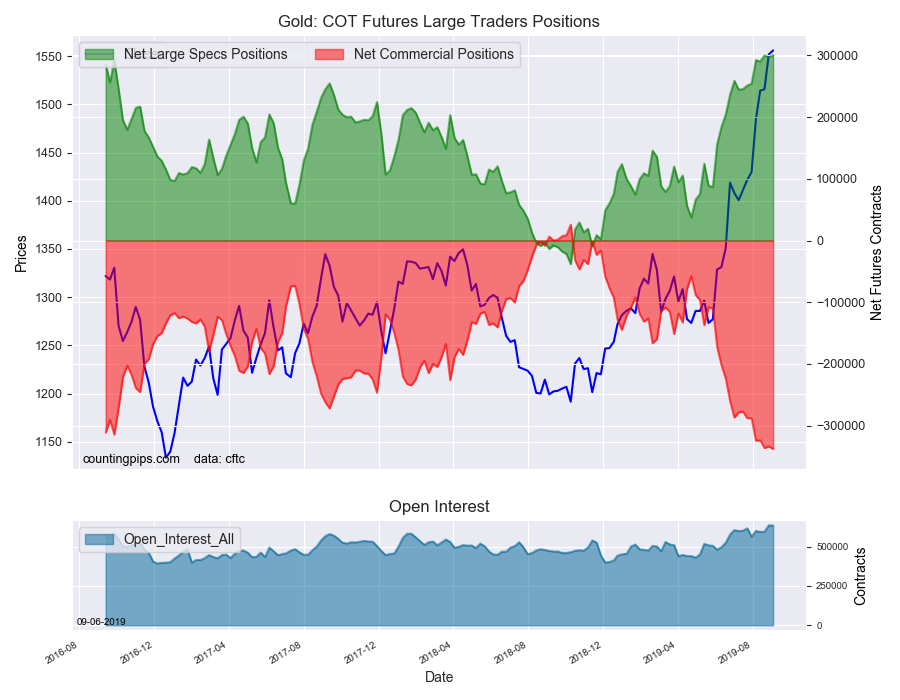
Gold Futures:
Over the same weekly reporting time-frame, from Tuesday to Tuesday, the Gold Futures (Front Month) closed at approximately $1555.90 which was a gain of $4.10 from the previous close of $1551.80, according to unofficial market data.
*COT Report: The COT data, released weekly to the public each Friday, is updated through the most recent Tuesday (data is 3 days old) and shows a quick view of how large speculators or non-commercials (for-profit traders) as well as the commercial traders (hedgers & traders for business purposes) were positioned in the futures markets.
The CFTC categorizes trader positions according to commercial hedgers (traders who use futures contracts for hedging as part of the business), non-commercials (large traders who speculate to realize trading profits) and nonreportable traders (usually small traders/speculators).
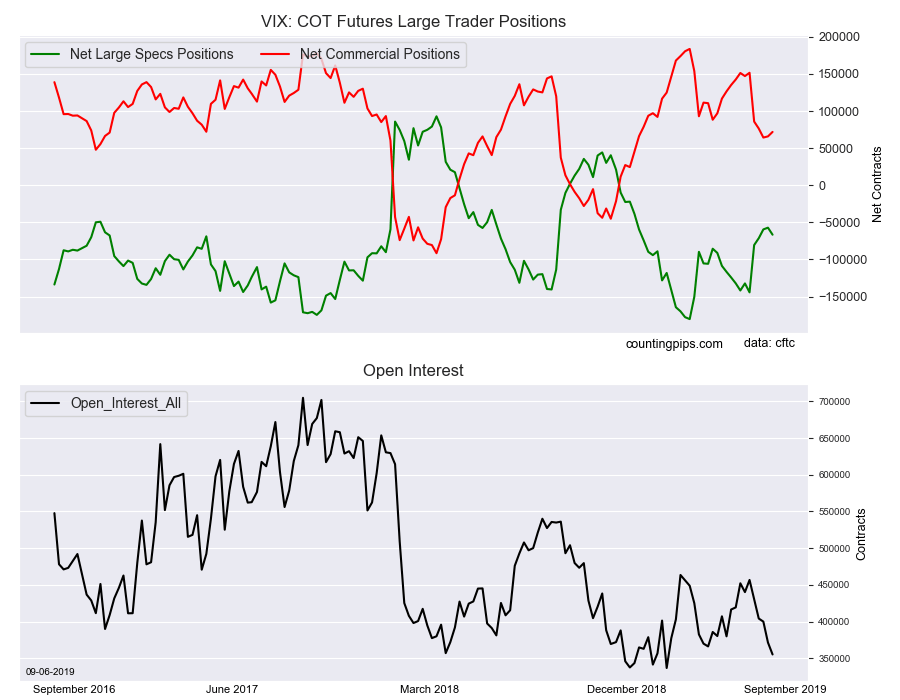
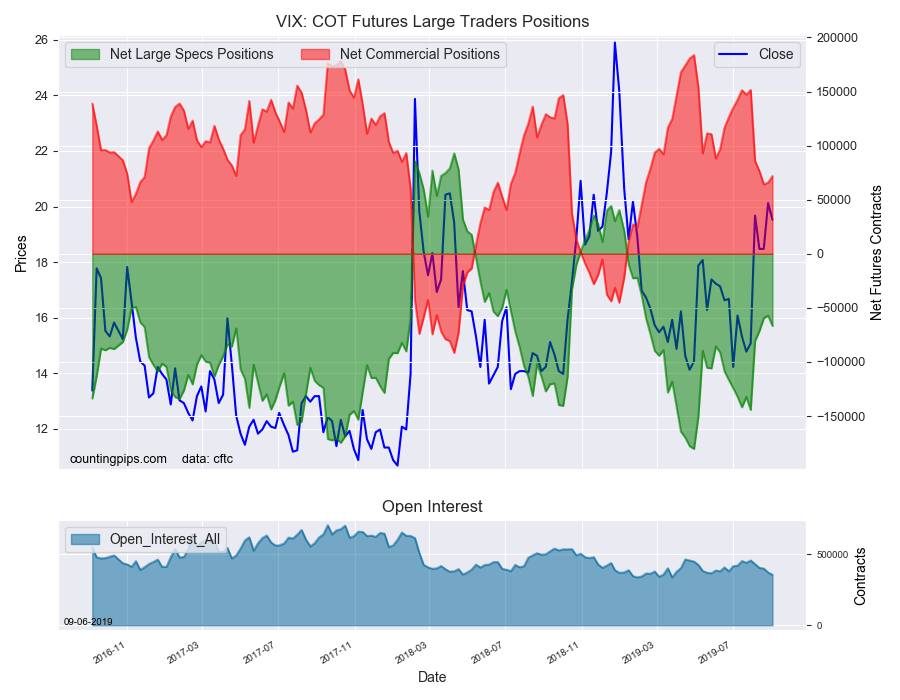
Large volatility speculators boosted their bearish net positions in the VIX futures markets this week, according to the latest Commitment of Traders (COT) data released by the Commodity Futures Trading Commission (CFTC) on Friday.
The non-commercial futures contracts of VIX futures, traded by large speculators and hedge funds, totaled a net position of -66,642 contracts in the data reported through Tuesday September 3rd. This was a weekly change of -9,489 net contracts from the previous week which had a total of -57,153 net contracts.
The week’s net position was the result of the gross bullish position (longs) sinking by -3,286 contracts (to a weekly total of 113,045 contracts) while the gross bearish position (shorts) rose by 6,203 contracts for the week (to a total of 179,687 contracts).
Speculators raised their VIX bearish bets this week for the first time in the last five weeks.
Previously, and in combination with some risk off sentiment in the markets, speculators had cut back on their bearish bets from August 6th to August 27th by a total of 87,161 contracts. That multi-week reduction took the overall net position from a very bearish level of -144,314 contracts to a more modest level of -57,153 contracts.
This week marks the fifth straight week the net position level is under -100,000 contracts after having been above that level in seventeen out of the previous twenty weeks.
VIX Commercial Positions:
The commercial traders position, hedgers or traders engaged in buying and selling for business purposes, totaled a net position of 71,874 contracts on the week. This was a weekly increase of 6,026 contracts from the total net of 65,848 contracts reported the previous week.
VIX Futures:
Over the same weekly reporting time-frame, from Tuesday to Tuesday, the VIX Futures (Front Month) closed at approximately $19.52 which was a fall of $-0.60 from the previous close of $20.12, according to unofficial market data.
*COT Report: The COT data, released weekly to the public each Friday, is updated through the most recent Tuesday (data is 3 days old) and shows a quick view of how large speculators or non-commercials (for-profit traders) as well as the commercial traders (hedgers & traders for business purposes) were positioned in the futures markets.
The CFTC categorizes trader positions according to commercial hedgers (traders who use futures contracts for hedging as part of the business), non-commercials (large traders who speculate to realize trading profits) and nonreportable traders (usually small traders/speculators).