The US President has bid goodbye to another national security adviser.
This comes after an array of internal disputes over Russia, Iran, North Korea, and several other foreign policy issues.
President Trump took to Twitter, announcing:
John Bolton, on the other hand, claims he offered his resignation to Trump on Monday night first. The former adviser tweeted:
Bolton Was Splitting White House
The 70-year old now-former national security adviser to the White House was hawkish on many issues.
That being said, he did seem to manage to keep a tight rein on Pyongyang’s plutonium production during his tenure under President Bush.
In the Trump era, however, there was a breakdown of attempts to schedule peace talks with Afghanistan last weekend. This came as a result of internal foreign policy disagreements, indicating the President’s hard-line stance against his advisers.
After Monday, when North Korea’s Kim Jong provoked the US once again by testing two more missiles, the Trump-Bolton era came to an end.
Bolton and Trump disagreed on many US foreign policy measures. These included how to deal with provocations from North Korea and Iran. And, most recently, they disagreed on negotiations for a peace accord with the Taliban. Sources say that Bolton, who was notoriously pro-war, was even excluded from meetings related to Afghanistan.
Bolton seems to have played an important role in the worsening of tensions between the US and, North Korea, Venezuela, Iran, and Russia. The two men argued for a long time, with Trump expressing his dissatisfaction over Bolton’s hawkish stance and policy splitting for months.
This is now the third national security adviser Trump has fired. The position is vacant, for now. But, Charles Kupperman, Bolton’s deputy, will serve for a week or so until the President picks his new “ally”.
How Will A Dovish Replacement Help Trump?
The internal division is widening. And Trump is somewhat forcing a more dovish stance when it comes to foreign policy.
Therefore, the markets will start looking at the run-up to the 2020 election with a different lens.
North Korea’s first vice foreign minister Choe Son Hui has stated that her country is prepared to resume talks. And that could be Trump’s chance to offer an alternative, softer path to denuclearisation now that Bolton is out of the way.
WTI Oil Takes a Breather but Looks Bullish Medium-Term
Risk assets have been on a good run lately. This is especially true given the latest geopolitical deescalations. With that said, the shift in commodity-based currencies and oil itself has allowed market participants to gain.
The firing of Bolton, however, has halted the oil rally for now. His dismissal seems to be a sort of healing potion to further geopolitical tensions.
Despite the recent cap, WTI oil still looks bullish in the medium term. The break outside the descending triangle could offer more long opportunities, with short-term ones depending on the EIA report later today.
The US dollar recovered from Monday’s decline, but price action was largely confined to the previous session’s range. Reports that China was willing to buy US agricultural products sent equity markets briefly higher, reflecting the risk sentiment.
However, overall, USD remains rather muted ahead of the ECB meeting. Economic data also picks up with the producer prices and CPI reports coming up later in the week.
Euro Holds Firm as Markets Speculate Easing
The euro held steady on Tuesday. This comes as investors speculate whether the central bank will announce its QE program at the monetary policy meeting this Thursday. Speculation is rife that the central bank could seek more time before committing to a relaunch of QE.
EURUSD Forms a Minor Double Top
The EURUSD establishes resistance near 1.1059, forming a minor double top pattern on the four-hour time frame. A breakout above this level will see the euro rising to 1.1085 as the minimum target. Further gains could push the common currency closer to the main resistance area of 1.1140. To the downside, the support at 1.1016 will remain key. A close below this support could trigger further declines.
Sterling Steady as Boris Affirms EU Pullout on October 31st
The pound held near recent highs, even as PM Boris Johnson once again reiterated his commitment to pull out of the EU on October 31st. This comes even as lawmakers passed a last-minute law preventing a no-deal Brexit. The UK parliament is suspended for four weeks with investors waiting for further developments on Brexit.
GBPUSD Likely to Consolidate Near Support
The currency pair retreated from recent highs on a modest pullback. However, price is yet to test the support level at 1.2320. As a result, the GBPUSD downside is limited. But a break down below this support could trigger a sharper correction in the GBPUSD currency pair. To the upside, the resistance area of 1.2533 – 1.2511 remains within reach.
Gold Extends to a 4-day Decline
The precious metal continued to fall, extending declines to four consecutive sessions. The precious metal is losing ground amid investor sentiment improving. Furthermore, the strong gains logged by gold previously are also due for a correction. A lack of key fundamentals over the past few days has kept price action subdued. However, with US economic data on tap later in the week as well as the ECB meeting, we expect to see some volatility in the precious metal.
XAUUSD consolidates near lower support
The precious metal is consolidating near the lower support area of 1485. Price action remains somewhat muted near this level. With gold breaking past the initial support at 1508, we expect the sideways range to continue into Thursday’s ECB announcement on monetary policy.
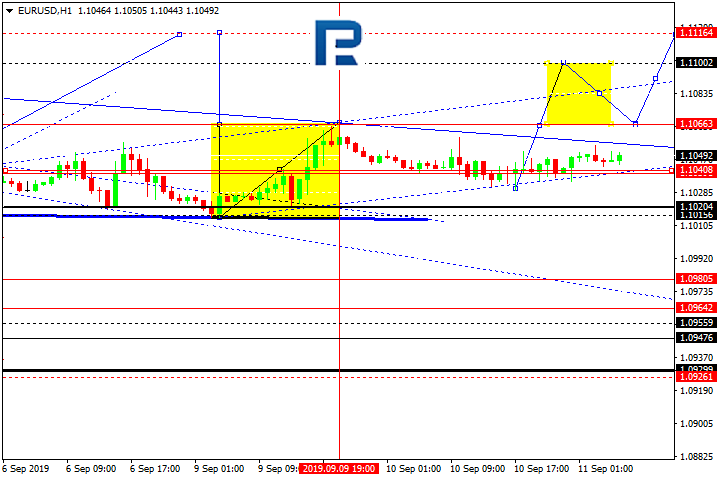
EURUSD is still consolidating around 1.1039. Today, the pair may choose an alternative scenario to form one more ascending structure to break 1.1066 and then continue growing to reach 1.1116. According to the main scenario, the price may start plunging at any moment to reach 1.0950.
GBPUSD, “Great Britain Pound vs US Dollar”
GBPUSD is consolidating around 1.2343. Possibly, today the pair may choose an alternative scenario to start another growth to break 1.2383 and then continue trading upwards to reach 1.2454. According to the main scenario, the price may start plummeting at any moment towards 1.2111.
USDCHF, “US Dollar vs Swiss Franc”
USDCHF is still consolidating around 0.9919. Today, the pair may grow to break 0.9939 and then continue trading upwards with the first target at 0.9950.
USDJPY, “US Dollar vs Japanese Yen”
USDJPY is moving upwards. Possibly, today the pair may reach 107.83 and then form a new descending structure with the target at 107.47.
AUDUSD, “Australian Dollar vs US Dollar”
AUDUSD is consolidating around 0.6858. Today, the pair may form one more ascending structure to break 0.6870 and then continue trading upwards the target at 0.6892.
USDRUB, “US Dollar vs Russian Ruble”
USDRUB is consolidating around 65.42. Possibly, today the pair may reach 65.17 and then resume trading upwards with the first target at 65.65. If later the price breaks this range to the upside, the instrument may form one more ascending structure towards 66.16.
USDCAD, “US Dollar vs Canadian Dollar”
USDCAD is moving downwards. Today, the pair may form a new descending structure to reach 1.3126 and then start another growth to break 1.3186. After that, the instrument may continue trading upwards with the target at 1.3300.
XAUUSD, “Gold vs US Dollar”
Gold has reached the first downside target at 1484.88. Possibly, the pair may form one more ascending structure towards 1506.30 and then start a new correction to reach 1495.50. Later, the market may resume trading upwards with the target at 1526.50.
BRENT
Brent has formed the consolidation range around 62.62. Possibly, today the pair may start another growth with the predicted target at 65.10. Later, the market may correct to return to 62.62 and then resume trading inside the uptrend towards 67.65.
BTCUSD, “Bitcoin vs US Dollar”
BTCUSD is moving downwards. Today, the pair may fall to reach 9866.00 and then form one more ascending structure to return to 10180.00. After that, the instrument may continue trading inside the downtrend with the predicted target at 9500.00.
Attention! Forecasts presented in this section only reflect the author’s private opinion and should not be considered as guidance for trading. RoboForex LP bears no responsibility for trading results based on trading recommendations described in these analytical reviews.
Most of the FX majors remain somewhat soft on the third trading day this week apart from FX safe-havens and the euro. With risk flows halting in the first half of the trading session, market participants seem rather restrained on asset options.
Euro Weakens Ahead of ECB
Market participants anticipate the ECB to dive into lower negative rates on Thursday, eurodollar flows indicate. After all, Draghi convinced the markets that the central bank will do “whatever it takes” to preserve the European currency.
Euro is falling away from 1.1050 and towards the 1.1025 level against the greenback. Data showed that Spanish Industrial Production deteriorated from 2.5% expected to 0.8%.
FX Safe-Havens Down on Easing Expectations
The Japanese yen continues being under pressure as investors turn their back on the safe-haven asset on expectations that BoJ will be easing policy on their meeting next week. USDJPY had an array of positive sessions this week with investors now eying the 108 level.
The Swiss franc, on the other hand, trades very similar to its homogenous consociate yen. USDCHF crossed above the 0.99 mark yesterday and continues moving higher this morning, supported by somewhat stronger trade optimism.
Pound Takes Break Above 1.2350
With the latest political and economic developments in the UK, GBPUSD remains at elevated levels above 1.2350 this morning. UK wages and a better than expected unemployment rate have partially offset the multimonth decline. The other half was yet another failure on British PM to call on a snap election. That was what triggered positive flows on cable at the beginning of this week.
Risk Assets Also Mixed
Aussie, Kiwi and the SPX look bullish in the short-term, however, any gains have now halted on lack of news and economic flows. Crude oil’s gains, however, were capped by Trump’s decision to fire John Bolton, his national security advisor.
AUDUSD received rejection after missing the 69 cents barrier again, NZDUSD stably trades above 64 cents and the S&P500 seems undeterred by policy easing headlines.
Gold and Dollar Move Hand to Hand
Surprisingly enough, today’s session has both gold and the US dollar moving higher consequently. It is probably an ECB related drop on euro allowing the dollar to move higher. This suggests that XAUUSD long is the only option for bulls looking for an alternative trading asset.
Gold nears the 1500 level once again, as bears never really triggered sizeable shorts, and the dollar index (DXY) heads towards 98.65 after a rejection at 95.25.
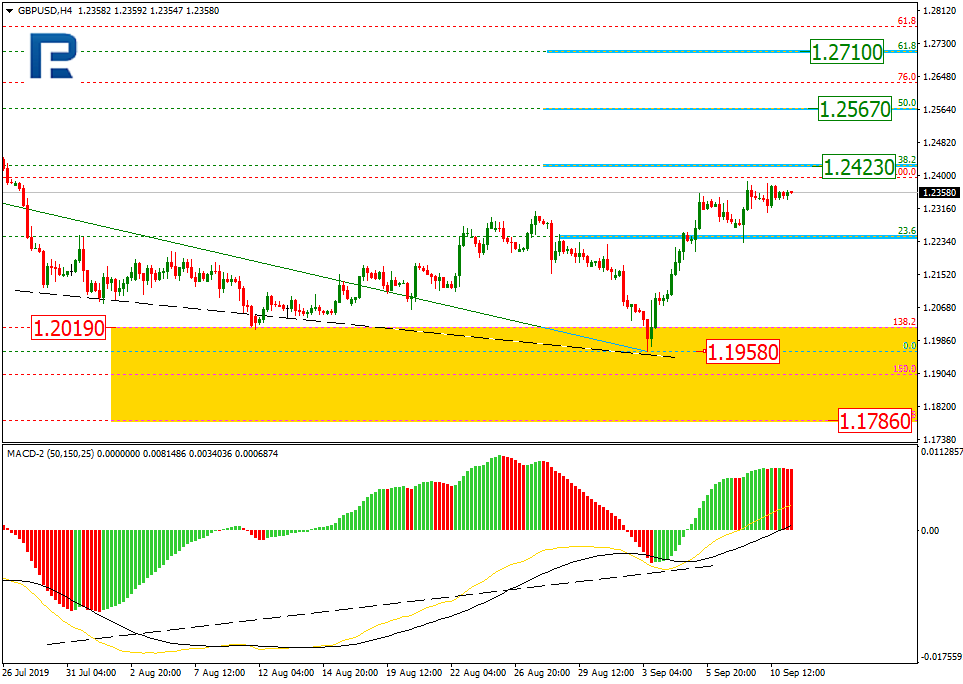
As we can see in the H4 chart, after testing the post-correctional extension area between 138.2% and 161.8% fibo at 1.2019 and 1.1786 respectively, GBPUSD is trading upwards and has already reached 38.2% fibo at 1.2423. The next upside targets may be 50.0% and 61.8% fibo at 1.2567 and 1.2710 respectively. The key support is at 1.1958.
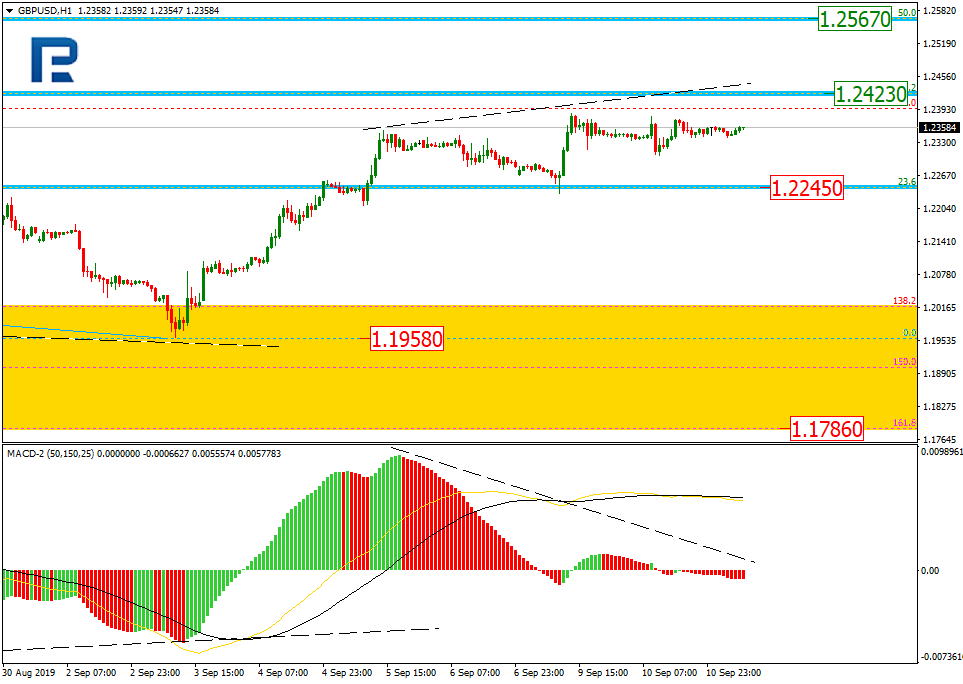
In the H1 chart, the pair is slowing down on its way towards 38.2% fibo at 1.2423 because of the convergence on MACD, which may indicate a new correction soon. The target of this pullback may be 23.6% fibo at 1.2245.
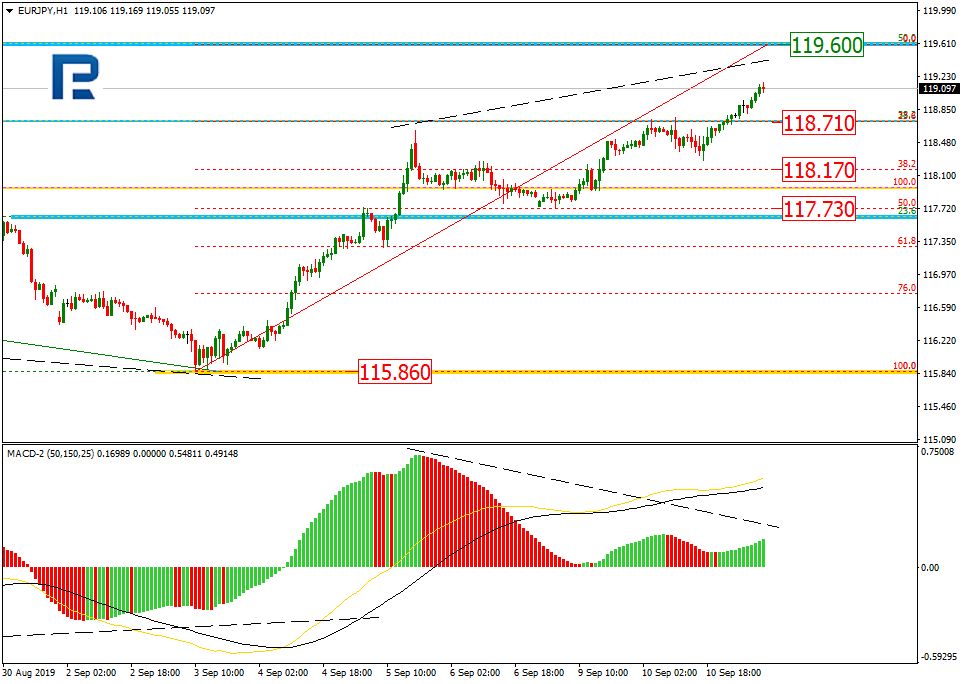
EURJPY, “Euro vs. Japanese Yen”
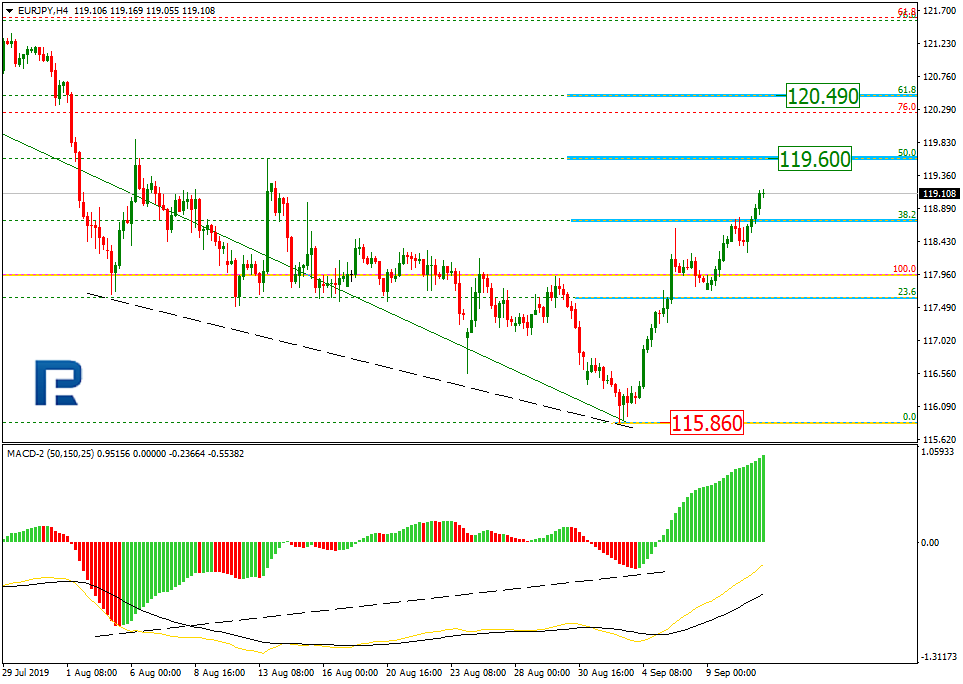
As we can see in the H4 chart, the convergence made EURJPY start a quick correctional uptrend, which is getting close to 50.0% fibo at 119.60. The next upside target may be 61.8% fibo at 120.49. The key support is the low at 115.86.
In the H1 chart, there is a divergence within the uptrend on MACD. After reaching 50.0% fibo at 119.60, the instrument is expected to start a new correction towards 23.6%, 38.2%, and 50.0% fibo at 118.71, 118.17, and 117.73 respectively.
Attention! Forecasts presented in this section only reflect the author’s private opinion and should not be considered as guidance for trading. RoboForex LP bears no responsibility for trading results based on trading recommendations described in these analytical reviews.
The EUR/USD currency pair continues to trade in a flat. The technical picture is ambiguous. The key support and resistance levels are: 1.10200 and 1.10600, respectively. Participants in financial markets took a wait and see attitude before the ECB meeting, which will be held on September 12. Experts predict that the regulator will take a number of measures to stimulate the economy. Today we expect important economic releases from the USA. We recommend opening positions from key levels.
At 15:30 (GMT+3:00), the US will publish a manufacturer’s price index.
Indicators do not give accurate signals: 50 MA crossed 100 MA.
The MACD histogram is located near 0 mark.
The Stochastic Oscillator is in the neutral zone, the %K line crossed the %D line. There are no signals at the moment.
Trading recommendations
Support levels: 1.10200, 1.09900, 1.09600
Resistance levels: 1.10600, 1.10850, 1.11150
If the price consolidates above 1.10600, expect further growth toward 1.11000.
Alternatively, the quotes can descend toward 1.09900-1.09700.
The GBP/USD currency pair
Technical indicators of the currency pair:
Prev Open: 1.23431
Open: 1.23447
% chg. over the last day: +0.03
Day’s range: 1.23405 – 1.23676
52 wk range: 1.1995 – 1.3385
The GBP/USD currency pair has stabilized after a long rally since the beginning of this month. The pound is currently consolidating. GBP/USD quotes are testing the local support and resistance levels at 1.23150 and 1.23800, respectively. We do not exclude further growth of the trading instrument. Additional support for sterling is provided by positive data on the labor market. Today we recommend paying attention to the news background from the USA. Positions must be opened from key levels.
The Economic News Feed for 11.09.2019:
Indicators point to the strength of buyers: the price has fixed above 50 MA and 100 MA.
The MACD histogram is in the positive zone, but below the signal line, which gives a weak signal to buy GBP/USD.
The Stochastic Oscillator is in the neutral zone, the %K line is above the %D line, which also indicates bullish sentiment.
Trading recommendations
Support levels: 1.23150, 1.22550, 1.22100
Resistance levels: 1.23800, 1.24400
If the price consolidates above 1.23800, expect further growth toward 1.24200-1.24400.
Alternatively, the quotes can drop toward 1.22600-1.22400.
The USD/CAD currency pair
Technical indicators of the currency pair:
Prev Open: 1.31654
Open: 1.31528
% chg. over the last day: -0.18
Day’s range: 1.31398 – 1.31528
52 wk range: 1.2727 – 1.3664
The USD/CAD currency pair continues to consolidate near two-month lows. Unidirectional trends are not observed. Investors expect additional drivers. At the moment, the local support and resistance levels are: 1.31350 and 1.31650, respectively. In the near future, technical correction of the trading instrument is not ruled out. Today we recommend that you pay attention to economic data from the United States, as well as the dynamics of oil prices. Positions must be opened from key levels.
The Economic News Feed for 11.09.2019 is calm.
The price fixed below 50 MA and 100 MA, which signals the strength of sellers.
The MACD histogram is in the negative zone, which also indicates a bearish sentiment.
The Stochastic Oscillator is in the neutral zone, the %K line crossed the %D line. There are no signals at the moment.
Trading recommendations
Support levels: 1.31350, 1.31000
Resistance levels: 1.31650, 1.31900, 1.32250
If the price consolidates below 1.31350, expect a further drop toward 1.31000-1.30800.
Alternatively, the quotes can recover toward 1.32000.
The USD/JPY currency pair
Technical indicators of the currency pair:
Prev Open: 107.241
Open: 107.538
% chg. over the last day: +0.33
Day’s range: 107.492 – 107.847
52 wk range: 104.97 – 114.56
The USD/JPY currency pair still demonstrates a pronounced upward trend. The yen hit 5-week lows against the US currency. Demand for safe assets remains low. At the moment, USD/JPY quotes are testing a local resistance of 107.850. Mark 107.500 is already a mirror support. A trading instrument has the potential for further growth. We recommend that you pay attention to the dynamics of yield on US government bonds. Positions must be opened from key levels.
The Economic News Feed for 11.09.2019 is calm.
Indicators signal the strength of buyers: the price has fixed above 50 MA and 100 MA.
The MACD histogram is in the positive zone and above the signal line, indicating bullish sentiment.
The Stochastic Oscillator is in the overbought zone, the% K line crossed the% D line. There are no signals at the moment.
Trading recommendations
Support levels: 107.500, 107.150, 106.850
Resistance levels: 107.850, 108.250
If the price consolidates above 107.850, expect further growth toward 108.200-108.400.
Alternatively, the quotes could drop toward 107.300-107.100.
The US producer prices index data will be released by the Department of Commerce ahead of tomorrow’s consumer price index data.
Economists are forecasting that the producer prices index will rise at a slower pace of 0.1% on the month. In July, headline PPI rose 0.2% on the month.
This is expected to keep the headline PPI unchanged at 1.7% on the year. This marks the same level of increase as the month before.
Excluding the volatile food and energy prices, the core PPI is forecast to rise 0.2%, reversing the decline of 0.1% in July.
U.S. producer prices index, July 2019
On a year over year basis, expectations are for the core PPI rate to nudge higher to 2.2% from 2.1% previously.
The producer prices index data is likely to be overshadowed with the inflation and retail sales numbers lined up over the remainder of the week.
The decline in the PPI for final demand was the first since October 2015. This was the underlying producer price index data. However, the headline PPI inched higher with an uptick in the cost of energy prices. But this could change in the upcoming data for August.
Energy prices, especially the price of international crude oil and gasoline prices, ticked lower in August. This could potentially see the underlying producer price index coming out lower again.
It would mark a second consecutive monthly decline.
Given the current economic landscape, the negative data is likely to put the onus on to the Fed to cut rates.
Meantime, economists continue to assess the impact of the tariff wars with China. So far, the US tariffs have had only a marginal impact. This is because most of the goods on which tariffs were increased fall into the capital goods category.
Producer Prices Remain Tame
The producer prices index briefly ticked higher in the months of March and April this year. The PPI change rose 2.2% for two consecutive months before steadily declining.
The declines in the PPI are mostly attributed to falling energy prices. Final demand for goods also remains somewhat weak, contributing to the downtrend.
However, we do not next the PPI to continue this trend in the near to medium-term outlook. There is scope for the PPI to eventually lift higher.
Various measures of manufacturing PMI, both in the US and in other developed economies show a disappointing trend.
Most of this is blamed on the trade war escalation and protectionist policies.
Meanwhile, fuel prices also remain weak. President Trump has made his intentions clear about keeping oil prices low. This stands in contrast to the oil producers’ expectations of higher prices.
Impact on Monetary Policy
From an economic perspective, the PPI data that will be coming out today is likely to be brushed aside. Meanwhile, the Federal Reserve will be holding its FOMC meeting in a week’s time.
The markets are bracing for another rate cut at this month’s meeting following the July cut.
However, back then, Fed Chair Powell said that it was only a mid-cycle adjustment. It will be interesting to see how the Fed’s forward guidance will look in September.
There is no doubt that the US economy has been losing steam since the start of this year.
Last week, in a speech, Powell cautioned that lower interest rates could put the central bank on the spot. He said that with lower rates, there is little room for the central bank to battle cyclical downturns.
With the global economy going through an uncertain patch, there has also been a downturn in global manufacturing.
As long as global demand remains subdued alongside oil prices, it is likely that the indicators such as the PPI will remain sluggish.
The US dollar did not change much against a basket of major currencies. The USD index (#DX) ended the trading session with a slight growth (+ 0.06%). It became known that China is going to free a number of American goods from the 25% fee. The list includes 16 types of goods. China is also considering a new list of goods that will not be subject to duties. The changes will take effect on September 17, 2019. Investors continue to monitor the development of trade relations between the United States and China.
The attention of experts as a whole is focused on the ECB meeting , which will be held tomorrow. It is expected that the regulator will lower the rate on deposit funds from -0.40% to -0.50%. Investors also expect that some measures will be taken to stimulate the eurozone economy. According to Bloomberg, more than 80% of economists expect the ECB to announce the start of a quantitative easing program at tomorrow’s meeting.
The British pound continued to strengthen against the US currency thanks to the publication of positive economic reports. Thus, the average level of wages including premiums increased in July by 4.0% instead of 3.7%. The number of applications for unemployment benefits rose to 28.2K, although experts predicted an increase to 29.3K.
Prices for oil continued to rise. WTI crude oil futures are currently testing $58.20 per barrel. At 17:30 (GMT+3:00), US crude oil inventories will be published.
Market Indicators
Yesterday, mixed trends were observed on the US stock markets: #SPY (-0.02%), #DIA (+ 0.22%), #QQQ (-0.29%).
Yields on the US government 10-year bonds continue to recover. At the moment, the indicator is at the level of 1.73-1.74%.
The Economic News Feed for 11.09.2019:
– US manufacturer`s price index – 15:30 (GMT + 3: 00).
NEWS &VIEWS Forecasts, Commentary & Analysis on the Economy and Precious Metals Celebrating our 46th year in the gold business
By USAGold.com
Bank of England governor Mark Carney, in something of a shocker, told the recent Jackson Hole central bankers’ conference that the world’s reliance on the US dollar ‘won’t hold’ and needs to be replaced by a new international monetary and financial system based on many more global currencies,” according to a Financial Times report. The greatest impact of Carney’s bombshell, though, came not from his opinion on the look and feel of some futuristic global monetary system. It came instead from his seeming tacit approval of the escalating movement to dethrone the dollar as the world’s reserve currency in the here and now. A good many in that audience were no doubt surprised – even rattled – by Carney’s remarks.
“Something is going on,” said St. Louis Fed President James Bullard in a Financial Times report, “and that’s causing I think a total rethink of central banking and all our cherished notions of what we think we’re doing. We just have to stop thinking that next year things are going to be normal.” To which FT added: “Interest rates are not going back up anytime soon, the role of the dollar is under scrutiny – both as a haven asset and as a medium of exchange – and trade uncertainty has become a permanent feature of policymaking.”
That about sums it up. The dollar at the moment is something of a Humpty Dumpty in the global monetary system – sitting on his wall oblivious and seemingly immune to all that goes on around him. Whether or not there will someday be a Great Fall remains to be seen, but increasingly, as Carney’s speech illustrates, forces are lining up against it.
“[H]istory,” Carney concludes, “teaches that the transition to a new global reserve currency may not proceed smoothly. Consider the rare example of the shift from sterling to the dollar in the early 20th Century – a shift prompted by changes in trade and reinforced by developments in finance. The disruption wrought by the First World War allowed the US to expand its presence in markets previously dominated by European producers. Trade that was priced in sterling switched to being priced in dollars; and demand for dollar-denominated assets followed. In addition, the US became a net creditor, lending to other countries in dollar-denominated bonds.” In other words, it laid the foundation for the so-called American Century that followed.
A similar transition now could impact the dollar and dollar-denominated assets just as it did sterling and sterling-denominated assets at the turn of the 20th century. Though few believe the dollar can be fully replaced with something else at this juncture, many believe that its influence could erode – or that the old could gradually give way to something new and different. In fact, as you are about to read, some see it as a process that has already begun.
De-dollarization boosts central bank gold purchases
Among the broad effects of the nascent de-dollarization movement has been to significantly boost central bank demand. The World Gold Council reports 651 metric tonnes in new gold purchases during 2018 – the highest level since the Bretton Woods Agreement was abandoned in 1971. China, Russia, Poland, and Hungary head the list of central banks adding gold to their central bank reserves in 2018 and 2019.
In a recent interview with the World Gold Council, Dr. Duvvuri Subbarao, former governor of the Reserve Bank of India, explains the connection between “de-dollarization” and central bank gold acquisitions. “In the immediate aftermath of the crisis,” he says, “we had to sell dollars to prevent our currency going into freefall. During Quantitative Easing, we had to buy dollars to protect our financial stability. And when the Federal Reserve began to taper QE, exchange rates slumped again and we had to defend ourselves with our reserves. All these events prompted one obvious question – is there an alternative to the dollar?”
“It is clear,” he goes on, “that gold is a risk diversifier – a hedge against not just financial risk but also political risk. It is also a long-term store of wealth. As such central banks, especially those from emerging markets, can increasingly see the merits of adding gold to their reserves. Over time, therefore, I am confident that gold’s role will increase among central banks.”
Chart courtesy of the World Gold Council
Currency problems stoke Asian physical gold demand
McKinsey & Co, the global consulting firm, warned in late August that a new Asian debt crisis might be in the making. Not surprisingly, gold is priced at all-time highs in a number of Asian currencies including the Japanese yen, India rupee and the Chinese yuan. It is also at all-time highs against the Malaysian ringgit and the Indonesian rupiah. Jayant Bhandari, the founder of Capitalism and Morality, provides some thought-provoking insights on the origins and sustainability of Asian gold demand. “Most of these people don’t really understand what is happening outside their boundaries,” says Bhandari, “so they have no option but to buy gold, silver, and currencies of Western countries. And that is why I think support for precious metals will continue to increase going forward. I don’t know what influence it will have in pricing, but really, if I had to suggest to someone on how to preserve his wealth, my suggestion would primarily be focused on gold and silver.”
If you think you could benefit from a concise review of the latest news, analysis, and opinion on the gold market from a variety of expert sources, then News & Views is the newsletter for you. Since the early 1990s, we have offered it free-of-charge as a monthly service to our regular clientele and as an incentive to prospective clients. By subscribing, you will automatically receive future editions and occasional in-depth Special Reports by e-mail.
A word on USAGOLD – USAGOLD ranks among the most reputable gold companies in the United States. Founded in the 1970s and still family-owned, it is one of the oldest and most respected names in the gold industry. USAGOLD has always attracted a certain type of investor – one looking for a high degree of reliability and market insight coupled with a professional client (rather than customer) approach to precious metals ownership. We are large enough to provide the advantages of scale, but not so large that we do not have time for you. (We invite your visit to the Better Business Bureau website to review our five-star, zero-complaint record. The report includes a large number of verified customer reviews.)
Disclaimer – Opinions expressed on the USAGOLD.com website do not constitute an offer to buy or sell, or the solicitation of an offer to buy or sell any precious metals product, nor should they be viewed in any way as investment advice or advice to buy, sell or hold. USAGOLD, Inc. recommends the purchase of physical precious metals for asset preservation purposes, not speculation. Utilization of these opinions for speculative purposes is neither suggested nor advised. Commentary is strictly for educational purposes, and as such USAGOLD does not warrant or guarantee the accuracy, timeliness or completeness of the information found here.
Michael J. Kosares is the founder of USAGOLD and the author of The ABCs of Gold Investing – How to Protect and Build Your Wealth With Gold. He is also editor and commentator for USAGOLD’s Live Daily Newsletter and editor of the News & Views monthly newsletter.
Even though the economic calendar is thin on Wednesday and volatility in Equities and FX markets subdued with awaiting the ECB rate decision on Thursday, one can clearly feel tensions among market participants – also in, at first glance, “ECB-uncorrelated” currency pairs like the USD/JPY.
After the NFPs Into the last weekly close came in mixed (130k vs 160k expected, but Average Hourly Earnings (MoM) were 0.4% against 0.3%), the USD/JPY bulls held the currency pair next to the crucial region around 106.80/107.
If the attempt to recapture 107.00 is sustainable, a further stint up to 108.50/109.00 is an option, especially if speculation of a favourable trade deal between the US and China for both sides start to manifest over the next days and weeks.
But now our thinking: not only that any new “Twitter escalation” from US president Trump ala “Sure, we aim on a favourable deal – for the US! China will pay!” could dampen the hopes and speculation that the US and China will agree on a deal and likely see a sharper drop from the current levels, identifying the current run above 107 a fake-out.
We should also remember that the very expansive monetary policy of the ECB and negative yield developments in European, especially German, bonds, have been a topic in Trump’s tweets several times over the last few weeks.
That said, a very dovish ECB on Thursday could realistically result in a new tirade from Trump, also bringing up speculation of an outright US currency market intervention or US Secretary of the Treasury Mnuchin saying something like “The US has no longer a strong US dollar policy”.
Both cases would be very bearish for the US-Dollar and push the USD/JPY sharply lower.
Here a drop below 105.80 could trigger here a wave of further selling and quickly activate the region around 105.00 again:
Source: Admiral Markets MT5 with MT5-SE Add-on USD/JPY Daily chart (between June 12, 2018, to September 10, 2019). Accessed: September 10, 2019, at 10:00pm GMT – Please note: Past performance is not a reliable indicator of future results, or future performance.
In 2014, the value of USDJPY increased by 13.7%, in 2015, it increased by 0.5%, in 2016, it fell by 2.8%, in 2017, it fell by 3.6%, in 2018, it fell by 2.7%, meaning that after five years, it was up by 4.1%.
Discover the world’s #1 multi-asset platform
Admiral Markets offers professional traders the ability to trade with a custom, upgraded version of MetaTrader 5, allowing you to experience trading at a significantly higher, more rewarding level. Experience benefits such as the addition of the Market Heat Map, so you can compare various currency pairs to see which ones might be lucrative investments, access real-time trading data, and so much more. Click the banner below to start your FREE download of MT5 Supreme Edition!
Disclaimer: The given data provides additional information regarding all analysis, estimates, prognosis, forecasts or other similar assessments or information (hereinafter “Analysis”) published on the website of Admiral Markets. Before making any investment decisions please pay close attention to the following:
This is a marketing communication. The analysis is published for informative purposes only and are in no way to be construed as investment advice or recommendation. It has not been prepared in accordance with legal requirements designed to promote the independence of investment research, and that it is not subject to any prohibition on dealing ahead of the dissemination of investment research.
Any investment decision is made by each client alone whereas Admiral Markets shall not be responsible for any loss or damage arising from any such decision, whether or not based on the Analysis.
Each of the Analysis is prepared by an independent analyst (Jens Klatt, Professional Trader and Analyst, hereinafter “Author”) based on the Author’s personal estimations.
To ensure that the interests of the clients would be protected and objectivity of the Analysis would not be damaged Admiral Markets has established relevant internal procedures for prevention and management of conflicts of interest.
Whilst every reasonable effort is taken to ensure that all sources of the Analysis are reliable and that all information is presented, as much as possible, in an understandable, timely, precise and complete manner, Admiral Markets does not guarantee the accuracy or completeness of any information contained within the Analysis. The presented figures refer that refer to any past performance is not a reliable indicator of future results.
The contents of the Analysis should not be construed as an express or implied promise, guarantee or implication by Admiral Markets that the client shall profit from the strategies therein or that losses in connection therewith may or shall be limited.
Any kind of previous or modeled performance of financial instruments indicated within the Publication should not be construed as an express or implied promise, guarantee or implication by Admiral Markets for any future performance. The value of the financial instrument may both increase and decrease and the preservation of the asset value is not guaranteed.
The projections included in the Analysis may be subject to additional fees, taxes or other charges, depending on the subject of the Publication. The price list applicable to the services provided by Admiral Markets is publicly available from the website of Admiral Markets.
Leveraged products (including contracts for difference) are speculative in nature and may result in losses or profit. Before you start trading, you should make sure that you understand all the risks.