By Hussein Sayed, Chief Market Strategist (Gulf & MENA), ForexTime
Stocks higher as US and China provide concessions
ECB to ease policy but may not meet dovish expectations
US inflation to determine the Fed’s interest rate trajectory
Stocks monitors were flashing green lights with China’s Renminbi strengthening on Thursday morning after US President Donald Trump announced a delay in tariffs on Chinese goods by two weeks. Trump’s postponement of the 5% extra tariffs came after China exempted some US goods from the 25% tariffs it imposed last year.
These small concessions, while symbolic, have been welcomed by investors and seen as a positive sign ahead of next month’s talks. However, it’s still too early to go all-in as the end result remains unpredictable given the complexity of the trade war. The rally in risk assets may begin to fade in the coming days as investors require concrete solutions, which are unlikely to come anytime soon given the structural differences between the two sides.
Toady’s European Central Bank interest rate decision is the key risk event of the week. The anticipation of an interest rate cut and new stimulus package has been very high in recent weeks given the deterioration of economic data in the Eurozone. Almost all economic data have weakened since the central bank’s last meeting on July 25, and the risk of a recession hitting Germany, the Eurozone’s largest economy, has been on the rise after GDP contracted in the second quarter.
While the ECB has proved to have no limits by how much it can lower rates, it faces many technical challenges. Negative interest rates have been hurting the banking sector for many years, as flat and inverted yield curves hit the profits of these banks. However, the ongoing trade war has hurt manufacturers across the Eurozone and the only tool to offset it is by weakening the Euro. Of course, President Trump won’t like to see the Dollar appreciating further from current levels, and he may push the Treasury Department to intervene in the currency. There’s also strong opposition from hawks in Germany and other Eurozone countries about restarting a new QE program. Given all these factors there’s a high chance for the ECB to disappoint today and send the Euro higher.
On the data front, investors will be watching the US CPI closely. Core inflation is anticipated to accelerate to 2.3% y-o-y in August from 2.2% in the previous month. Any upside surprise in prices may make the Fed’s job more complicated. While a 25-basis point rate cut looks like a done deal at next week’s FOMC, the trajectory of further cuts will be impacted if inflation continues to top forecasts.
Disclaimer: The content in this article comprises personal opinions and should not be construed as containing personal and/or other investment advice and/or an offer of and/or solicitation for any transactions in financial instruments and/or a guarantee and/or prediction of future performance. ForexTime (FXTM), its affiliates, agents, directors, officers or employees do not guarantee the accuracy, validity, timeliness or completeness, of any information or data made available and assume no liability as to any loss arising from any investment based on the same.
Risk-on sentiment got a shot in the arm, as US President Donald Trump delayed by two weeks a tariff hike on Chinese goods that was initially slated for October 1, while China has exempted a list of US goods from a 25 percent tariff imposed last year. Following these events, most Asian stocks and currencies opened in the green. The offshore Yuan strengthened by some 0.3 percent to trade closer to 7.09 against the US Dollar, Gold fell by 0.6 percent to dip briefly below the psychological $1490 level, while the Japanese Yen weakened past the 108 mark against the Greenback.
The latest developments surrounding the US-China trade conflict show that there’s enough goodwill on both sides to prevent a further escalation in trade tensions, at least over the immediate term. With high-level trade talks set to be held next month, global investors may have reasons to hope that the world’s two largest economies are inching closer to a meaningful resolution to this protracted saga.
Still, recent history has only shown how quickly previous bouts of optimism can unravel, dashed by the erratic and unpredictable nature of the US-China trade impasse. This ensures a lingering air of caution over global markets, even as risk assets are given another opportunity to make hay while the sun shines.
Brent Oil remains sluggish ahead of OPEC+ meeting
Brent oil remains mired around the $61/bbl range at the time of writing, despite the increased risk appetite in the markets, given news that US President Donald Trump is considering easing sanctions against Iran. While global investors will welcome any sign of de-escalating US-China trade tensions, Oil bulls may not necessarily rejoice at the prospects of easing tensions between the US and Iran, given that it could lead to more Oil supply coming back into the markets.
Oil prices could see near-term moves as OPEC+ ministers gather in Abu Dhabi today to discuss the current market situation and members’ compliance to the alliance’s ongoing supply cuts programme. The OPEC+ alliance must continue to showcase its resolve in rebalancing global Oil markets in the face of waning global demand and the tide of US shale output, or risk sending Brent prices back towards the $50/bbl level.
Disclaimer: The content in this article comprises personal opinions and should not be construed as containing personal and/or other investment advice and/or an offer of and/or solicitation for any transactions in financial instruments and/or a guarantee and/or prediction of future performance. ForexTime (FXTM), its affiliates, agents, directors, officers or employees do not guarantee the accuracy, validity, timeliness or completeness, of any information or data made available and assume no liability as to any loss arising from any investment based on the same.
By CentralBankNews.info Malaysia’s central bank left its benchmark Overnight Policy Rate (OPR) steady at 3.0 percent and while it confirmed its forecast for growth this year it was also more downbeat, saying the projection was “subject to further downside risks from worsening trade tensions, uncertainties in the global and domestic environment, and extended weakness in commodity-related sectors.” The comment about the risks to economic growth by Bank Negara Malaysia (BNM) underlines the threat to Asian economies from the fallout of the trade conflict between the U.S. and China, with BNM saying the global economy was now “expanding at a more modest pace amid slower growth in most major advanced and emerging economies,” In July BNM also referred to the downside risks from the ongoing uncertainties in the global economy but said the global economy “continues to expand moderately.” BNM confirmed its forecast for growth this year in a range of 4.3 to 4.8 percent, but said the recent escalation of trade tensions was pointing to weaker global trading going forward while domestic growth is expected to be supported by private spending. Malaysia’s economy expanded by annual 4.9 percent in the second quarter of this year, up from 4.5 percent in the first quarter. Inflation eased to 1.4 percent in July from 1.5 percent in June and BNM expects it to remain low but rise from the current year-to-date average of 0.3 percent. In May BNM lowered its OPR rate by 25 basis points in the first easing since July 2016 and reiterated that its current monetary policy stance remained accommodative.
Bank Negara Malaysia issued the following statement:
“At its meeting today, the Monetary Policy Committee (MPC) of Bank Negara Malaysia decided to maintain the Overnight Policy Rate (OPR) at 3.00 percent. The global economy is expanding at a more modest pace amid slower growth in most major advanced and emerging economies. The recent escalation of trade tensions point to weaker global trade going forward, with increasing signs of spillovers to domestic economic activity in a number of countries. Monetary policy easing in several major economies has eased global financial conditions, but uncertainty from the prolonged trade disputes and geopolitical developments could lead to excessive financial market volatility. For Malaysia, the stronger economic growth performance in the second quarter of 2019 was underpinned by the resilience of private spending amid broad-based expansion in key economic sectors. Going forward, these domestic drivers of growth, alongside stable labour market and wage growth, are expected to remain supportive of economic activity. On the external front, Malaysia’s diversified exports will partly mitigate the impact of softening global demand. Overall, the baseline growth projection for 2019 remains unchanged, within the range of 4.3% – 4.8%. This projection, however, is subject to further downside risks from worsening trade tensions, uncertainties in the global and domestic environment, and extended weakness in commodity-related sectors.
Average headline inflation year-to-date is 0.3%. Headline inflation is projected to average higher for the remaining months of the year and into 2020. However, headline inflation is expected to remain low. This reflects the lapse in the impact of consumption tax policy changes, the relatively subdued outlook on global oil prices, and policy measures in place to contain food prices. The trajectory of headline inflation will, however, be dependent on global oil and commodity price developments. Underlying inflation is expected to remain stable, supported by the continued expansion in economic activity and in the absence of strong demand pressures. At the current level of the OPR, the stance of monetary policy remains accommodative and supportive of economic activity. The MPC will continue to assess the balance of risks to domestic growth and inflation, to ensure that the monetary policy stance remains conducive to sustainable growth amid price stability.” www.CentralBankNews.info
US stock indexes extended gains on Wednesday as Beijing announced it exempted some US products from retaliatory import tariffs. The S&P 500 gained 0.7% to 3000.93. The Dow Jones industrial average advanced 0.9% to 27137.04. Nasdaq rose 1.1% to 8169.67. The dollar strengthening accelerated after data showing wholesale price growth rose year-over-year at a 1.8% rate, after a 1.7% advance in July: the live dollar index data show the ICE US Dollar index, a measure of the dollar’s strength against a basket of six rival currencies, rose 0.3% to 98.63 and is higher currently. Stock index futures point to higher openings today.
FTSE 100 paces European indexes gains
European stocks accelerated their rebound on Wednesday as China exempted 16 types of US products from retaliatory tariffs. Both GBP/USD and EUR/USD turned lower yesterday with both pairs sliding currently ahead of the European Central Bank (ECB)meeting today. The Stoxx Europe 600 gained 0.8% led by basic resources shares. Germany’s DAX 30 advanced 0.7% to 12359.07. France’s CAC 40 gained 0.4% and UK’s FTSE 100 rose 1.0% to 7336.03. The ECB is expected to announce new stimulus measures for euro-zone suffering from chronic low inflation.
Hang Seng falls while Asian indexes gain
Asian stock indices are extending gains today after President Donald Trump tweeted he will delay implementing tariff hikes from 25% to 30% on $250 billion of Chinese goods for two weeks as a “gesture of good will.” Nikkei gained 0.8% to 21759.61 as yen continued sliding against the dollar. Chinese stocks are mixed: the Shanghai Composite Index is up 0.75% while Hong Kong’s Hang Seng Index is 0.25% lower. Australia’s All Ordinaries Index added another 0.25% despite resumed climb of Australian dollar against the greenback.
Brent futures prices are extending losses today. Prices fell yesterday despite the Energy Information Administration report US crude inventories dropped by 6.9 million barrels, while gasoline inventories fell by 0.7 million barrels. Prices fell after reports President Donald Trump is considering easing sanctions on Iran: November Brent crude dropped 2.5% to $60.81 a barrel on Wednesday.
Note: This overview has an informative and tutorial character and is published for free. All the data, included in the overview, are received from public sources, recognized as more or less reliable. Moreover, there is no guarantee that the indicated information is full and precise. Overviews are not updated. The whole information in each overview, including opinion, indicators, charts and anything else, is provided only for familiarization purposes and is not financial advice or а recommendation. The whole text and its any part, as well as the charts cannot be considered as an offer to make a deal with any asset. IFC Markets and its employees under any circumstances are not liable for any action taken by someone else during or after reading the overview.
There’s a pretty strong consensus in the markets that something will come out of the ECB monetary policy meeting tomorrow. The question that will move the markets is: what?
There are quite a few potential measures that the ECB could take, and they all have different implications.
Before going over the options on the table, there is something unique about this meeting that could sway the results. This is the last meeting to be chaired by Mario Draghi, before Christine Largarde takes over.
Generally, it would be expected for the outgoing President to keep policy in line so new leadership can have a “clean slate” to enact their policy. But there are many analysts pointing out that Draghi wants to put forward something significant for his last meeting, to hand over the European economy in the best setting possible as he sees it.
Interest Rates
The major question is whether the bank will cut rates. And going over Draghi’s comments as far back as June, this seems to be the case. The argument for a rate cut has been as an “insurance” adjustment for the less positive (but still not a recession) economic data over the last few months. This would be in line with the Fed’s last action.
There seems to be little objection to a rate cut among the board members. Even from the more hawkish Germans!
It should be noted that there is also expectations of further action by the Fed, which meets next week, along with the BOJ and SNB. This might be an opportunity for the ECB to “get ahead” of other major banks that are also considering action.
Asset Purchases
The more controversial proposal would be to restart buying bonds to support the economy.
Draghi has shown he is publicly in favor of this option, and the ECB has commissioned a study to explore how much and when to buy. Many analysts are in agreement that some kind of bond purchasing program will be announced, with the amount projected between €20-40B.
The problem is the hawkish members of the board are opposed to this kind of measure This is especially tr7ue for German, Austrian and Finnish members. Part of the problem is that the ECB has largely bought up all of the available bonds according to their current rules.
Cutting the Deposit Rate
This is a more technical measure and refers to how much banks have to pay to keep their money in the ECB. A “cut” here would raise the cost of keeping reserves in the ECB’s vault, in theory incentivizing banks to loan out more.
Since 2016, European banks have been keeping 13 times as much money in reserves than is required.
Banks argue that this is because of a lack of profitability due to the low interest rates. This measure also has considerably more consensus than the asset purchases. An argument for it is that by cutting the deposit rate by at least 20 points, it will maintain the interest spread and keep from encouraging banks to deposit more funds and diluting the effect of the rate policy.
But many central bank trackers are expressing concern that the market might be getting ahead of the facts, and that the ECB won’t take as drastic action as is being priced in. That would expose upside risk for the euro if the central bank under-delivers.
Several Board members have already expressed concern about the long term effects of continued easing policy. The worry now is that the ECB has fallen into a liquidity trap similar to Japan; an argument that would be in favor of more asset purchases and not cutting the interest rate. However, that is not a view shared by a majority.
Bond yields and the currency show that the market is pricing in significant action from the ECB, in line with the consensus view. This would likely include a rate cut plus additional measures. The “surprise” to the downside for the markets would likely be an announcement of a significant amount of asset purchases since that has the least agreement.
Traders can expect volatility with tomorrow’s European Central Bank (ECB) rate decision and subsequent press conference. This will be President Draghi’s second to the last meeting before relinquishing his role to Christine Lagarde. Is Draghi sure that all easing tools should be readily deployed now or in possible stages? Would he wish to leave incoming President Lagarde to make some of the longer-lived decisions? Or act now with her approval? Will Draghi be able to twist enough arms on the Governing Council, given the opposition to significant stimulus from Germany, the Netherlands and France? Is the ECB technically ready to roll out multiple forms of stimulus and along what timeline?
Deposit Cut
A deposit rate cut is on the table. Keen market watchers expect a 10bps reduction to -0.5% whereas consensus stands at 10 or 20bps. A smaller reduction now could trigger a further reduction later if not done in one fell swoop. Tiering of reserves, below which negative rates may not apply, is possible to mitigate some of the damage done to bank profitability and the lending cycle against Draghi’s points about the benefits.
What Could QE Look Like
The grander issue is whether the ECB is ready to roll out another wave of quantitative easing. If so, how much will it purchase, over what time horizon, and across what mixture of assets? The ECB’s self-imposed limit of 33% remains higher than the current share of just under 30%. Assuming a moderate pace of growth in eligible marketable assets, hitting the 33% limit by the end of next year would afford room for monthly purchases on the order of about €34 billion per month if the purchases began in early January which would imply a smaller flow than prior QE exercises. A longer-lived program perhaps starting earlier would result in lower monthly purchases if the ECB stayed within the 33% limit. A higher purchase target would require raising the 33% limit. This is subject to at least equal parts of politics and economics in the driving considerations.
ECB & QE Effectiveness
Ultimately QE will do little to address the root of the problems in the Eurozone, which is the lack of credit demand. For instance, the money multiplier effect in the Eurozone has been declining for years. However, surveys indicate that demand for credit from businesses and households have also been trending lower as well despite the availability of cheap credit. Even with the move lower in real yields, gross savings for households have been rising and not falling. Prior rounds of QE have done little to solve this problem.
ECB’s QE & The Euro
The final question is, wouldn’t QE help to weaken the EUR? Yes, even if the ECB has said it doesn’t target the exchange rate. However, it’s interesting to note that despite prior rounds of QE, net portfolio investment has been less harmful (meaning that flows have been EUR supportive) over the past few years. This has helped to offset the downward effect on the EUR from lower domestic yields. Market watchers doubt a fresh round of asset buying is enough to reverse inward flows.
Technical Takeaway
Prices remain in a consolidation phase under 1.1075/1.1105 resistance. This price action continues to appear corrective after the impulsive reversal from 1.0930 wedge support. As such, look for further recovery while over the 1.1020-1.0975 region, with a rally through 1.1115 opening the wedge highs in the 1.1250-1.1315 region. While the potential is there for the entire process from September to be completing around 1.0930, for a move back towards 1.1600-1.1800, more price action confirmation is required to suggest that this is the case. A decline through 1.0975 and 1.0930 would negate this optimism, with 1.0815 next support below. If seen, we would again look for signs of a base developing around that lower level.
With the silver price now experiencing a correction after running up more than $5 in the past three months, we now see more articles suggesting price manipulation as the bullion banks hammer the metals. There continues to be this notion put forth by many precious metals analysts that the bullion banks, especially JP Morgan, are controlling the gold and silver prices.
While I have no doubt there is an intervention in the precious metals markets, we must remember that the Fed and central banks are manipulating the ENTIRE MARKET with money printing, bond purchases, debt issuance, and zero (or negative) interest rates. However, the current price of gold and silver, even with the supposed market rigging, are still priced higher than their overall average production cost.
Unfortunately, the fact that the prices of most goods and services are based on their cost of production tends to be overlooked by the majority of the analyst community… whether they are from the mainstream or alternative media. I can assure you that if you consider the price of a standard pair of jeans (not a high-end name), it would be based on the entire cost structure from beginning to end, when it finally shows up on the retail shelf.
No company can sell a product for less than it costs for an extended period of time, or they will go bankrupt. On the other hand, the market would not pay 100% more than the cost for a typical pair of jeans, if the competition was selling it at 10% over cost. Economics 101.
Now, if we want to understand the MANIPULATION of the market, we have to realize where the extremely OVERVALUED or INFLATED prices are contained. As I have stated many times, the majority of STOCKS, BONDS, and REAL ESTATE are where the focus of the Fed and central banks manipulation have been directed. Why? Because that is where 99% of the market has invested its funds.
Thus, the overwhelming majority of goods and services, including precious metals, are not overvalued, but this is not true for the majority of stocks, bonds, and real estate. These supposed assets are extremely overvalued. Which means, this is where the greatest degree of market intervention is directed.
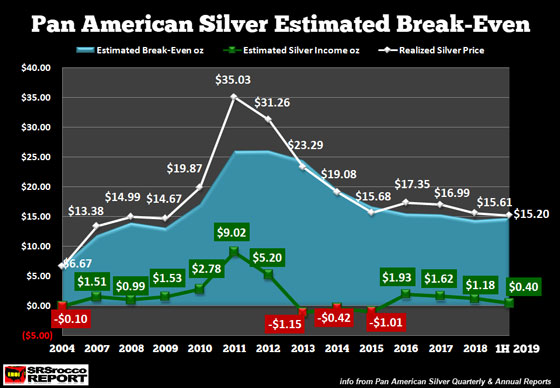
If we understand that the price of most goods and services are tied to their cost of production, here is a chart of Pan American Silver’s estimated break-even and its profit or loss per ounce:
The WHITE LINE represents the silver price Pan American Silver received that year and the green, and red prices show the estimated profit or loss per ounce (Green = profit, RED = loss). When the silver price shot up to an average of $35 in 2011, Pan American Silver enjoyed a healthy $9.02 profit per ounce. However, if we look at the majority of years, Pan American Silver made a profit or loss of about $1-$1.50 an ounce.
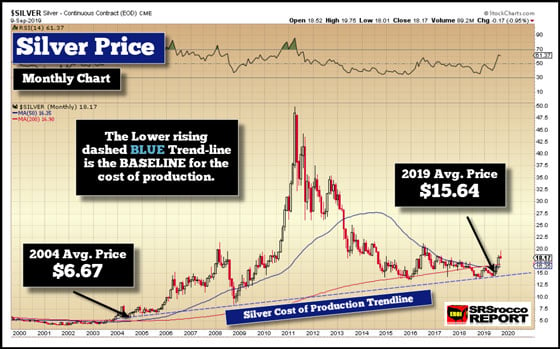
So, should we expect Pan American Silver to earn $9-$10 profits per ounce a year for an extended period?? That depends on how the market is valuing silver. Currently, and for quite a while, silver has been valued based on its COST OF PRODUCTION. And we can clearly see this shown in the long-term silver chart:
The lower BLUE-DASHED trend line represents the silver cost of production. While it was likely much higher in 2011 and 2012, the silver cost of production trendline provides a good floor in the silver price. If we look at the Pan American Silver chart above, we can see that in 2004, the company lost an estimated 10 cents an ounce and in the 1H 2019 (first six months) it earned a 40 cent profit per ounce.
So, the silver price chart represents the REALITY taking place in the silver industry if we look at the metal as a commodity, based on the cost of production. However, silver is more than just a commodity used to make Solar Panels and I-Phones. Silver is also a store of value and money. But, the market is not valuing gold or silver as money currently, BUT IT WILL.
Setting The Record Straight On Silver Manipulation
As I mentioned at the beginning of the article, several analysts are suggesting that the bullion banks are manipulating the silver price… almost as if the silver price was the only metal being manipulated. Of course, they throw gold in there as well. Yes, banks have indeed used “Spoofing” and “Other trading tactics” in the gold and silver market for their own gains, but all of that manipulation does not change the simple fact that the current silver price is ABOVE the cost of production.
Now, it would be one thing if the bullion banks and their shrewd precious metals traders were pushing silver down to $8-$10 an ounce. That would likely bankrupt a large percentage of the primary silver mining industry. However, we have not seen that.
Furthermore, there is this idea that the massive amount of paper silver trading is substantially above the physical supply of the market. Thus, several analysts state that paper trading does not provide an accurate measure of the physical silver market. While that may be true, it’s also the case for the other metals and energy. Silver is not the only asset class with a tremendous amount of notional trading volume.
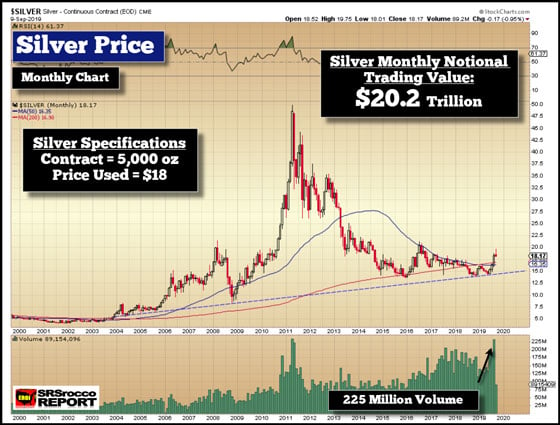
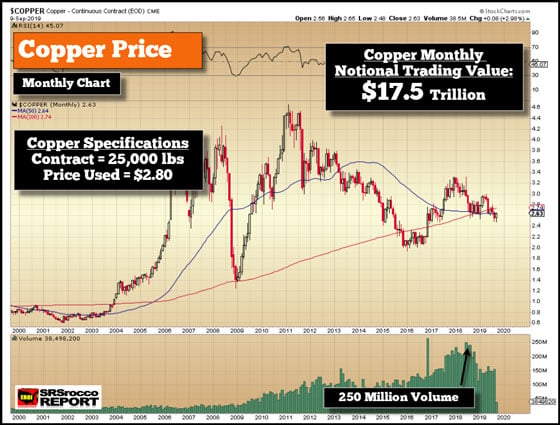
If we look at the next series of charts, you will see the monthly notional trading value for each. Stockchart’s volume of the metals and oil is taken from the U.S. futures markets. All I did to calculate the monthly notional trading volume was to multiply the peak monthly volume, by the contract size and price.
Let’s start with silver. A silver contract on the COMEX is for 5,000 oz. With 225 million in volume in August, at $18 an ounce, the notional trading volume was $20.2 trillion:
Please understand, I am just making a simple calculation here and with the other charts. No need to get too sophisticated. The silver trading volume in the chart above may include the smaller 1,000 oz Mini, but I am not sure. So, in August when silver shot up more than $2.00, the notional trading volume was a whopping $20.2 trillion. Sounds insane… ah? Well, let’s look at copper. If we use peak copper volume back in 2018, of 250 million contracts, it traded $17.5 trillion in notional value:
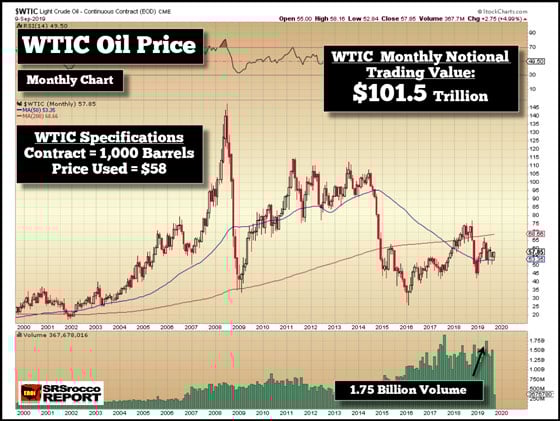
So, we can plainly see that silver’s $20.2 trillion in notional trading volume isn’t that extreme now when we compare with copper. Now, let’s take it a step further and look at how much WTIC Oil (U.S. West Texas Intermediate) traded in a single month:
The market traded an astonishing $101.5 trillion in notional value in the WTIC oil that month. If we thought silver trading 225 million in monthly volume and copper at 250 million, well, WTIC Oil blowing through 1.75 billion contracts in a month… that TAKES THE CAKE.
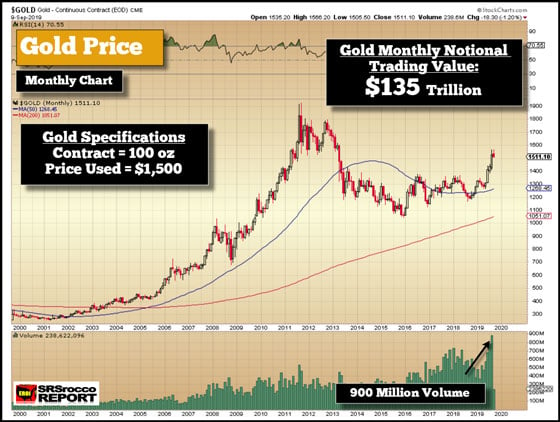
And lastly, we have gold. Last month, gold’s notional trading volume was a stunning $135 trillion:
While it is true that gold is trading more than oil in monthly notional trading volume, THEY ARE ALL QUITE HIGH. Furthermore, the top gold miners cost of production is about $1,200 an ounce, and at $1,500, they are now making some decent profits, regardless of the 900 million (rounded higher) in volume traded on the markets.
I just wanted to point out that the majority of the market is experiencing a tremendous amount of trading. And let’s not forget, the NASDAQ Index is trading over 40 billion in volume every month. Thus, the NASDAQ’s monthly trading volume is more than 10 TIMES the peak trading monthly volume of Silver, Copper, WTIC Oil, and Gold combined.
How about them apples?
So, we need to put the market trading and manipulation of silver into perspective. While it is likely true that silver and gold are being manipulated… so is just about EVERYTHING else.
The key to understanding when the Fed and central banks lose control of manipulating the markets, we need to pay attention to what is taking place in the Oil Industry, especially the U.S. Shale Oil Industry. Why? How much economic activity would be generated if the OIL TAP was suddenly shut off?? How would that impact the trillions in Financial Paper Assets???
Precious metals investors need to become a bit more sophisticated in understanding the dynamics of the overall market and stop just focusing one aspect of Silver Manipulation and the supposed coming BIG SHORT SQUEEZE. Yes, we could see a short squeeze in silver, but the coming huge revaluation of silver and gold will occur when global Stocks, Bonds, and Real Estate really begin to crumble due to the central banks losing control of the massive debt and leverage.
And how will the Fed and central banks lose control of the market? That’s right… OIL. While the central banks can print money, they can’t print barrels of oil. Take a good look at Venezuela, and you will see how money printing works as oil production plummets… the result is HYPERINFLATION on steroids.
Lastly, the U.S. Shale Oil Industry is in serious trouble. According to the estimates I have seen, $137 billion of debt will come due by these U.S. oil and gas companies over the next two years. How are they going to repay or roll over this debt? Good question. And, on top of that, it seems as if production is now leveling off in several of the major shale oil fields.
With the U.S. Shale Oil industry accounting for 75% of global oil production growth since the 2008 financial crisis, they are the CANARY IN THE COAL MINE.
The Money Metals News Service provides market news and crisp commentary for investors following the precious metals markets.
It was a choppy trading session for oil markets as prices initially rose roughly 1% on Wednesday morning before later surrendering all gains to shed -0.6% as of writing.
Although bulls are finding support from a sharp drop in US crude stockpiles, gains are being limited by an appreciating Dollar and reports of OPEC cutting its forecast for oil demand in 2020. Oil could still recover in the near term thanks to the improving market mood and speculation around OPEC+ extending production cuts. However, the upside is bound to face numerous obstacles down the road.
The dynamic influencing oil prices are certainly shifting from supply side to demand side factors and this continues to be reflected in the commodity’s valuation. Should US-China trade tensions make an unwelcome return and reignite fears around slowing global growth, oil will be exposed to downside shocks.
However, despite all the uncertainty, oil still remains in the black year-to-date with WTI Crude rising 28% and Brent appreciating 17%. Nevertheless, I still believe the outlook for oil will be clouded by trade developments and global growth concerns for the rest of 2019.
Taking a look at the technical picture, WTI Brent remains in an uptrend on the daily charts. A solid daily close above $63.00 should inspire a move higher towards $65.00. Should trade tensions return and revive risk aversion, prices may make a move back towards $60.00.
Euro weakens to one-week low as ECB meeting looms
The Euro was bullied by almost every single G10 currency today excluding the Danish Krona as anticipation mounted ahead of the European Central Bank meeting on Thursday.
Expectations are very high over the central bank joining the global easing bandwagon in a bid to support the Eurozone’s economy. While the Euro is positioned to weaken further if the ECB fulfils the dovish market expectations, it remains to be seen whether this will have the desired impacts on the European economy.
Focusing on the technical picture, the EURUSD remains in a bearish trend on the weekly charts. A solid weekly close below 1.1000 should open the doors towards 1.0900. If Mario Draghi disappoints, the Euro should rebound towards 1.1100.
Disclaimer: The content in this article comprises personal opinions and should not be construed as containing personal and/or other investment advice and/or an offer of and/or solicitation for any transactions in financial instruments and/or a guarantee and/or prediction of future performance. ForexTime (FXTM), its affiliates, agents, directors, officers or employees do not guarantee the accuracy, validity, timeliness or completeness, of any information or data made available and assume no liability as to any loss arising from any investment based on the same.
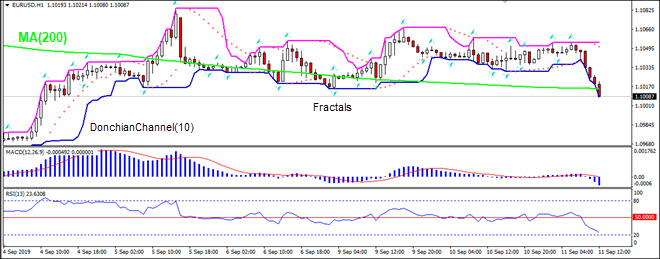
French and Italian industrial production data for July were worse than expected. Will the EURUSD decline?
The price chart on 1-hour timeframe shows EURUSD: H1 is still trading sideways. The price has breached below the 200-period moving average MA(200) which is declining. And the RSI is below 50 level and falling toward oversold zone. There is no trend yet formed, traders have to decide when it would be a best time to enter the market.
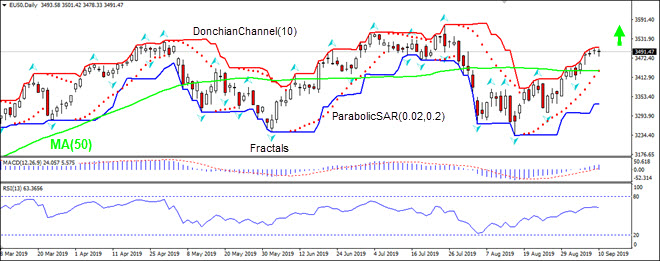
Accelerating euro area private sector activity bullish for EU50
Euro-zone’s private sector activity expansion was stronger than expected. Will the DE30 stock index continue advancing?
German strong trade data spurred hopes euro-zone economy is in better shape than feared. July trade surplus rose to 20.2 billion euro from 18.08 billion previous month when a smaller increase to 18.B billion was forecast. Stronger than expected German trade report followed an upgrade in euro-zone composite PMI: Markit’s final reading of composite PMI was revised upward to 51.9 for August from a preliminary reading of 51.8. The reading for July was 51.5. Accelerating expansion in euro-zone private sector activity for August is bullish for euro-zone stock market index.
On the daily timeframe EU50: D1 is rising after breaking above 50-day moving average MA(50).
The Donchian channel indicates no trend: it is flat.
The MACD indicator is above the signal line and the gap is widening, which is a bullish signal.
The RSI oscillator is above 50 level but has not reached the overbought zone.
We believe the bullish momentum will continue as the price breaches above the upper boundary of Donchian channel at 3505.18. This level can be used as an entry point for placing a pending order to buy. The stop loss can be placed below the fractal low at 3405.30. After placing the order, the stop loss is to be moved every day to the next fractal low, following Parabolic signals. Thus, we are changing the expected profit/loss ratio to the breakeven point. If the price meets the stop loss level (3405.30) without reaching the order (3505.18), we recommend cancelling the order: the market has undergone internal changes which were not taken into account.