The US dollar closed bearish, marking two consecutive days of declines. This comes as investors likely booked profits ahead of the Wednesday FOMC meeting. The Federal Reserve is expected to lower interest rates by a quarter basis point. Meanwhile, on the economic front, retail sales rose 0.4% on the month in August. This beat estimates of a 0.2% increase.
Euro Maintains Gains as Trade Surplus Rises
The euro currency managed to hold on to the gains from the ECB meeting on Thursday. The common currency posted modest gains on Friday. The trade surplus report for July showed an increase. On a seasonally adjusted basis, eurozone’s trade surplus rose to 19 billion from 17.7 billion in June. Exports gained 6.2% while imports rose 2.3% on the year ending July.
EURUSD Could Retest Support
The upside momentum looks to be fading at the moment. As a result, this could push the common currency lower to test the support at 1.1030. Establishing support at this level will open the upside bias. The resistance level at 1.1140 will be the likely target in the near term. However, a breakdown below the support could keep EURUSD back to the sideways range.
GBP Rallies on DUP Reports
Sterling surged strongly on Friday after reports that the Democratic Union Party (DUP) is softening its stance on the Irish backstop. The Irish backstop has been the main sticking point in the Brexit negotiations so far. However, GBP maintained gains despite the party dismissing the reports as rumors. Boris Johnson is due to meet his EU counterparts later today.
GBPUSD Gains to Stall Near Resistance
The currency pair, after consolidating near the support area of 1.2328 has managed to resume the rally. The gains have pushed GBPUSD close to the resistance area of 1.2511–1.2533. A test of this level will potentially put a lid on the gains for the moment. GBPUSD could, therefore, settle back within the range of the said resistance level and the lower support at 1.2328.
Gold Prices Decline for Three Consecutive Weeks
The precious metal closed on Friday in the red marking three consecutive weekly declines. The bearish pullback to the strong rally comes ahead of the key monetary policy decision from the Federal Reserve and many other central banks. Easing trade tensions between the US and China also contributed to the risk-on sentiment.
Will XAUUSD Break the Support?
Price action in XAUUSD has been concentrated within the range of 1508 and 1485. Failure to breakout higher has kept price subdued. Therefore, there is a good chance that gold could continue its descent. The lower support at 1431–1428 therefore, cannot be ruled out. A retest of this level to establish support will mark the completion of the longer-term correction in the precious metal.
Last week, the ECB meeting was a key event in the financial markets. The regulator, as expected, introduced additional measures to stimulate the Eurozone economy. The Central Bank also lowered its forecast for GDP growth and inflation in the Eurozone for the current and next years. Donald Trump criticized the Fed for a “strong” dollar. Financial market participants expect the Fed and the Bank of England meetings.
Demand for commodity currencies has increased significantly after attacks on oil facilities in Saudi Arabia, which led to a loss of about 5-6% of world production of raw materials. The growth of oil quotes exceeded 9%. The United States blamed Iran for this incident. Donald Trump said that the United States was on alert. The US President also allowed the use of strategic oil reserves to stabilize the situation in the oil market. We recommend following the current information on this issue.
The British pound reached the $1.25 mark amid optimistic Brexit news. Northern Ireland’s largest political party agreed to accept some of the rules of the European Union after Brexit. Investors also continue to monitor trade negotiations between Washington and Beijing.
Market Indicators
On Friday, the main US stock indices showed mixed results: #SPY (-0.07%), #DIA (+0.10%), #QQQ (-0.36%).
The 10-year US government bonds yield has moved away from local highs. At the moment, the indicator is at the level of 1.82-1.83%.
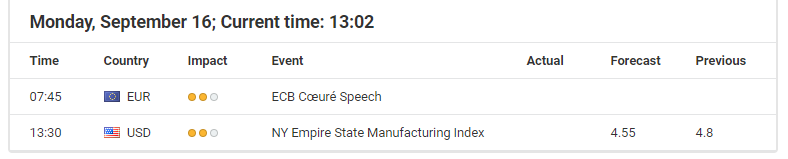
The Economic News Feed for 16.09.2019:
Today, the news feed will be calm enough. At 15:30 (GMT+3:00), the NY Empire State manufacturing index will be published.
Economic data for the week ahead will see the momentum being maintained. Following the ECB’s meeting last week, the focus shifts to other central banks.
This week, the Federal Reserve, the Bank of England, the Bank of Japan, and the Swiss National Bank will be holding their respective monetary policy meetings.
Among the various central banks, the Fed’s meeting will be closely watched.
Elsewhere, economic data over the week will see New Zealand releasing its GDP figures, while Canada will be coming out with inflation and retail sales numbers.
China will be releasing the industrial production and retail sales figures which are expected to improve.
USD Busy with Economic Reports and Monetary Policy
The week ahead will be somewhat busy as far as the US dollar is concerned. A mix of forward-looking economic reports alongside the Fed’s monetary policy decision is on the docket this week. Investors head into the week ahead with expectations.
US Housing Data on the Tap
The week ahead will see various measures of the housing market. These include building permits, housing starts, and existing home sales reports.
Existing home sales could rebound after falling for two consecutive months. Meanwhile, building permits are forecast to slow modestly during the period.
But with the Fed meeting being the big-ticket item, the economic reports could be brushed aside.
Fed Expected to Cut Interest Rates
The central bank concludes its two-day FOMC meeting on Wednesday. The meeting will see a release of the central bank’s decision on interest rates. There will also be fresh economic projections and the Fed members’ dot plot.
Markets are already discounting a quarter basis point rate cut this week. As a result, the Fed funds rate will move down to 1.75%-2.00%. The economic projections and the dot plot will be of interest. Fed Chair, Jerome Powell will also be hosting a press conference later in the day.
The Fed meeting comes amid President Trump’s call for lower interest rates.
Will There be any Surprises from Japan?
This week will be somewhat busy as far as the yen is concerned. The week ahead will see various reports such as trade balance and inflation numbers. Not to forget, the Bank of Japan’s meeting is due on Thursday.
The events could keep the yen somewhat volatile. The BoJ meeting comes just a few hours after the FOMC meeting.
Trade Balance and Inflation Numbers
Ahead of the BoJ meeting, trade balance figures are due.
In July, Japan’s exports fell for eight consecutive months. This coincided with investor confidence turning negative as well for the first time in six years. It was as a result of a fall out with the US and China trade dispute.
On Friday, Japan will be releasing its inflation figures too. The national core CPI figures are due. Expectations show a 0.5% increase in the core CPI. This marks an unchanged print from the previous report.
Anything new from the Bank of Japan?
The Bank of Japan’s monetary policy meeting might not garner that much attention as that of the Fed. But recent narrative from various policymakers shows growing concerns. Inflation remains stubbornly low.
There is a slight consensus that the Bank of Japan could ease policy further this week. This comes amid the flattening yield curve. The solution to this is seen by lowering the short-term rates even further.
Japan’s interest rates currently stand at -0.10%. While not fully discounted, a surprise rate cut could, however, jolt the markets. It should be mentioned that the BoJ previously tried this approach when it lowered interest rates to -0.10%.
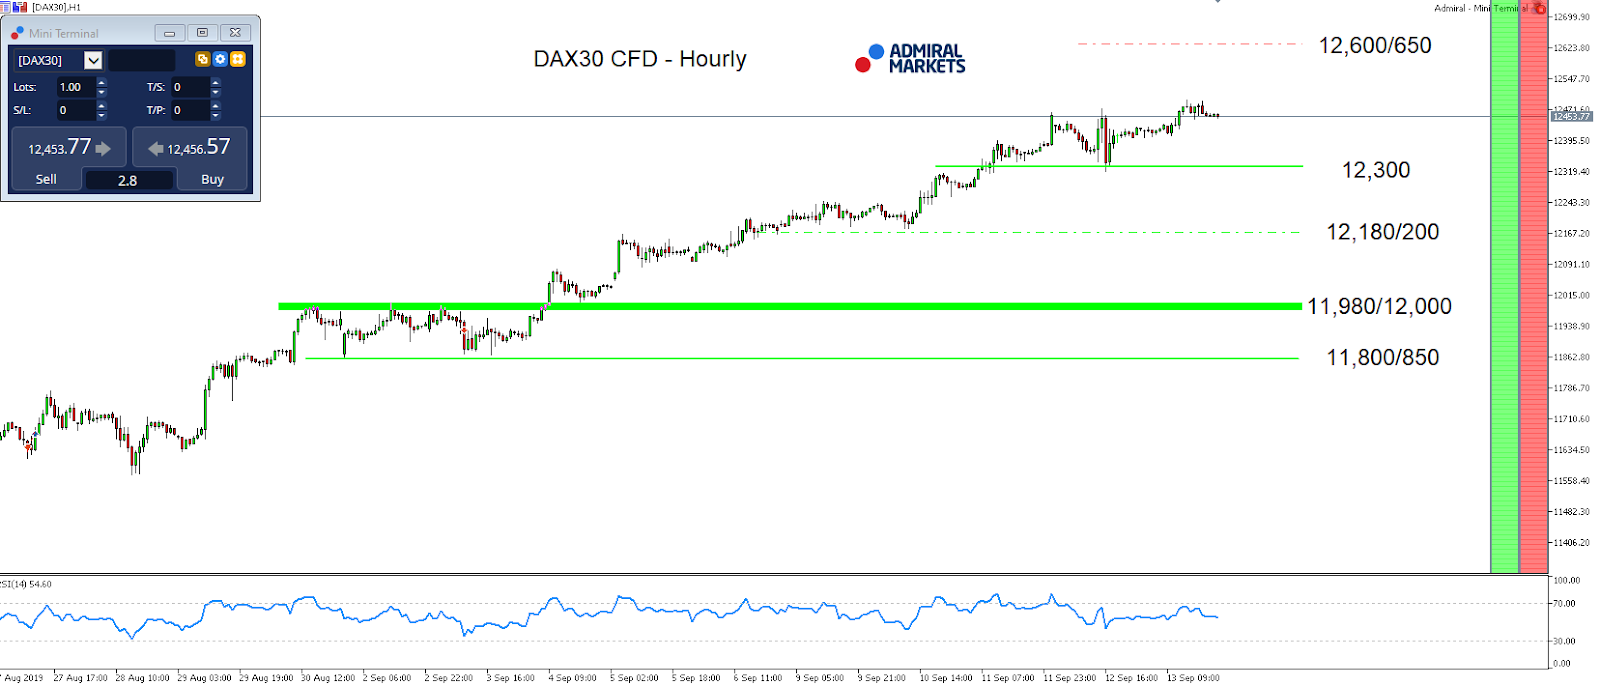
With the Economic calendar being quite thin as we begin the trading week, trading in the DAX30 CFD will be most likely driven by technical factors and the ECB decision’s aftermath.
Our view in general is that the ECB opened the door for further gains in the German index with the decision to cut the deposit rate to -0.5%, implementing a 2-tier system for reserve remuneration and especially re-launching QE at €20bn per month beginning November 1, and will, for as long as necessary, reinforce the accommodative impact of policy rates.
With the long sequence on H1 staying intact above 12,300 points, our target on the upside around 12,600/650 points stays active.
Only a drop below 12,300 points would darken the technical picture, switch the mode to neutral, activating the region around 12,180/200 points as a first target:
Source: Admiral Markets MT5 with MT5-SE Add-on DAX30 CFD Hourly chart (between August 26, 2019, to September 13, 2019). Accessed: September 13, 2019, at 10:00pm GMT
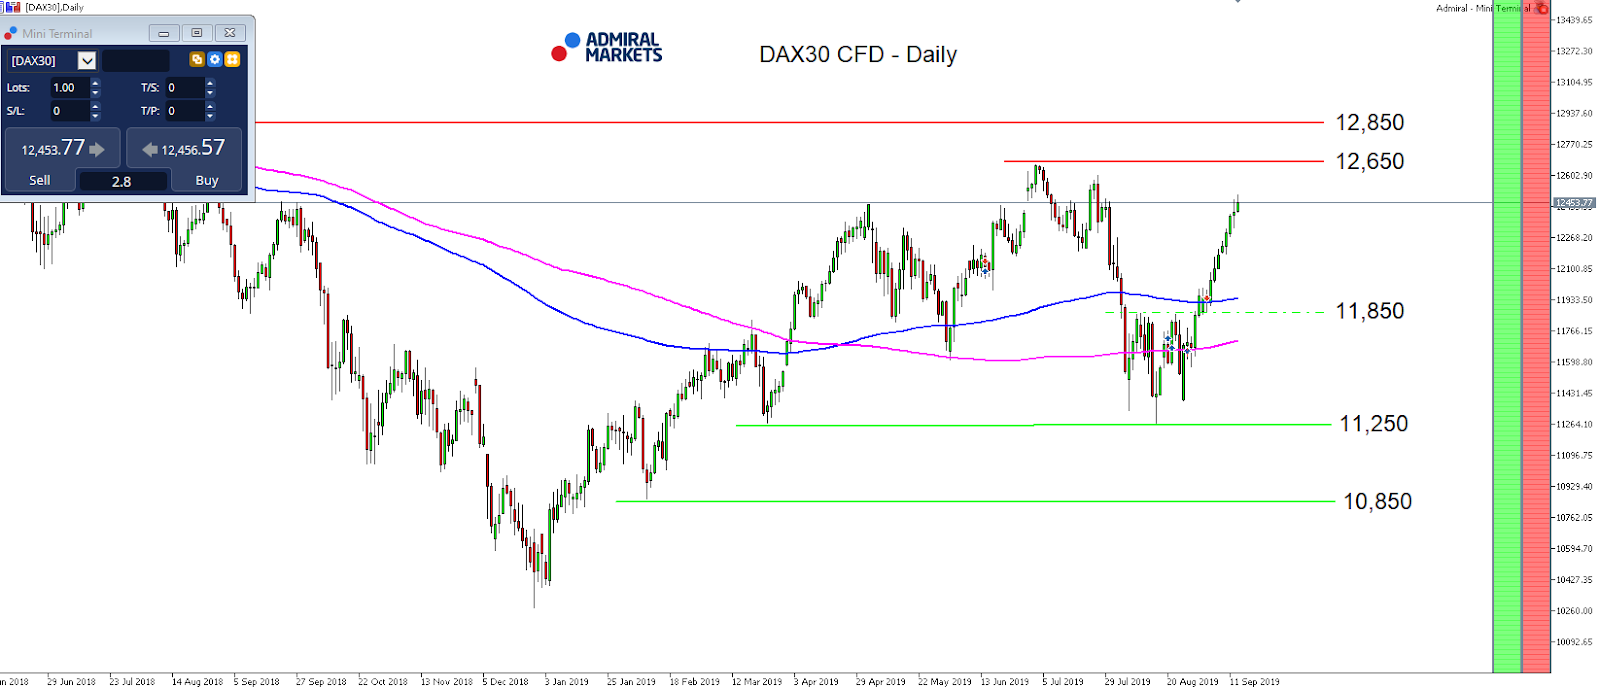
Source: Admiral Markets MT5 with MT5-SE Add-on DAX30 CFD Daily chart (between June 7, 2018, to September 13, 2019). Accessed: September 13, 2019, at 10:00pm GMT – Please note: Past performance is not a reliable indicator of future results, or future performance.
In 2014, the value of the DAX30 CFD increased by 2.65%, in 2015, it increased by 9.56%, in 2016, it increased by 6.87%, in 2017, it increased by 12.51%, in 2018, it fell by 18.26%, meaning that after five years, it was up by 10.5%.
Discover the world’s #1 multi-asset platform
Admiral Markets offers professional traders the ability to trade with a custom, upgraded version of MetaTrader 5, allowing you to experience trading at a significantly higher, more rewarding level. Experience benefits such as the addition of the Market Heat Map, so you can compare various currency pairs to see which ones might be lucrative investments, access real-time trading data, and so much more. Click the banner below to start your FREE download of MT5 Supreme Edition!
Disclaimer: The given data provides additional information regarding all analysis, estimates, prognosis, forecasts or other similar assessments or information (hereinafter “Analysis”) published on the website of Admiral Markets. Before making any investment decisions please pay close attention to the following:
This is a marketing communication. The analysis is published for informative purposes only and are in no way to be construed as investment advice or recommendation. It has not been prepared in accordance with legal requirements designed to promote the independence of investment research, and that it is not subject to any prohibition on dealing ahead of the dissemination of investment research.
Any investment decision is made by each client alone whereas Admiral Markets shall not be responsible for any loss or damage arising from any such decision, whether or not based on the Analysis.
Each of the Analysis is prepared by an independent analyst (Jens Klatt, Professional Trader and Analyst, hereinafter “Author”) based on the Author’s personal estimations.
To ensure that the interests of the clients would be protected and objectivity of the Analysis would not be damaged Admiral Markets has established relevant internal procedures for prevention and management of conflicts of interest.
Whilst every reasonable effort is taken to ensure that all sources of the Analysis are reliable and that all information is presented, as much as possible, in an understandable, timely, precise and complete manner, Admiral Markets does not guarantee the accuracy or completeness of any information contained within the Analysis. The presented figures refer that refer to any past performance is not a reliable indicator of future results.
The contents of the Analysis should not be construed as an express or implied promise, guarantee or implication by Admiral Markets that the client shall profit from the strategies therein or that losses in connection therewith may or shall be limited.
Any kind of previous or modeled performance of financial instruments indicated within the Publication should not be construed as an express or implied promise, guarantee or implication by Admiral Markets for any future performance. The value of the financial instrument may both increase and decrease and the preservation of the asset value is not guaranteed.
The projections included in the Analysis may be subject to additional fees, taxes or other charges, depending on the subject of the Publication. The price list applicable to the services provided by Admiral Markets is publicly available from the website of Admiral Markets.
Leveraged products (including contracts for difference) are speculative in nature and may result in losses or profit. Before you start trading, you should make sure that you understand all the risks.
By Hussein Sayed, Chief Market Strategist (Gulf & MENA), ForexTime
Oil prices surge 20% on Monday open
Drone attack wipes off 5.7 million barrels of Saudi oil production
US administration blames Iran for the attack
This week was supposed to be centered on monetary policy decisions from the US, UK, Japan and Switzerland central banks, Brexit negotiations and developments in US-China trade talks. However, the weekend’s drone attacks on Saudi Arabia’s critical crude processing plant have now taken the spotlight. Such an event may have far more catastrophic consequences on the world economy than any other event which has occurred over the past couple of years.
Oil prices soared 20% as markets reopened to trade near $72 a barrel but gave up half its gains five hours later. The price shock seen today is the largest in almost three decades since Saddam Hussein invaded Kuwait back in the 1990s. Such a reaction in price suggests that we are currently facing an unprecedented threat to oil supplies that could reverberate through the global economy.
What we know so far is that the attack has caused a disruption of 5.7 million barrels a day, which is almost 5% of global oil supply. This makes it the biggest supply shortage shock in history. Now everyone seems to have the same question; when can Aramco return to normal production? Unfortunately, we don’t yet have a decisive answer.
The market has suddenly shifted from being oversupplied to undersupplied, and even if we combine all the spare global capacity available, that won’t make up half the current disruption. However, Saudi Arabia has a significant volume of oil in storage that will keep exports flowing and the US has stated it may even tap into its Strategic Petroleum Reserve if needed. This would soften the damage to some extent, but again it’s all about when production returns back to normal. The longer the disruption goes on, the more damage will be felt.
Three days ago, oil prices hitting $100 a barrel was almost an impossible scenario. Not anymore. That’s not just because of the current disruption from Saudi Arabia, but the fact that the chances of military conflict in the region have risen dramatically. US Secretary of State Mike Pompeo blamed Iran for the drone attacks, and Republican Senator Lindsey Graham said the United States should consider an attack on Iran’s oil refineries. Meanwhile President Trump warned that the US is ‘locked and loaded’. If such statements continue to come out of the US administration, geopolitical risk premium would increase significantly as any strike against Iran may put the whole Gulf region in jeopardy.
If investors begin pricing in the possibility of an attack against Iran’s crude infrastructure, oil may quickly hit the $100 benchmark. Nevertheless, if President Trump reverses course and allows Iran to export its oil, tensions will de-escalate, although currently this doesn’t seem to be the base case scenario. The next couple of days and weeks will be of incredible importance to the global economy and markets, so keep a close eye on further developments.
Disclaimer: The content in this article comprises personal opinions and should not be construed as containing personal and/or other investment advice and/or an offer of and/or solicitation for any transactions in financial instruments and/or a guarantee and/or prediction of future performance. ForexTime (FXTM), its affiliates, agents, directors, officers or employees do not guarantee the accuracy, validity, timeliness or completeness, of any information or data made available and assume no liability as to any loss arising from any investment based on the same.
Dollar weakening intact despite strong retail sales report
US stocks ended marginally lower on Friday despite strong August retail sales report . The S&P 500 slipped 0.1% to 3007.39, extending gains 1% for the week. Dow Jones industrial however rose 0.2% to 27219.52. The Nasdaq slid 0.2%. The dollar weakening continued despite Commerce Department report retail sales grew above expected 4.1% on-year in August. The live dollar index data show the ICE US Dollar index, a measure of the dollar’s strength against a basket of six rival currencies, lost 0.2% to 98.17 and is lower currently. Stock index futures point to lower openings today.
DAX leads European indexes movement
European stocks added to previous session gains on Friday buoyed by the European Central Bank rate cut and resumption of bond purchases. Both EUR/USD and GBP/USD continued climbing Friday with euro rising currently against the dollar while Pound turning lower. The Stoxx Europe 600 Index gained 0.3% led by bank and mining stocks. The DAX 30 rose 0.5% Friday to 12468.53. France’s CAC 40 advanced 0.2% and UK’s FTSE 100 added 0.3% to 7367.46.
Hang Seng leads Asian indexes losses
Asian stock indices are mostly lower today as oil prices rise. Japan’s Nikkei is closed for a holiday as yen advances against the dollar. China’s markets are lower after reports industrial output, retail sales fell short of expectations: the Shanghai Composite Index is down 0.02% and Hong Kong’s Hang Seng Index is 1.0% lower. Australia’s All Ordinaries Index ticked up 0.06% with the Australian dollar’s climb against the greenback intact.
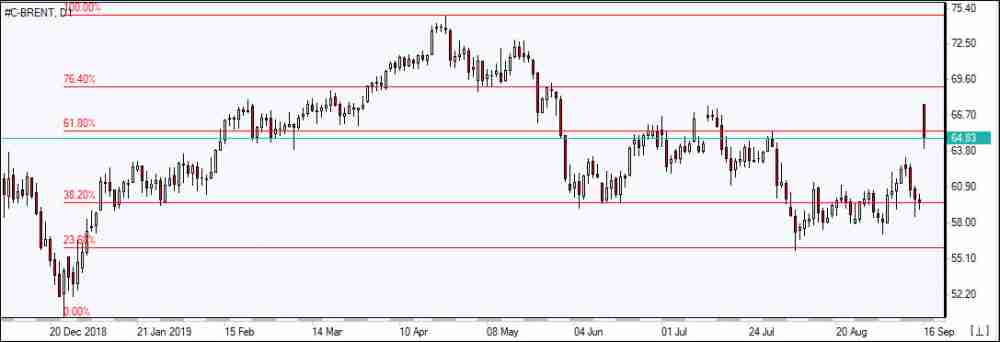
Brent futures prices jumped today after Sunday drone attacks on crude facilities in Saudi Arabia. Prices slipped on Friday: Brent for November settlement ended 0.3% lower at $60.22 a barrel Friday, losing 2.1% for the week.
Note: This overview has an informative and tutorial character and is published for free. All the data, included in the overview, are received from public sources, recognized as more or less reliable. Moreover, there is no guarantee that the indicated information is full and precise. Overviews are not updated. The whole information in each overview, including opinion, indicators, charts and anything else, is provided only for familiarization purposes and is not financial advice or а recommendation. The whole text and its any part, as well as the charts cannot be considered as an offer to make a deal with any asset. IFC Markets and its employees under any circumstances are not liable for any action taken by someone else during or after reading the overview.
By CentralBankNews.info This week – September 15 through September 21 – central banks from 13 countries or jurisdictions are scheduled to decide on monetary policy: Pakistan, the United States, Brazil, Japan, Indonesia, Taiwan, Norway, Switzerland, United Kingdom, South Africa, China, Mongolia and Ghana. Following table includes the name of the country, the date of the next policy decision, the current policy rate, the result of the last policy decision, the change in the policy rate year to date, and the rate one year ago.
The table is updated when the latest decisions are announced and can always accessed by clicking on This Week.
Vietnam’s central bank lowered its key interest rates by 25 basis point for the first time in over two years to support economic growth at a time of a “less favourable” state of the world economy in which many central banks, including the U.S. Federal Reserve and the European Central Bank, have lowered their interest rates.
The State Bank of Vietnam (SBV) cut its benchmark refinancing rate by 25 basis points to 6.0 percent, the rediscount rate to 4.0 percent and the overnight lending rate to 7.0 percent, and the rate on valuable papers offered through open market operations to 4.50 percent.
It was SBV’s first rate cut since July 2017 and the new rates will take effect on Sept. 16, SBV said in a statement from Sept. 13.
The central bank added the economy continues to be stable, inflation is under control and money and foreign exchange markets are stable.
As most other economies worldwide, Vietnam has been affected by the slowdown in global trade and its gross domestic product has slowed slightly to annual growth of 6.7 percent in the second quarter from 6.8 percent in the first quarter and 7.3 percent in the fourth quarter of last year.
In July the International Monetary Fund forecast Vietnam’s economic growth would ease to 6.5 percent this year and 2020 from 7.1 percent in 2018, with activity supported by higher income and consumption by the growing and urbanizing middle class, a strong harvest and manufacturing.
Vietnam’s inflation rate eased to 2.26 percent in August from 2.44 percent in July but the IMF forecast it would average 3.6 percent this year and 3.8 percent next year compared with 3.5 percent in 2018.
Vietnam’s dong has been relatively stable in the last 12 months, trading at 23,249.9 against the U. S. dollar, down 0.3 percent this year.
The explorer recently released early-stage sampling results for its Golden Triangle property that identifies a “significant gold discovery.”
Streetwise Reports caught up with Ian Slater, the CEO of Libero Copper and Gold Corp. (LBC:TSX.V:, LBCMF:OTCQB). Slater is ramping up his international firm’s exploration program at its Big Red property in the Golden Triangle of British Columbia, Canada.
The Golden Triangle is difficult to mine, terrain- and weather-wise, but payoffs for tenacity have been consistent during the past 150 years. The region sports several of Canada’s most lucrative copper-gold mines, including Premier, Red Chris, Snip, Brucejack and Eskay Creek.
There is road access into Big Red, so the harsh winter is the main obstacle to working the areathe weather window is July through October. Big Red is a big patchwork: It covers 20 contiguous claims totaling 26,000 hectares.
Slater is fresh off of raising $3.7 million in a private placement for Libero. The placement found institutional support and was oversubscribed by $1 million. Slater said the expected proceeds are more than enough to finance Big Red exploration and general capital needs for the next two mining seasons in the Golden Triangle.
Slater’s team includes legendary geologist Leo Hathaway of Lumina Gold Corp. At Lumina, Hathaway’s historic discoveries resulted in a $1.6 billion buyout. Slater and Hathaway are pushing to commence the Big Red exploratory drilling program in a few days. They aim to finish the first round of drilling before the heavy snows of October.
“We spent the summer taking continuous rock samples, confirming the results from historical assays, which were gold-laden soil samples that date back to 1963. We took the new samples from the bedrock. Our plan is to start drilling in September; we are waiting for the final permit,” Slater said.
Slater pointed out that his workforce can drive through the wilderness to Big Red on a dirt road, which is a big plus in these rough-hewn mountains. The drive is worthwhile: Past and present surveys show that Libero’s exploration zone is heavy with porphyry copper and gold, epithermal gold and silver and volcanogenic sulfide mineralization.
The centroid of the Big Red targets is a large magnetic-high feature that coincides with a radiometric potassium anomaly, copper, gold and molybdenum anomalies and a mapped Jurassic aged porphyry intrusion. Epithermal gold targets lie to the south and west including the Poker target to the west of the porphyry targets.
On September 5, Libero released results from its early-stage sampling program, announcing a significant new gold discovery at the Copper Bowl target “where five contiguous 50 meter continuous rock chip samples returned intervals of 2.91 grams per tonne gold over 250 meters including 6.14 grams per tonne gold over 100 meters in two contiguous samples.”
The company also noted the sampling “confirmed the anomaly previously compiled from historical sampling campaigns conducted at the Ridge gold target. Continuous rock chip sampling results at the Ridge gold target included 5.14 grams per tonne gold from a single continuous chip sample taken over 50 meters.”
The company plans to target both Ridge and Copper Bowl in its upcoming drill program.
Slater said the newly raised capital will be used to work through the end of the next year’s drilling season. “We will be permitted for 15 drilling pads of multiple years. The lab results should turn around on three-week schedules.” He expects the samples to show mostly gold-copper porphyry. “We are focused on the gold,” he remarked.
“This is the first time that the Big Red project has been consolidated under one operator,” Slater noted. The company has invested in a series of affordable, structured options. “If the exploration does not work out to our liking, we can walk away with minimal losses,” he explained. Libero’s eggs are not all in one carton.
Libero’s business strategy is acquiring “high-quality copper and gold deposits with significant resources but without any fatal flaws or significant holding costs.” It looks for projects with known mineralization, but significant exploration potential. The plan is to sell at a premium when strong markets inspire the hunt for acquisitions, Slater said.
Buy cheap, sell dear fits the Libero’s plan for exploring its Big Red asset, as well as its 49 unpatented claims in the Tomichi deposit in southwestern Colorado.
Tomichi contains an inferred mineral resource of 711 million tons at a grade of 0.33% copper equivalent. Slater says that exploring Tomichi is currently on the backburner. That project awaits a change in market conditions. because the Tomichi metal, while abundant, is relatively low grade compared to the prospects at Big Red and Mocoa.
“There is a lot of metal in the ground, but it is not costing much to hold on to Tomichi until global supplies are reduced and the pricing changes,” Slater noted.
Libero’s “flagship” venture is a higher-grade deposit near the town of Mocoa, Colombia. It contains an inferred resource of 636 million tons at a grade of 0.45% copper equivalent. The deposit is accessible by road and it has an unusual history.
The Mocoa deposit was discovered in 1973 when the United Nations conducted a regional stream geochemical survey. Through 1983, explorers mapped the geology, did surface sampling and ground geophysics (IP, magnetics). It sank 31 diamond drill holes totaling 18,321 meters, resulting in promising, if preliminary metallurgical test work.
Four drill core composites, representing different rock and ore types, and a bulk composite of all these samples were processed at Dawson Metallurgical Laboratories in Murray, Utah. Standard grinding and flotation tests were completed. A bulk copper-molybdenum flotation concentrate was processed to produce copper and molybdenum concentrates.
According to contemporaneous reports, the copper concentrate has a grade of 24.2% Cu with a recovery of 85.9% and the molybdenum concentrate has a grade of 55.14% Mo with a recovery of 82.7%. Both concentrates are clean with no deleterious elements.
Majors have been circling Mocoa from afar, waiting for the juniors to strike. In 2008 and 2012, B2Gold executed diamond drill programs at Mocoa. Slater acquired the deposit from B2Gold Corp. (BTG:NYSE; BTO:TSX; B2G:NSX) in return for a 19% stake in Libero.
Disclosure: 1) Peter Byrne compiled this article for Streetwise Reports LLC and provides services to Streetwise Reports as an independent contractor. He or members of his household own securities of the following companies mentioned in the article: None. He or members of his household are paid by the following companies mentioned in this article: None. 2) The following companies mentioned in this article are billboard sponsors of Streetwise Reports: None. Click here for important disclosures about sponsor fees. As of the date of this article, an affiliate of Streetwise Reports has a consulting relationship with Libero Copper and Gold Corp. Please click <href=”#consulting” target=”_blank”>here for more information. Within the last six months, an affiliate of Streetwise Reports has disseminated information about the private placement of the following companies mentioned in this article: Libero Copper and Gold Corp. 3) Comments and opinions expressed are those of the specific experts and not of Streetwise Reports or its officers. The information provided above is for informational purposes only and is not a recommendation to buy or sell any security. 4) The article does not constitute investment advice. Each reader is encouraged to consult with his or her individual financial professional and any action a reader takes as a result of information presented here is his or her own responsibility. By opening this page, each reader accepts and agrees to Streetwise Reports’ terms of use and full legal disclaimer. This article is not a solicitation for investment. Streetwise Reports does not render general or specific investment advice and the information on Streetwise Reports should not be considered a recommendation to buy or sell any security. Streetwise Reports does not endorse or recommend the business, products, services or securities of any company mentioned on Streetwise Reports. 5) From time to time, Streetwise Reports LLC and its directors, officers, employees or members of their families, as well as persons interviewed for articles and interviews on the site, may have a long or short position in securities mentioned. Directors, officers, employees or members of their immediate families are prohibited from making purchases and/or sales of those securities in the open market or otherwise from the time of the interview or the decision to write an article until three business days after the publication of the interview or article. The foregoing prohibition does not apply to articles that in substance only restate previously published company releases. As of the date of this interview, officers and/or employees of Streetwise Reports LLC (including members of their household) own securities of Libero Copper and Gold Corp., a company mentioned in this article.
By Jameel Ahmad, Global Head of Currency Strategy and Market Research at FXTM, ForexTime
The breaking development that transpired throughout the weekend, where attacks on Aramco Oil plants in Saudi Arabia could take away up to 5.7 million barrels per day from the Kingdom’s production has led to a flurry of views that the Oil price could spike as high as $100 over the coming weeks.
This view is encouraged by concerns that the attacks on Oil plants might provoke an intense escalation in a region that is already sensitive to geopolitics, but it is still not clear what caused these fires and how this happened, before deciding into a portfolio what impact this could have on valuations.
US WTI concluded the week just below $55 and to expect a move to $100 from here is ambitious, though confirmation that it will take weeks, and not days to replace this removal of Saudi production can encourage a move to $60.
Looking at the technicals on the Daily charts, Oil prices have suffered more than 3 days of successive declines and found short-term support at $54. As long as prices do not fall below $54 we can look for a rebound from recent declines.
Disclaimer: The content in this article comprises personal opinions and should not be construed as containing personal and/or other investment advice and/or an offer of and/or solicitation for any transactions in financial instruments and/or a guarantee and/or prediction of future performance. ForexTime (FXTM), its affiliates, agents, directors, officers or employees do not guarantee the accuracy, validity, timeliness or completeness, of any information or data made available and assume no liability as to any loss arising from any investment based on the same.


 Source: Admiral Markets MT5 with MT5-SE Add-on DAX30 CFD Daily chart (between June 7, 2018, to September 13, 2019). Accessed: September 13, 2019, at 10:00pm GMT – Please note: Past performance is not a reliable indicator of future results, or future performance.