Euro-zone private sector activity decline bearish for EURUSD
Markit’s composite Index for euro-zone fell in September to 50.1 from 51.9. Will the EURUSD decline?
The price chart on 1-hour timeframe shows EURUSD: H1 is in uptrend. The price is testing the 200-period moving average MA(200) which is falling. And the RSI is above 50 level and hasn’t reached the overbought zone yet.
The US dollar continues to weaken against a basket of world currencies. The dollar index (#DX) has updated local lows again and closed the trading session in the red zone. Investors are concerned about the impact of the trade war between Washington and Beijing on the state of the economy. Earlier, the US reported a sharp decline in economic activity in the country’s manufacturing sector. Labor statistics from ADP were negative. Financial market participants are also worried about the uncertainty concerning Brexit and the growing risks of impeachment by US President Donald Trump. These events support the demand for safe assets.
Today, weak data on economic activity in the Eurozone and the UK were published. In September, Markit composite PMI in the Eurozone fell from 51.9 to 50.1. The composite index on economic activity in the UK slowed down from 50.2 to 49.3. Investors expect the release of important statistics on the US economy. These releases may have a significant impact on the dynamics of currency majors in the short term.
The “black gold” prices continue to show negative dynamics. Currently, futures for the WTI crude oil are testing the $52.50 mark per barrel.
Market Indicators
Yesterday, aggressive sales were observed in the US stock markets: #SPY (-1.77%), #DIA (-1.80%), #QQQ (-1.72%).
The 10-year US government bonds yield shows negative dynamics. At the moment, the indicator is at the level of 1.57-1.58%.
The Economic News Feed for 03.10.2019:
– Initial jobless claims in the US at 15:30 (GMT+3:00);
By Hussein Sayed, Chief Market Strategist (Gulf & MENA), ForexTime
Dow Jones wipes off more than 800 points in two days US indices fell below the 50 and 100-days moving averages US to open new trade war with Europe
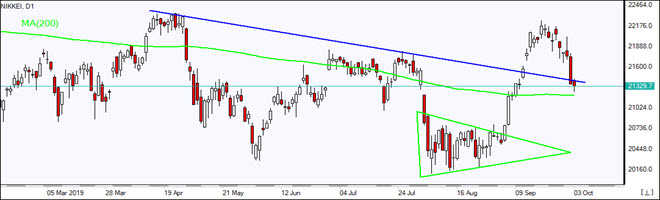
Global equity markets fell sharply on Wednesday with the Dow Jones Industrial Average declining 494 points bringing its two-day decline to more than 800 points. On the other side of the Atlantic, the UK’s FTSE 100 fell 3.2%, making it the steepest one-day decline since January 2016. Meanwhile, the Nikkei 225 in Japan and ASX in Australia both dropped more than 2% today.
Traders driven by quantitative strategies are also seeing an ugly picture with all US three major indices falling below their 50 and 100-day moving averages, which is usually interpreted as a negative indicator going forward.
Bonds have been in strong demand so fixed-income investors, who have spent almost one-year accumulating positions in their portfolios, have been waiting for this moment, although as usual, the sell-off in stocks has been later than anticipated.
The Trigger
The selloff kicked off on Tuesday after US ISM Manufacturing PMI showed activity fell to the lowest level in a decade. It then accelerated after the ADP jobs report indicated that the pace of hiring is slowing. Reports that the US will open a new front in its trade war with Europe after WTO ruling also rubbed salt into the wound. While it’s too early to conclude that last year’s fourth quarter turmoil which led to a 19% decline in the S&P 500 will repeat itself, the list of risks continues to grow.
Trump blames the Fed and Democrats
President Trump was fast to blame the Fed Chair Jerome Powell on falling manufacturing activity, calling the Fed “pathetic”. A day later he accused the Democrats impeachment inquiry of being responsible for the market sell-off. For Trump, he always associates the rise in equity markets with his policies, but never the losses.
In behavioral finance, that’s what we call Self-Attribution bias. This bias refers to an individuals’ tendency to attribute successes to personal skills and failures to factors beyond their control. While it’s true that US equities have benefited mostly from tax reforms over the past two years, “thanks to President Trump”, it’s now not the impeachment inquiry nor the Fed driving equities lower, but the trade war which has been driven by President Trump himself.
That’s why next week’s US-China trade talks will be of extreme importance to financial markets. A resolution or interim deal is needed to prevent further turmoil.
More US data
Before the Sino-American trade talks resume, investors will be cautiously monitoring upcoming US data. The key economic figures to look at are today’s ISM non-manufacturing number and tomorrow’s non-farm payrolls. If the contraction in manufacturing activity translates to weakness in the far larger services sector, then it’s time to get seriously worried. As we know the main driver of the American economy is its consumer, and two-thirds of consumer spending is on services, such as housing and healthcare. Any cracks in that sector suggest the US economy is getting closer to falling into recession.
Disclaimer: The content in this article comprises personal opinions and should not be construed as containing personal and/or other investment advice and/or an offer of and/or solicitation for any transactions in financial instruments and/or a guarantee and/or prediction of future performance. ForexTime (FXTM), its affiliates, agents, directors, officers or employees do not guarantee the accuracy, validity, timeliness or completeness, of any information or data made available and assume no liability as to any loss arising from any investment based on the same.
On Wednesday the 2nd of October, trading on the euro closed up at 1.0959. The euro’s rise was helped along by weak US data. The ADP employment report missed expectations, along with the ISM manufacturing index for September, which dropped from 49.1 to 47.8.
The index fell over investor fears of an economic slowdown. US shares dropped in response to a decline in US bond yields. US10Y bond yields dropped to 1.5824%.
Day’s news (GMT+3):
10:50 France: Markit services PMI (Sep).
10:55 Germany: Markit services PMI (Sep).
11:00 Eurozone: Markit services PMI (Sep).
11:30 UK: Markit services PMI (Sep).
12:00 Eurozone: PPI (Aug), retail sales (Aug).
15:30 US: initial jobless claims (27 Sep).
16:45 US: Markit services PMI (Sep).
17:00 US: ISM non-manufacturing PMI (Sep), factory orders (Aug).
Current situation:
On Wednesday, just as on Tuesday, the EURUSD pair reversed upwards on the back of US data. The volume gap from the 30th of September and 1st of October was filled. For the bulls, the road towards 1.10 is now open. The pair has exited the channel and the bulls are now dominating the hourly timeframe. The only thing that can stop them now is Friday’s NFP report. There’s a support at 1.0922. Let’s also not forget that there’s a lot of conflicting background noise (Brexit, US tariffs on European goods, loose ECB monetary policy, and the broadly weaker US dollar). Any of these could cause a sharp reversal.
We’re forecasting sideways movement ahead of the release of the NFP report. Since the manufacturing PMI fell short of expectations, reaction to the NFP will be strong. This means that markets need to prepare for it. The ISM non-manufacturing index for September is coming out at 17:00. The service industry has a bigger influence on the market than the manufacturing sector.
US stocks booked sharp back to back loses on Wednesday as weak new job creation data further undermined investor confidence already shaken by weak ISM report previous day. The S&P 500 fell 1.8% to 2887.61. The Dow Jones industrial average dropped 1.9% to 26078. Nasdaq lost 1.6% to 7785.25. The dollar weakening continued after private sector payrolls processing firm Automatic Data Processing report showed US added 135,000 new jobs in September, as average monthly job growth for the past three months fell to 145,000 from 214,000 for the same time period last year. The live dollar index data show the ICE US Dollar index, a measure of the dollar’s strength against a basket of six rival currencies, fell 0.16% to 99.02 but is higher currently. Stock index futures point to higher openings today.
FTSE 100 leads European indexes losses
European stocks retreat widened on Wednesday as Washington announced it will impose tariffs on $7.5 billion worth of European imports beginning October 18 following World Trade Organization ruling the United States could impose the tariffs as retaliation for illegal European Union aid to Airbus. GBP/USD joined EUR/USD’s continuing climb yesterday with both lower currently. The Stoxx Europe 600 lost 2.7%. Germany’s DAX 30 fell 2.8% to 11925.25 as several forecasters including the Ifo Institute, DIW, IfW, IWH and RWI cut their economic forecasts for Germany. France’s CAC 40 tumbled 3.1% and UK’s FTSE 100 dropped 3.2% to 7122.54.
Australia’s All Ordinaries Index still loss leader among Asian indexes
Asian stock indices are mostly lower today after sharp losses on Wall Street overnight. Nikkei fell 2% to 21341.74 despite yen resumed slide against the dollar. Hong Kong’s Hang Seng Index is 0.2% higher. Australia’s All Ordinaries Index losses deepened to 2.2% with Australian dollar continuing its climb against the greenback.
Brent futures prices are stable today. Prices fell yesterday after Energy Information Administration report US crude inventories rose a third week in a row by 3.1 million barrels, while gasoline inventories fell by 0.2 million barrels. December Brent crude dropped 2% to $57.69 a barrel on Wednesday.
Note: This overview has an informative and tutorial character and is published for free. All the data, included in the overview, are received from public sources, recognized as more or less reliable. Moreover, there is no guarantee that the indicated information is full and precise. Overviews are not updated. The whole information in each overview, including opinion, indicators, charts and anything else, is provided only for familiarization purposes and is not financial advice or а recommendation. The whole text and its any part, as well as the charts cannot be considered as an offer to make a deal with any asset. IFC Markets and its employees under any circumstances are not liable for any action taken by someone else during or after reading the overview.
Teekay Offshore Partners shares are trading more than 30% higher today on news that Brookfield Business Partners will be purchasing all un-owned common units of the firm for $1.55 per share.
This morning Hamilton, Bermuda based Teekay Offshore Partners L.P. (TOO:NYSE) announced that it has entered into an agreement and plan of merger with Brookfield Business Partners L.P. (BBU:NYSE) and certain of its affiliates and institutional partners (the “Consortium”). According to the merger agreement, the Brookfield Consortium will acquire by merger all of the outstanding publicly held common units representing limited partner interests of the Partnership not already held by the Brookfield Consortium in exchange for $1.55 in cash per common unit. The cash consideration represents an increase of $0.39 (33.6%) to the $1.16 closing price per common unit on September 30, 2019. As an alternative to receiving the cash consideration, each unaffiliated unitholder will have the option to elect to receive one newly designated unlisted Class A Common Unit of the Partnership per common unit, but those units will have limited voting rights and limited transferability.
The merger is expected to close in Q4/19 subject to satisfaction of certain customary conditions. Upon the closing of the merger, the common units will cease to be publicly traded. The Partnership will continue to file certain reports with the Securities and Exchange Commission following the closing of the merger.
Teekay Offshore explains that it will deliver election materials to the unaffiliated unitholders that will include a description of the terms of the Class A Common Units and instructions for electing to receive the equity consideration. Unitholders who do not elect to receive the equity consideration prior to the election date set forth in the election materials will receive the cash consideration. Pursuant to the terms of the Merger Agreement, the Partnership’s outstanding preferred units will be unchanged and remain outstanding by virtue of the merger.
The conflicts committee, composed of non-executive, independent directors of the board of directors of the Partnership’s general partner unanimously approved the Merger Agreement and determined that the transaction contemplated thereby was advisable and in the best interests of the Partnership and the unaffiliated unitholders. The members of the Board have unanimously approved the Merger Agreement on the recommendation of the Conflicts Committee. Neither the Conflicts Committee nor the Board are “making any recommendation whether an unaffiliated unitholder should elect the unit option nor did they evaluate the terms of the equity consideration in determining whether to approve the Merger Consideration,” the company noted.
Teekay Offshore advises that it is a “leading international midstream services provider to the offshore oil production industry, primarily focused on the ownership and operation of critical infrastructure assets in offshore oil regions of the North Sea, Brazil and the East Coast of Canada. Teekay has consolidated assets of approximately $5.2 billion, comprised of 58 offshore assets, including floating production, storage and offloading units, shuttle tankers, floating storage and offtake units, long-distance towing and offshore installation vessels, and a unit for maintenance and safety.”
Brookfield Business Partners lists that it is a business services and industrials company focused on owning and operating high-quality businesses that benefit from barriers to entry and/or low production costs. The firm provides business services including construction management and contracting services; residential real estate, logistics and financial services; energy operations including oil and gas production; and industrial operations which include select manufacturing and mining operations. The firm states that it is the flagship listed business services and industrials company of Brookfield Asset Management Inc. (BAM:NYSE; BAM.A:TSX), which it indicates is a leading global alternative asset manager with more than $385 billion of assets under management.
Teekay Offshore Partners began the day with a market capitalization of about $476.4 million. The company has 410.7 million common shares (units) outstanding. The stock has a 52-week price range of $1.03-2.45/share. This morning, TOO shares opened at $1.54 (+$0.38, +32.76%) over yesterday’s $1.16 closing price. The stock has traded today between $1.53 and $1.54/share on very high volume and presently is trading at $1.53 ((+0.38, 33.04%).
Disclosure: 1) Stephen Hytha compiled this article for Streetwise Reports LLC and provides services to Streetwise Reports as an independent contractor. He or members of his household own securities of the following companies mentioned in the article: None. He or members of his household are paid by the following companies mentioned in this article: None. 2) The following companies mentioned in this article are billboard sponsors of Streetwise Reports: None. Click here for important disclosures about sponsor fees. 3) Comments and opinions expressed are those of the specific experts and not of Streetwise Reports or its officers. The information provided above is for informational purposes only and is not a recommendation to buy or sell any security. 4) The article does not constitute investment advice. Each reader is encouraged to consult with his or her individual financial professional and any action a reader takes as a result of information presented here is his or her own responsibility. By opening this page, each reader accepts and agrees to Streetwise Reports’ terms of use and full legal disclaimer. This article is not a solicitation for investment. Streetwise Reports does not render general or specific investment advice and the information on Streetwise Reports should not be considered a recommendation to buy or sell any security. Streetwise Reports does not endorse or recommend the business, products, services or securities of any company mentioned on Streetwise Reports. 5) From time to time, Streetwise Reports LLC and its directors, officers, employees or members of their families, as well as persons interviewed for articles and interviews on the site, may have a long or short position in securities mentioned. Directors, officers, employees or members of their immediate families are prohibited from making purchases and/or sales of those securities in the open market or otherwise from the time of the interview or the decision to write an article until three business days after the publication of the interview or article. The foregoing prohibition does not apply to articles that in substance only restate previously published company releases.
Bob Moriarty of 321 Gold explains why he has been buying shares of this gold explorer with a project in Quebec.
I have been pounding the table for months believing we would have a general stock market high in September leading into a giant crash starting in October. And I believed there would be a liquidity event that would blast hell out of the “Everything Bubble.”
It’s here. I also suggested investors in resources get liquid in anticipation of shares going on the sales table by investors dumping at any price as the margin clerks began to call. I think that is here as well and I did my best to lighten up to free up some cash. Gold and silver have been correcting for the best part of a month and they are not finished yet.
I do hope my readers understand the concept of leverage. If you are given the alternative of buying into either of two mining companies, one that can produce at $800 gold and one that would require $1200 gold. If you think gold is going to stay steady or go down, buy the company with the $800 gold. But on the other hand if you think gold is going a lot higher, buy the one with $1200 gold. You get far better leverage. A $200 move in gold makes them far more valuable than with the $800 an ounce producer.
Maple Gold is in the heart of Quebec with a 3.25 million ounce gold resource. An updated 43-101 is due this quarter. Over the life of the project more than $60 million CAD has been spent on drilling including a 6,000-meter drill program this year.
The President and CEO is Matthew Hornor who was VP for Ivanhoe for ten years. The management team largely is from Ivanhoe and highly experienced.
I could go more into the specifics of the company but they have done a fine job on the presentation and anyone interested should read it carefully. It’s right up to date. As of the 30th of June, the company had $4.4 million over their obligations but since then cash has gone down to about $3.5 million CAD.
While I was searching around for a hook to do a story on, I casually looked at the price of the shares. I had bought some at $0.095 and was thrilled to get them. Yesterday I watched the price go down to $0.07. Remember, this was a $0.46 stock less than three years ago. The only things that have changed have changed for the better but bored shareholders have tanked the stock by 85%. I leapt on a bunch of shares at $0.07 because I can both add and subtract.
Yesterday the company had about a $16 million market cap with $3.5 million in the till. Convert to USD for simplicity, that’s $13 million CAD enterprise value and $9.8 million USD with 3.25 million ounces. That is within spitting distance of $3 an ounce USD.
If you even like gold, you are never going to see a better deal than gold at $3 an ounce. There are only two things that can possibly happen. Gold goes to zero and “Bitcon” takes over the world, or we go into QE infinity and gold goes a lot higher.
Look for a lot higher gold. And a lot higher Maple Gold Mines shares. Management’s only error has been to hide their light under a bushel. They need to let it shine.
Maple is an advertiser. I own a bunch of shares bought in the open market. Naturally I am biased so do your own due diligence. I share neither your profit nor your losses.
Maple Gold Mines MGM-V $0.075 (Oct 01, 2019) MGMLF-OTCBB 237.4 million shares Maple Gold website.
Bob and Barb Moriarty brought 321gold.com to the Internet almost 16 years ago. They later added 321energy.com to cover oil, natural gas, gasoline, coal, solar, wind and nuclear energy. Both sites feature articles, editorial opinions, pricing figures and updates on current events affecting both sectors. Previously, Moriarty was a Marine F-4B and O-1 pilot with more than 832 missions in Vietnam. He holds 14 international aviation records.
Disclosure: 1) Bob Moriarty: I, or members of my immediate household or family, own shares of the following companies mentioned in this article: Maple Gold Mines. Maple Gold Mines is an advertiser on 321 Gold. I determined which companies would be included in this article based on my research and understanding of the sector. 2) The following companies mentioned are billboard sponsors of Streetwise Reports: None. Click here for important disclosures about sponsor fees. 3) Statements and opinions expressed are the opinions of the author and not of Streetwise Reports or its officers. The author is wholly responsible for the validity of the statements. The author was not paid by Streetwise Reports for this article. Streetwise Reports was not paid by the author to publish or syndicate this article. The information provided above is for informational purposes only and is not a recommendation to buy or sell any security. Streetwise Reports requires contributing authors to disclose any shareholdings in, or economic relationships with, companies that they write about. Streetwise Reports relies upon the authors to accurately provide this information and Streetwise Reports has no means of verifying its accuracy. 4) The article does not constitute investment advice. Each reader is encouraged to consult with his or her individual financial professional and any action a reader takes as a result of information presented here is his or her own responsibility. By opening this page, each reader accepts and agrees to Streetwise Reports’ terms of use and full legal disclaimer. This article is not a solicitation for investment. Streetwise Reports does not render general or specific investment advice and the information on Streetwise Reports should not be considered a recommendation to buy or sell any security. Streetwise Reports does not endorse or recommend the business, products, services or securities of any company mentioned on Streetwise Reports. 5) From time to time, Streetwise Reports LLC and its directors, officers, employees or members of their families, as well as persons interviewed for articles and interviews on the site, may have a long or short position in securities mentioned. Directors, officers, employees or members of their immediate families are prohibited from making purchases and/or sales of those securities in the open market or otherwise from the time of the interview or the decision to write an article, until one week after the publication of the interview or article.
Rudi Fronk and Jim Anthony, cofounders of Seabridge Gold, discuss recession, central bank panic and an outrageous gold price.
In our view, gold investors should settle back with some popcorn and enjoy the coming fireworks, which will include the best gold bull market ever, with all the volatility that implies. We see new all-time highs just around the corner. The challenge is to take a position and stay the course. Central banks are about to pay for decades of bad policy and gold will reap the dividends.
Let’s be clear about one thing: the global economy is falling into a deep recession but it is NOT due to the U.S.-China trade war, and a resolution of that war, no matter what it is, will not avoid the inevitable. Inverted yield curves and an historic collapse in bond yields are the clearest message that markets can send on the economic outlook. The trade war does not explain why Europe and Japan have been on the brink of recession for more than a year. Nor will central bank easing prevent a recession when monetary conditions are already the loosest in 25 years. Central bank monetary policy is part of the problem, not the solution. In our view, the economy and the stock market are not going to be saved by trade deals and monetary policy.
The problem is the debt way too much of it, mostly unproductive and at ultra-low interest rates. In a recession, this is extraordinarily precarious, especially the hugely inflated corporate debt. Profits are stagnant, margins are falling, balance sheet cash ratios are severely depleted and liquidity in the corporate bond market is already shockingly poor. Why do you think the three top bond fund managers (DoubleLine, PIMCO and Guggenheim) say they are avoiding corporate debt in their portfolios? The debt is the problem, the reason why economic recovery since the Great Recession has been the weakest on record, the reason why the Fed has failed to ignite the inflation it has so badly wanted and the reason why every central bank on the planet is now aggressively looking to prevent an economic slowdown any way they can.
A recession now means a vicious debt deflation: a collapse in new lending, refusals to roll over debt, an inability of borrowers to pay higher rates, soaring bankruptcies and much higher unemployment. Central banks want anything but that. So we are going to see more negative interest rates, more QE and more central bank monetization of sovereign and corporate debt. In a choice between stable currencies and avoidance of a debt deflation, central banks will weaken their currencies. Therefore, the title of this article: Will we get inflation (as currencies are intentionally devalued) or deflation or both at once? We don’t pretend to know. Gold, as the only universally accepted instrument of final settlement and as a physical element in the Periodic Table that cannot be printed, does not care.
The inherent conflicts and confusion in central bank policy will now be exposed. They want more lending. Please do not choke on your popcorn when ZIRP (zero interest rate policy) and NIRP (negative interest rate policy) destroy the incentive to lend, hollow out bank liabilities (why let them keep your cash?) and generally make banking a bad business. As a gold investor, you can cheer on a falling LIBOR, which could eventually collapse the term structure in the futures market and bring all demand for gold (and commodities?) into the spot market where only the real physical item will do.
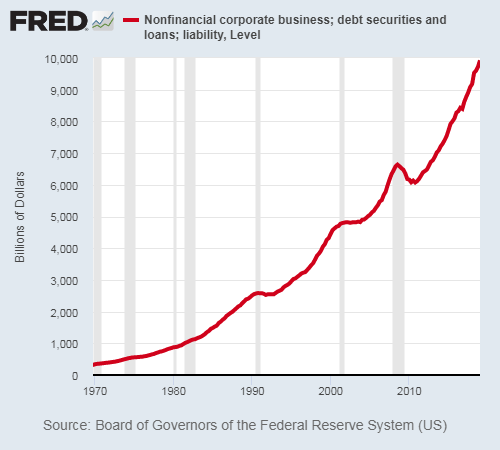
The Corporate Debt Bubble
U.S. nonfinancial corporate debt of large companies now stands at about $10 trillion, 48% of GDP. This represents a rise of 52% from its last peak in the third quarter of 2008 when corporate debt was at $6.6 trillion, about 44% of 2008 GDP.
Total corporate debt is actually much higher. The debt of small and medium-sized enterprises, family businesses and other companies not listed on stock exchanges ads another $5.5 trillion, bringing total U.S. corporate debt to $15.5 trillion, 74% of U.S. GDP. The International Institute of Finance in its Global Debt Monitor has an “amber light for the U.S. corporate sector.”
Earnings are not keeping pace. The latest GDP revisions show U.S. operating profits fell $93 billion (4.4%) in 2017 and a whopping $188 billion (8.3%) in 2018. Operating earnings screen out the effect of tax changes, financial engineering and buybacks. The stock market is up 50% over the last five years but GDP data shows no growth in corporate operating profits over the past five years. The Q2 report says profits totalled $1.9 billion, down 7% from a year ago. Meanwhile, 60% of S&P companies have cut Q3 EPS expectations in recent weeks but distributions to shareholders continue at record levels 37% of capital is going to Capex & R&D while 47% goes to buybacks and dividends, which do not strengthen ability to meet debt obligations.
Cash held by U.S. non-financial corporations fell $272 billion over the last 12 months, the largest decline (-15%) since at least 1980. As a percentage of assets, cash balances have declined from 12.7% in June 2018 to 10.4% today. Jeffrey Gundlach of DoubleLine notes that using leverage ratios alone “45%, not just of the BBB but the entire corporate bond market, would be junk right now.”
The Federal Reserve’s Real Job 1
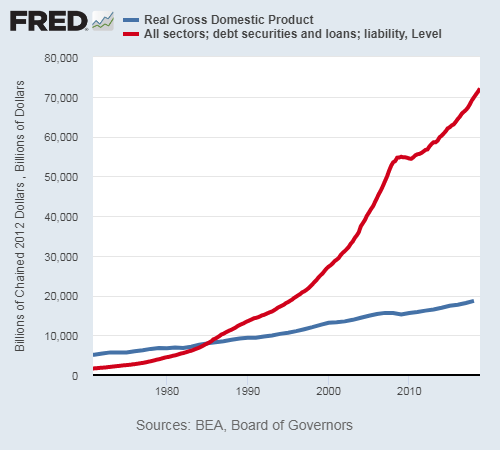
Let’s look at the bigger picture. U.S. credit market debt now exceeds $72 trillion, which is secured against an economy of just $18.8 trillion. Assuming an average interest rate of 3% (likely too low), the debt eats $2.2 trillion per year…11.5% of real GDP. That’s why economic growth after the Great Recession has been so poor…the economy is choking on too much debt. And that is why the Fed’s one and only policy…growing the economy by growing the debt…is unsustainable. In 1984 it took $1 of additional debt to create an additional $1 of Real GDP. As of the fourth quarter of 2018, it took $3.8 dollars of debt to create $1 of real GDP.
The debt load is growing more than three times faster than the ability of the economy to service it, as the below chart shows. How is this sustainable?
To keep rolling over expiring debt and accrued interest and to finance massive government deficits, which at the federal level are now verging on $1 trillion per year without a recession, total debt must increase at least $3 trillion per year. This is no small task. Banks have to be willing to lend and borrowers have to be willing to take on more liabilities despite already high debt loads.
Perhaps you think that the Fed’s priorities are defined by its official mandate…price stability and full employment. Or, if you have been following the news, you may add the third mandate which has emerged in Chairman Powell’s statements…continuing the current economic expansion. But there is one more mandate that eclipses all the rest…maintaining the current debt bubble. If the Fed fails in this regard, all the other mandates go down the drain.
For the Fed, this is job 1… keep the debt growing. Once debt begins to contract, the game ends in a massive wave of defaults. The Great Recession of 2008/9 was caused by a small contraction in debt growth…actually more a flattening of the growth curve (see chart above). The Fed CANNOT let that happen again with debt now 32% higher.
The U.S. economy, corporate and individual, has been restructured around ZIRP. When the Fed Funds Rate hit 2.5% and the10-year Treasury yield hit a modest 3.2%, markets went tilt last year. The U.S. Federal Debt absolutely cannot handle higher rates either. Interest rates cannot be allowed to rise, dear reader. The Fed will stop at nothing to keep rates low and real yields even lower which supports a huge bid under gold.
How dependent on debt is the U.S. economy? Do you have your popcorn in hand? “Nominal GDP growth over the past five years would have been negative if U.S. public debt had not increased,” says DoubleLine’s Jeffrey Gundlach. “The growth in the GDP is really based exclusively on debt, government debt, also corporate debt and even now some growth in mortgage debt.”
If the U.S. Treasury had avoided increasing its debt, nominal GDP would have been negative in three of the last five years “even with all of the exact mortgage, corporate, and student loan growth that occurred,” Gundlach told Reuters in an email. “If those non-Treasury debt categories had not grown either, GDP would have been very negative.” Nominal GDP rose by 4.3% (annually) but total public debt rose by 4.7% over the past five years, Gundlach noted. Does this sound to you like a strong, recession-proof economy?
Negative Rates Are Positive for Gold
All central banks globally are thinking the same way. Central banks recorded a net 14 rate cuts in August, the most since policymakers dropped rates to zero after the global crash in 2008/09. August marked the seventh straight month of net rate cuts following a tightening cycle that ended in early 2019.
In our view, rate cuts aren’t likely to induce enough new private lending/borrowing to keep the debt bubble expanding, especially as the economy is clearly slowing down. More QE will be necessary to drive yields lower and perhaps even more aggressive policies, even in the U.S.
Do you think otherwise? Former Federal Reserve Chairman Alan Greenspan recently said he wouldn’t be surprised if yields on U.S. bonds turned negative and if they do, it wouldn’t be “that big a of a deal.” We disagree and so does the gold price, the best market indicator of rising risk aversion.
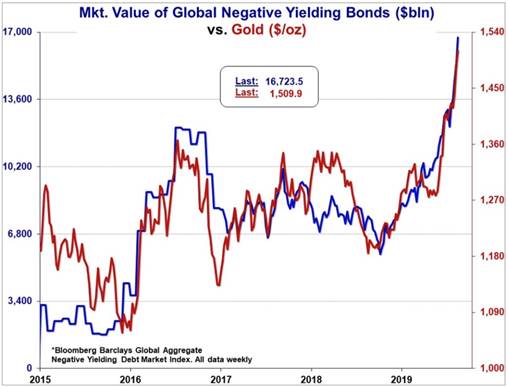
Gold’s accelerating performance since October 2018 is due in part to global rate structures crashing below the zero bound. The global total of negative yielding sovereign credit has literally skyrocketed in recent weeks to a more than $17 trillion, triple the $5.7 trillion in October 2018. Note that there were no negative-yielding bonds during the first 5,000 years of financial history until the Bank of Japan started the game in 2015. The below chart should be profoundly disturbing to central bankers who want investors to take on more risk.
In September, sovereign debt yields bounced higher and total outstanding negative yielding debt temporarily fell, not surprising given that we had just seen the most overbought weekly bond RSI readings in history. But none of the risk factors that have recently driven sovereign yields to historic lows have dissipated and a terrorist attack on the world’s largest oil terminal brought a powerful bid back into Treasuries, reaffirming the trend towards risk aversion.
Negative interest rates are not confined to sovereign bonds nor do we think the Fed will limit its experiments to the bond market. NIRP also means charging commercial banks to deposit their funds with their central bank, which, in turn, means banks charging interest to their depositors.
In Europe, this form of NIRP was supposed to increase spending, boost inflation and stimulate the economy. According to research from the University of Bath (among others), NIRP actually decreased lending because the additional costs reduced banks’ profit margins, leading to a drop in loan growth.
“This is a good example of unintended consequences,” said Dr. Ru Xie of the university’s School of Management, one of the study’s authors. “Negative interest rate policy has backfired, particularly in an environment where banks are already struggling with profitability.”
But the biggest impact of negative rates may involve time preference that lies at the heart of the financial system. Assume that you have a certain sum of cash. All things equal, you would prefer to hold the cash or spend it now to meet your needs. To lend this cash, you need an inducement, a payment of interest, which compensates you for the deferred pleasure of holding or spending your cash, an amount sufficient to overcome loss of liquidity, risk of default and sacrifice of immediate satisfaction.
Central banks think that driving interest rates below zero will force you to spend now and borrow to spend more. Goodbye savings and investment, the prime source of future economic growth, better credit ratings and stable balance sheets. We think one of the reasons why the U.S. economy remains stronger than the rest is because it has positive yields.
There is another dimension to time preference. The futures markets exist because of the preference of most investors to hold dollars, the world’s reserve currency. If I purchase a gold futures contract, I am stating my preference to hold dollars (which pay interest and have perfect liquidity) while also owning a future call on gold. I value dollars more than gold, otherwise I would buy gold in the spot market. This preference creates contango, which reflects the interest rate paid on dollars and the pre-eminent position of the dollar compared to the euro, yen or yuan.
But if LIBOR heads to zero under ZIRP, why would I prefer to own dollars? As rates fall, the preference will shift to physical gold until we reach permanent backwardation. The futures market would collapse, leaving us with only the spot market for physical and fully backed certificates. In London, where it is said that 95% of all gold deposits are unallocated, there would be tremendous pressure to take possession of physical, leading to exposure of just how much fractional gold banking has been going on for the last few centuries. Now that could really put the cat among the pigeons.
This article is the collaboration of Rudi Fronk and Jim Anthony, cofounders of Seabridge Gold, and reflects the thinking that has helped make them successful gold investors. Rudi is the current Chairman and CEO of Seabridge and Jim is one of its largest shareholders.
Disclaimer: The authors are not registered or accredited as investment advisors. Information contained herein has been obtained from sources believed reliable but is not necessarily complete and accuracy is not guaranteed. Any securities mentioned on this site are not to be construed as investment or trading recommendations specifically for you. You must consult your own advisor for investment or trading advice. This article is for informational purposes only.
Disclosures: 1) Statements and opinions expressed are the opinions of Rudi Fronk and Jim Anthony and not of Streetwise Reports or its officers. The authors are wholly responsible for the validity of the statements. Streetwise Reports was not involved in any aspect of the content preparation. The authors were not paid by Streetwise Reports for this article. Streetwise Reports was not paid by the authors to publish or syndicate this article. The information provided above is for informational purposes only and is not a recommendation to buy or sell any security. Streetwise Reports requires contributing authors to disclose any shareholdings in, or economic relationships with, companies that they write about. Streetwise Reports relies upon the authors to accurately provide this information and Streetwise Reports has no means of verifying its accuracy. 2) Rudi Fronk and Jim Anthony: we, or members of our immediate household or family, own shares of the following companies mentioned in this article: Seabridge Gold. We personally are, or members of our immediate household or family are, paid by the following companies mentioned in this article: Seabridge Gold. 3) Seabridge Gold is a billboard sponsor of Streetwise Reports. Click here for important disclosures about sponsor fees. 4) This article does not constitute investment advice. Each reader is encouraged to consult with his or her individual financial professional and any action a reader takes as a result of information presented here is his or her own responsibility. By opening this page, each reader accepts and agrees to Streetwise Reports’ terms of use and full legal disclaimer. This article is not a solicitation for investment. Streetwise Reports does not render general or specific investment advice and the information on Streetwise Reports should not be considered a recommendation to buy or sell any security. Streetwise Reports does not endorse or recommend the business, products, services or securities of any company mentioned on Streetwise Reports. 5) From time to time, Streetwise Reports LLC and its directors, officers, employees or members of their families, as well as persons interviewed for articles and interviews on the site, may have a long or short position in securities mentioned. Directors, officers, employees or members of their immediate families are prohibited from making purchases and/or sales of those securities in the open market or otherwise from the time of the interview or the decision to write an article until three business days after the publication of the interview or article. The foregoing prohibition does not apply to articles that in substance only restate previously published company releases.
Everyone wanted a piece of the Japanese Yen on Wednesday after disappointing ADP payroll data from the United States and gloomy outlook on trade from the World Trade Organization (WTO) heightened risk aversion.
Concerns over the largest economy in the world decelerating amid trade disputes is denting risk appetite, eroding investor confidence and weighing on global sentiment. The Japanese Yen is positioned to remain a trader’s best friend for the rest of the week as risk-off becomes a major market theme. Given how the Yen has already appreciated against every single G10 currency and roughly 0.7% against the Dollar since Monday, further gains are on the cards.
Focusing on the technical picture, the USDJPY is under pressure on the daily charts. An appreciating Yen has sent the USDJPY below 107.50. A solid weekly close below this level is likely to encourage a decline towards 106.90.
EURJPY challenges 117.50 support level
A broadly appreciating Yen also sent the EURJPY towards 117.50 on Wednesday.
Sustained weakness below the 117.50 level should inspire bears to attack 117.00 and 116.50. Should 118.00 prove to be unreliable resistance, the EURJPY could push back towards 118.60.
GBPJPY eyes 131.00 on rising risk aversion
The combination of Sterling weakness and Yen strength sent the GBPJPY sinking towards 131.50.
Prices are turning bearish on the daily charts and is positioned to drop further if 131.50 proves to be an unreliable support. Focusing on the technical picture, prices have scope to test 130.70 and 130.00 in the short to medium term.
Technical traders will be looking for a solid daily close below 131.50 which could open a path towards 130.70.
Commodity spotlight – Gold
Risk aversion is prompting investors to rush to safe-haven assets like the Japanese Yen and Gold.
As discussed earlier this morning, Gold bulls remain supported by global growth concerns and prospects of lower interest rates across the world. Prices have hit the $1500 psychological level and could push higher ahead of the US jobs report on Friday.
Disclaimer: The content in this article comprises personal opinions and should not be construed as containing personal and/or other investment advice and/or an offer of and/or solicitation for any transactions in financial instruments and/or a guarantee and/or prediction of future performance. ForexTime (FXTM), its affiliates, agents, directors, officers or employees do not guarantee the accuracy, validity, timeliness or completeness, of any information or data made available and assume no liability as to any loss arising from any investment based on the same.
It’s been really busy for Europe on the economic calendar for the last couple of days. And the data barrage has at least one more day to go!
Tomorrow we get the important retail sales data after the final PMI composite data.
The expectation is for a round-up of the last of the generally worse than anticipated economic indicators from Europe.
The most concerning was the performance of the EU’s largest economy. Many of the surrounding countries are being affected by what some analysts are calling the “German economic autumn”.
The outlook for major businesses across Europe is falling to the worst levels since the last economic crisis.
Where We Are Headed
As the economy slows due to structural issues, usually the last to feel the effects are consumers. This is different from a financial crunch scenario, where a drop in consumer demand leads to a spike in inventories and a pullback in production.
Businesses across the continent are seeing orders drop primarily for exports. The trend has been maintained since the beginning of the trade war and heightened risk of tariffs. However, it took an unusually strong downturn last month.
Dropping export orders is a world-wide phenomenon. The indicator illustrated this well the day before yesterday with surprise and significant drops both from the US and Russia.
But Europe has an additional concern that provides uncertainty and especially impacts consumer sentiment: Brexit.
A graph of the vagaries of retail sales shows clear drops around key dates in the process. And with interest rates so low, there is little monetary policy space to support demand. Especially ahead of the uncertainty of the Brexit deadline and further US-China negotiations.
What We Are Looking For
Tomorrow we get retail sales data for September.
Expectations are for these to improve despite the contraction in business sentiment. The market usually focuses on the monthly data, and this could be when we get the largest bit of fundamentals-driven market volatility.
Projections indicate that monthly retail sales will have increased by 0.1%. This is compared to -0.6% in the prior month.
This figure bounces around a bit given the plethora of disappointing data we’ve had. However, a better than expected result could support some upside for the euro from relief at finally getting some good news.
A disappointment in the data could lead to further depression. It could also mean a return to the downward trend that it has been maintaining since early September.
On an annualized basis, expectations are for retail sales to slow to a 1.4% increase compared to +2.2% in August.
It’s really hard for CPI to grow if consumers are not increasing demand, and a slow pace in retail sales would translate into slow inflation in the near future. The ECB would be under renewed pressure to take action, which would be generally seen as negative for the euro.
The Other Data
Something to keep an eye out for tomorrow is the eurozone services PMI.
It isn’t all that likely to move the currency. But, so far, the economic problem facing Europe has been outward-facing as a lack of exports. The internal outlook has remained in expansion through this period, with the worst outlook in January and February.
But if September Services PMI were to come in below 51 (or worse, slip into contraction) the market might read it as the broader economic concerns bleeding over into the internal market. It could also suggest that a recession (technical or otherwise) is on the horizon.
It’s not currently on many analysts’ radar, but it could provide some significant downside risk for the euro should the market be caught by some surprisingly bad PMI data tomorrow.