5-Year Bond Speculators strongly cut back on their bearish bets last week

By CountingPips.comReceive our weekly COT Reports by Email

5-Year Bond Non-Commercial Speculator Positions:

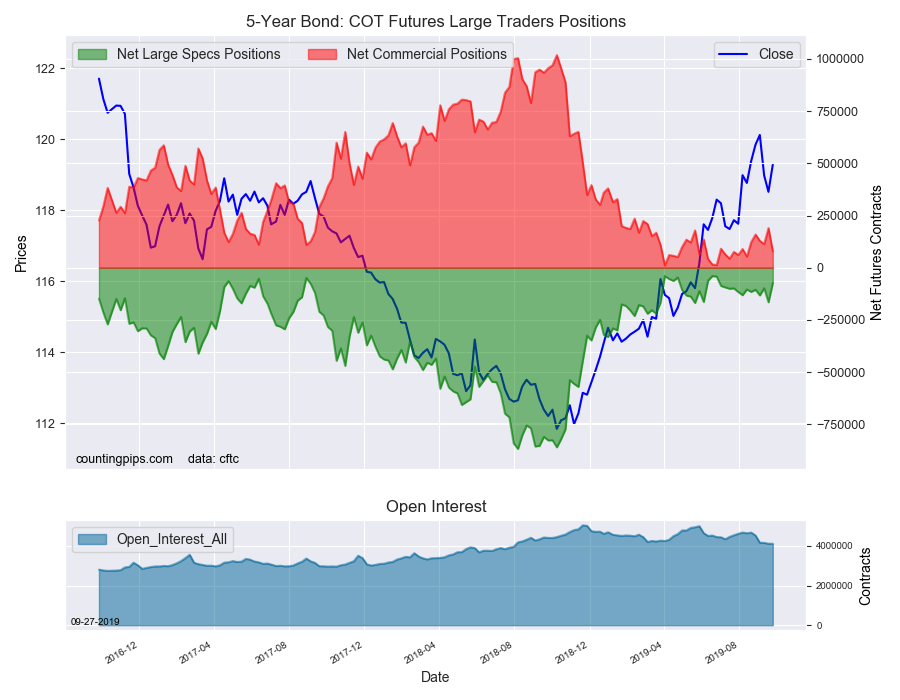
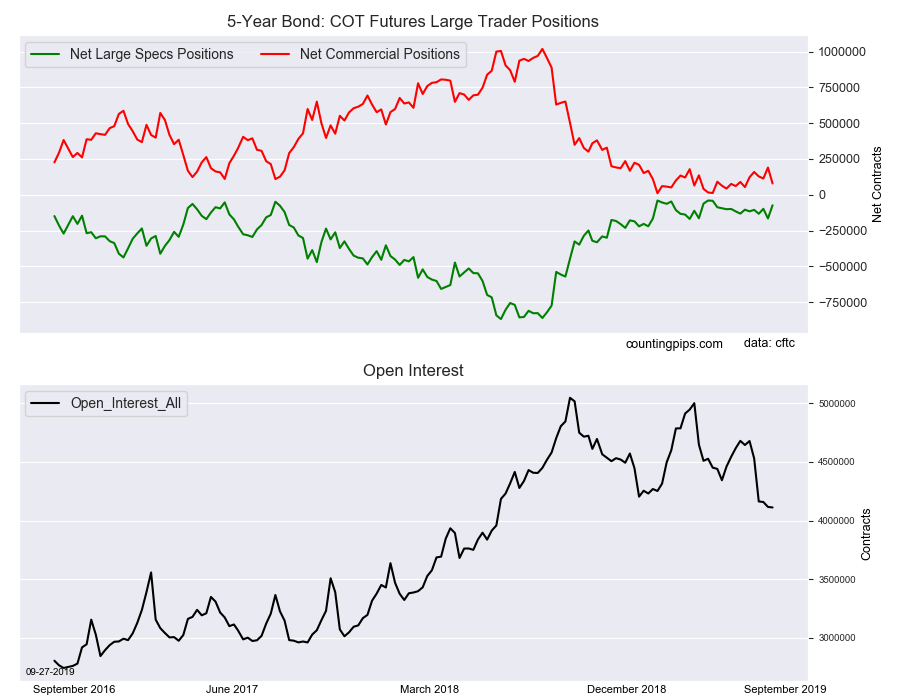
Large bond speculators reduced their bearish net positions in the 5-Year Bond futures markets last week, according to the latest Commitment of Traders (COT) data released by the Commodity Futures Trading Commission (CFTC) on Friday.

The non-commercial futures contracts of 5-Year Bond futures, traded by large speculators and hedge funds, totaled a net position of -72,968 contracts in the data reported through Tuesday September 24th. This was a weekly change of 92,409 net contracts from the previous week which had a total of -165,377 net contracts.

The week’s net position was the result of the gross bullish position (longs) ascending by 36,497 contracts (to a weekly total of 727,916 contracts) while the gross bearish position (shorts) fell by -55,912 contracts for the week (to a total of 800,884 contracts).

Five-year speculators sharply reduced their existing bearish positions last week for the second time in three weeks. The decline represented the largest one-week drop in fifteen weeks and brought the net position to the least bearish level of the past thirteen weeks.

Overall, the current bearish position is just a fraction of the speculator’s bearishness in 2018 which saw bearish bets get as high as -850,000 contracts.

5-Year Bond Commercial Positions:

The commercial traders position, hedgers or traders engaged in buying and selling for business purposes, totaled a net position of 79,093 contracts on the week. This was a weekly decrease of -110,919 contracts from the total net of 190,012 contracts reported the previous week.

5-Year Futures:

Over the same weekly reporting time-frame, from Tuesday to Tuesday, the 5-Year Futures (Front Month) closed at approximately $119.28 which was a boost of $0.76 from the previous close of $118.51, according to unofficial market data.

*COT Report: The COT data, released weekly to the public each Friday, is updated through the most recent Tuesday (data is 3 days old) and shows a quick view of how large speculators or non-commercials (for-profit traders) as well as the commercial traders (hedgers & traders for business purposes) were positioned in the futures markets.

The CFTC categorizes trader positions according to commercial hedgers (traders who use futures contracts for hedging as part of the business), non-commercials (large traders who speculate to realize trading profits) and nonreportable traders (usually small traders/speculators).

Find CFTC criteria here: (http://www.cftc.gov/MarketReports/CommitmentsofTraders/ExplanatoryNotes/index.htm).

Article By CountingPips.comReceive our weekly COT Reports by Email

Natural Gas Speculators added to their bearish bets for 1st time in 6 weeks

By CountingPips.comReceive our weekly COT Reports by Email

Natural Gas Non-Commercial Speculator Positions:

Large energy speculators slightly increased their bearish net positions in the Natural Gas futures markets last week, according to the latest Commitment of Traders (COT) data released by the Commodity Futures Trading Commission (CFTC) on Friday.

The non-commercial futures contracts of Natural Gas futures, traded by large speculators and hedge funds, totaled a net position of -124,981 contracts in the data reported through Tuesday September 24th. This was a weekly change of -1,806 net contracts from the previous week which had a total of -123,175 net contracts.

The week’s net position was the result of the gross bullish position (longs) falling by -9,269 contracts (to a weekly total of 193,523 contracts) while the gross bearish position (shorts) fell by  a lesser amount of -7,463 contracts for the week (to a total of 318,504 contracts).

Natural gas speculators slightly added to their bearish bets last week following five straight weeks of declining bearish positions. Speculators have recently been shedding their bearish bets after reaching a yearly high of -212,554 contracts on August 13th.

Natural gas speculative positions have now been in bearish territory for a total of thirty-three consecutive weeks dating back to February 12th.

Natural Gas Commercial Positions:

The commercial traders position, hedgers or traders engaged in buying and selling for business purposes, totaled a net position of 86,054 contracts on the week. This was a weekly shortfall of -2,667 contracts from the total net of 88,721 contracts reported the previous week.

Natural Gas Futures:

Over the same weekly reporting time-frame, from Tuesday to Tuesday, the Natural Gas Futures (Front Month) closed at approximately $2.52 which was a decrease of $-0.14 from the previous close of $2.66, according to unofficial market data.

*COT Report: The COT data, released weekly to the public each Friday, is updated through the most recent Tuesday (data is 3 days old) and shows a quick view of how large speculators or non-commercials (for-profit traders) as well as the commercial traders (hedgers & traders for business purposes) were positioned in the futures markets.

The CFTC categorizes trader positions according to commercial hedgers (traders who use futures contracts for hedging as part of the business), non-commercials (large traders who speculate to realize trading profits) and nonreportable traders (usually small traders/speculators).

Find CFTC criteria here: (http://www.cftc.gov/MarketReports/CommitmentsofTraders/ExplanatoryNotes/index.htm).

Article By CountingPips.comReceive our weekly COT Reports by Email

Iceland cuts 4th time on fear growth could weaken rapidly

By CentralBankNews.info

Iceland’s central bank cut its interest rates for the 4th time in a row, saying the economy could weaken more rapidly than it expects due to the uncertain outlook, particularly for the global economy.

The Central Bank of Iceland (CBI) cut the rate on its benchmark 7-day deposits by another 25 basis points to 3.25 percent and has now cut it by 125 points this year following cuts in May, June and August.

CBI said recent data shows economic activity has been stronger than assumed and growth was a bit stronger than projected in the August monetary bulletin, but this was mainly due to a shift in demand toward domestic production, partly offsetting the decline in exports.

“Leading indicators imply that economic activity will continue to slow, although there are signs that the economy may be regaining a foothold,” CBI said.

In its latest forecast from August, CBI lowered its projection for economic growth in 2020 to 1.9 percent from an earlier forecast of 2.4 percent and revised its forecast for growth this year for a contraction of  0.2 percent, up from the May forecast of a 0.4 percent contraction.

Iceland’s gross domestic product grew by an annual 2.7 percent in the second quarter of the year, rebounding from contraction of 0.9 percent in the first quarter.

By 2021 CBI expects the economy to rebound and expand by 2.7 percent, helped by stronger domestic demand, including a 6.6 percent rise in public investment.

After a severe recession in the wake of the global financial crises, tourism helped launch a boom in Iceland, which the economy growing 4.6 percent in 2017 and 2018.

Iceland is now facing a series of challengers after tourism began to decline, the budget airline WOW collapsed, uncertainty surrounds Icelandair’s grounded Boeing 737 MAX aircraft, the Icelandic krona has been high, and exports were hit by the collapse of the fishing of capelin due to rising ocean temperatures.

Iceland’s headline inflation rate eased to 3.0 percent in September from 3.2 percent in August and CBI said it expects it to ease faster than assumed in August while the krona has appreciated, leading to a slight tightening of the monetary policy stance.

In August CBI forecast consumer price inflation would average 3.1 this year and then decelerate to 2.4 percent in 2020 and 2.2 percent in 2021, below the bank’s 2.5 percent target.

The Central Bank of Iceland issued the following statement:

“The Monetary Policy Committee (MPC) of the Central Bank of Iceland has decided to lower the Bank’s interest rates by 0.25 percentage points. The Bank’s key interest rate – the rate on seven-day term deposits – will therefore be 3.25%.
According to preliminary national accounts figures, output growth continued to ease in H1/2019, even though it was somewhat stronger than was forecast in the August Monetary Bulletin. This relatively stronger growth is due mainly to a more favourable contribution of net trade, as demand has shifted towards domestic production, partially offsetting the contraction in exports. Leading indicators imply that economic activity will continue to slow, although there are signs that the economy may be regaining a foothold.
Headline inflation measured 3.1% in Q3, after falling between quarters, while underlying inflation rose month-on-month in September. Headline inflation was slightly lower than was forecast in August, and the outlook is for it to ease faster than was assumed there. The króna has appreciated, and inflation expectations have fallen since the MPC’s last meeting. The monetary stance has therefore tightened slightly.
Recent developments suggest that economic activity has been stronger than previously assumed. On the other hand, the outlook is uncertain, particularly for the global economy. As a result, domestic GDP growth could weaken more rapidly than is currently expected.
Near-term monetary policy decisions will depend on the interaction between developments in economic activity, on the one hand, and inflation and inflation expectations, on the other.
1. Overnight loans 5.00%
2. Seven-day colleteralised loans 4.00%
3. Seven-day term deposits 3.25%
4. Current accounts 3.00%
5. Minimum required reserves, average maintenance 3.00%
6. Minimum required reserves, fixed requirement 0.00%”


Russian Ruble Speculators added to bullish bets last week for 5th time in 6 weeks

By CountingPips.comReceive our weekly COT Reports by Email

Russian Ruble Non-Commercial Speculator Positions:

Large currency speculators lifted their bullish net positions in the Russian Ruble futures markets last week, according to the latest Commitment of Traders (COT) data released by the Commodity Futures Trading Commission (CFTC) on Friday.

The non-commercial futures contracts of Russian Ruble futures, traded by large speculators and hedge funds, totaled a net position of 24,612 contracts in the data reported through Tuesday September 24th. This was a weekly change of 1,061 net contracts from the previous week which had a total of 23,551 net contracts.

The week’s net position was the result of the gross bullish position (longs) growing by 2,366 contracts (to a weekly total of 36,064 contracts) while the gross bearish position (shorts) rose by a lesser amount of 1,305 contracts for the week (to a total of 11,452 contracts).

Russian ruble speculators raised their bullish positions following a down week the week prior. The bullish bets have now gained in five out of the last six weeks and remain above the +20,000 net contract level for a twenty-ninth consecutive week.

Overall, the ruble speculative positions have been in a bullish position for fifty-one straight weeks dating back to October 9th of 2018.

Russian Ruble Commercial Positions:

The commercial traders position, hedgers or traders engaged in buying and selling for business purposes, totaled a net position of -25,104 contracts on the week. This was a weekly decrease of -928 contracts from the total net of -24,176 contracts reported the previous week.

Russian Ruble Futures:

Over the same weekly reporting time-frame, from Tuesday to Tuesday, the Russian Ruble Futures (Front Month) closed at approximately $0.0154 which was a gain of $0.0001 from the previous close of $0.0153, according to unofficial market data.

*COT Report: The COT data, released weekly to the public each Friday, is updated through the most recent Tuesday (data is 3 days old) and shows a quick view of how large speculators or non-commercials (for-profit traders) as well as the commercial traders (hedgers & traders for business purposes) were positioned in the futures markets.

The CFTC categorizes trader positions according to commercial hedgers (traders who use futures contracts for hedging as part of the business), non-commercials (large traders who speculate to realize trading profits) and nonreportable traders (usually small traders/speculators).

Find CFTC criteria here: (http://www.cftc.gov/MarketReports/CommitmentsofTraders/ExplanatoryNotes/index.htm).

Article By CountingPips.comReceive our weekly COT Reports by Email

GBPUSD Analysis: UK building contraction accelerating bearish for GBPUSD

By IFCMarkets

UK building contraction accelerating bearish for GBPUSD

UK building activity fell for the fourth month in a row in September. Will the GBPUSD decline?

GBPUSD falling below MA(200)

The price chart on 1-hour timeframe shows GBPUSD: H1 is in downtrend. The price is below the 200-period moving average MA(200) which is falling. And the RSI is above 50 level and hasn’t reached the overbought zone yet.

Technical Analysis Summary

OrderSell
Sell stopBelow 1.2226
Stop lossAbove 1.2249

Market Analysis provided by IFCMarkets

XAUEUR Analysis: Gold versus Euro trading instrument

By IFCMarkets

In this analysis, we will consider the gold versus euro trading instrument from the Precious Metals group. Will the XAUEUR quotations fall?

Such movement is observed when gold becomes cheaper, and a single European currency strengthens. The price of precious metals may decrease if the trade negotiations between China and the US begin next week, as well as in the case of the Brexit agreement between Britain and the EU. All this reduces global risks. In addition, gold quotes often decline in case of strengthening of the American currency, as investors see it as an alternative to the dollar.

A positive factor for the dollar and a negative factor for precious metals may be the preservation of the current Fed rate at 2% at the end of the next meeting on October 30, 2019. Inflation in the USA is already noticeably higher and amounts to 2.4% in annual terms. The probability of a rate cut is now estimated by CME FedWatch at 62.5%. This week for XAUEUR significant macroeconomic data will be released on Friday, October 4 – Non-farm Payrolls (employment in the US non-farm sector) for September. The dynamics of the euro is likely to depend on the outcome of the ECB meeting on October 24. Like the US Federal Reserve, the European regulator may postpone easing its monetary policy.

XAUEUR

On the daily timeframe XAUEUR: D1 broke down the support line of the uptrend. Various technical analysis indicators formed signals to decrease. It is possible in case of euro rate strengthening and precious metals demand decrease.

  • The Parabolic indicator gives a bearish signal.
  • The Bolinger bands narrowed, indicating a volatility decrease. Both Bollinger Lines Slope Down.
  • The RSI indicator is below the mark of 50. It has formed a divergence to decrease.
  • The MACD indicator demonstrates a downward signal.

The bearish momentum may develop if XAUEUR falls below the last two lower fractals and the lower Bollinger line: 1340. This level can be used as an entry point. The initial stop lose may be placed higher than the last three upper fractals, the historical maximum, the upper Bollinger line and the Parabolic signal: 1414. After opening a pending order, the stop shall be moved following the Bollinger and Parabolic signals to the next fractal minimum. Thus, we change the potential profit / loss ratio in our favor. Thus, we are changing the potential profit/loss to the breakeven point. More risk-averse traders may switch to the 4-hour chart after the trade and place a stop loss moving it in the direction of the trade. If the price meets the stop level (1414) without reaching the order (1340), we recommend to cancel the order: the market sustains internal changes that were not taken into account.

Technical Analysis Summary

PositionSell
Sell stopBelow 1340
Stop lossAbove 1414

Market Analysis provided by IFCMarkets

Dollar Slips As Manufacturing Contracts Further

By Orbex

The US dollar traded weaker as it gave back the gains from the previous session.

The ISM manufacturing PMI disappointed as the index fell to 47.8 in September. This follows a decline to 49.1 in August.

The employment gauge was also down, falling to the lowest levels since January 2016. The data comes amid global trade slowing. Meanwhile, new orders, backlogs, and inventories contracted during the period.

Eurozone Flash Inflation Estimate Falls in September

The latest flash inflation estimates for the eurozone showed a decline from 1.0% in August to 0.9% in September. Economists forecast that inflation would rise 1.0% during the month.

The core CPI estimates, however, came inline with the median expectations of 1.0%. The decline in the headline CPI comes just after the ECB started its QE program.

EURUSD Testing the Support Area

The currency pair managed to post a rebound from two-year lows. However, the euro is testing the support area of 1.0925 – 1.0944. A close above this level will confirm the upside. But resistance will be confirmed if the EURUSD fails to rise any higher. In the near term, the EURUSD will likely be confined to the short term range.

EURUSD

UK Manufacturing Improves to a 4-month High

Manufacturing activity in the United Kingdom rose slightly to 48.3, beating estimates of 47.4. In August, manufacturing activity fell to 47.4.

A reading below 50 indicates a contraction in the index. The UK’s manufacturing sector has been trending below 50 since May this year. The data for September puts the manufacturing activity at a four-month high.

GBPUSD Extends Declines

The currency pair failed to capitalize on the manufacturing PMI report and closed weaker. Price action remains trading below the support level of 1.2291. Therefore, any rebound in the short term could see price retesting this level for resistance. The overall bias remains towards 1.2082, unless GBPUSD closes above 1.2291.

GBPUSD

Gold Rebounds as Dollar Loses Steam

The precious metal pared losses as the USD turned weaker. Gold prices jumped on Tuesday following the weak ISM manufacturing data.

The report could potentially stir up speculation for another rate cut from the Fed. Investors will be looking to this Friday’s payrolls report which could be a major market-moving event.

XAUUSD Retesting 1485 for Resistance

The rebound in the precious metal has sent gold prices to retest the breached support level of 1485 for resistance. If price fails to breakout any higher, we could expect the downside to prevail.

The lower support area at 1431 – 1428 remains the downside target. However, if the USD weakness continues, there is scope for gold prices to extend the bounce higher, invalidating the downside bias.

XAUUSD

By Orbex


ISM Manufacturing Hits New Cycle Lows

By Orbex

Manufacturing Hit Again

The August US ISM manufacturing data once again highlighted the ongoing damage from the US-China trade war.

The index fell into contractionary territory for the first time since 2016.

Following up on this, the September ISM report, released yesterday, added further cause for concern.

At just 47.8 over the month, the ISM manufacturing index is now at a new cycle low. It has fallen below even the level seen during the 2015 – 2016 slowdown.

Only 1 Component Not in Contractionary Territory

Despite better tone communications between the US and China over the month, including a raft of concessions and talk of a potential deal, it seems the damage has already been done.

Each subcomponent in the survey is reportedly in contractionary territory. The one exception to this was supplier delivery times. However, even this was growing more slowly than expected.

Export Orders Down

Looking at the breakdown of the data, the production component of the index slid further into contractionary territory, along with inventories. This suggests that slower stock levels will likely be a drag on GDP this quarter.

Hiring in manufacturing also contracted at a faster pace than expected. This furthered the trend of moderation in private payroll growth.

Given that the backlogs of orders have shrunk for a fifth straight month now, reductions in hiring are not a surprise.

Elsewhere, the data showed that the new orders component was little changed at 47.3 from 47.2 last time. However, with export orders at a new cycle low, it seems that the negative effects of the ongoing trade war and a stronger dollar, are being clearly felt.

While the ISM Manufacturing report was decidedly bearish for the US economy, other PMI sets fared a little better.

The regional Fed manufacturing surveys rose 1.8%. Meanwhile, the September Markit manufacturing survey showed activity firming again back above the 50 level.

However, in line with the ongoing slowdown in global growth and trade war, manufacturing is likely to remain subdued.

ISM Non-Manufacturing Up Next

The drop in the manufacturing index is a clear marker for how the US economy is responding to ongoing trade tensions with China.

However, at just 12% of output and accounting for just 8.5% of employment, the more important reading to watch will be Thursday’s ISM Non-Manufacturing report.

Despite the fall back in manufacturing, the non-manufacturing report held up reasonably well in August. If this reading can maintain above the 50 level in September, that would point more towards a slowdown in the economy instead of a full-blown recession.

However, any downside surprise on Thursday could be heavily bearish for the US economy.

Technical Perspective

spx500

The latest data weakness in the US has hit risk sentiment today. The SPX500 is falling back further to trade 2925.63 last, testing the zone of support around the broken 2931.22 highs.

If price can hold back above this level, we could still see some further higher. While below here, focus will be on a test of the rising trend line from 2018 lows next, ahead of structural support at the 2878.17 level.

By Orbex


Forex Technical Analysis & Forecast 02.10.2019 (EURUSD, GBPUSD, USDCHF, USDJPY, AUDUSD, USDRUB, USDCAD, GOLD, BRENT, BTCUSD)

Article By RoboForex.com

EURUSD, “Euro vs US Dollar”

After finishing the correction at 1.0940, EURUSD is consolidating near the highs. Possibly, the pair may expand the range towards 1.0943 and then form a new descending structure to reach 1.0924. Later, the market may break the range to the downside and continue trading inside the downtrend with the target at 1.0907.

EURUSD
Risk Warning: the result of previous trading operations do not guarantee the same results in the future

GBPUSD, “Great Britain Pound vs US Dollar”

After reaching the downside target at 1.2205, GBPUSD has completed the correction towards 1.2330. Possibly, today the pair may fall to break 1.2250 and then continue trading downwards with the target at 1.2182.

GBPUSD
Risk Warning: the result of previous trading operations do not guarantee the same results in the future

USDCHF, “US Dollar vs Swiss Franc”

After reaching the upside target at 1.0000, USDCHF has completed the quick descending correction towards 0.9925; right now, it is consolidating near the lows. According to the main scenario, the price is expected to break this range to the upside and grow with the target at 0.9995.

USDCHF
Risk Warning: the result of previous trading operations do not guarantee the same results in the future

USDJPY, “US Dollar vs Japanese Yen”

After reaching 108.40, USDJPY has formed the quick descending correction towards 107.70; right now, it is consolidating near the lows. The main scenario implies that the price may continue moving upwards. Today, the pair may reach the target at 108.25.

USDJPY
Risk Warning: the result of previous trading operations do not guarantee the same results in the future

AUDUSD, “Australian Dollar vs US Dollar”

AUDUSD is moving upwards to reach 0.6727. After that, the instrument may start another decline towards 0.6699 and then form one more ascending structure with the target at 0.6755.

AUDUSD
Risk Warning: the result of previous trading operations do not guarantee the same results in the future

USDRUB, “US Dollar vs Russian Ruble”

USDRUB is still correcting upwards. Possibly, the pair may reach 65.45 and then resume trading downwards with the target at 64.50.

USDRUB
Risk Warning: the result of previous trading operations do not guarantee the same results in the future

USDCAD, “US Dollar vs Canadian Dollar”

USDCAD has completed another descending wave at 1.3200 to finish Flag correctional pattern; right now, it is consolidating around 1.3216. If later the price breaks this range to the upside at 1.3228, the instrument may start a new growth with the target at 1.3300; if to the downside at 1.3200 – continue the correction towards 1.3180 (an alternative scenario).

USDCAD
Risk Warning: the result of previous trading operations do not guarantee the same results in the future

XAUUSD, “Gold vs US Dollar”

After reaching the downside target at 1463.55, Gold has already formed two ascending impulses. Possibly, today the pair may start another correction to each 1469.50 and then continue trading upwards with the target at 1496.00.

GOLD
Risk Warning: the result of previous trading operations do not guarantee the same results in the future

BRENT

Brent is still moving downwards. Today, the pair may grow to reach 60.46 and then form a new descending structure towards 58.35. Later, the market may start another growth with the first target at 64.50.

BRENT
Risk Warning: the result of previous trading operations do not guarantee the same results in the future

BTCUSD, “Bitcoin vs US Dollar”

After expanding the range towards 8500.00, BTCUSD is falling to break 8150.00. Later, the market may continue the downtrend towards 7825.00.

BITCOIN

Article By RoboForex.com

Attention!
Forecasts presented in this section only reflect the author’s private opinion and should not be considered as guidance for trading. RoboForex LP bears no responsibility for trading results based on trading recommendations described in these analytical reviews.

AUD Hits Fresh 2019 Lows

By Orbex

Dollar Down On Data Miss

The US dollar has been higher over the European morning on Wednesday, recovering losses seen in reaction to yesterday’s weak ISM manufacturing print. The index remained in contractionary territory for a second consecutive month over September, highlighting the ongoing damage from the US/China trade war. USD index trades 99.00 last, off yesterday’s 99.31 highs.

CPI Weakness Hits EUR

EURUSD has been lower over the day so far, weighed on by a resurgent US dollar. CPI data for the Eurozone, released yesterday, showed inflation undershooting expectations once again. On the back of a set of weak Eurozone PMIs last, this latest data miss keeps sentiment firmly bearish on EURUSD which is holding just above the 1.0914 level for now.

UK Traders Wait Brexit Deal News

GBPUSD has been back under pressure again today. Boris Johnson will today present an amended Brexit deal to the EU in the hopes of securing approval for a deal ahead of the October 19th Benn Bill deadline. For now, it seems that the market is skeptical as to the likelihood of Johnson’s deal being approved. GBPUSD trades 1.2243 last, remaining back below the 1.2382 level.

Risk Down on Global Growth Fears

Risk assets have been firmly lower today on the back of yesterday’s weak US Manufacturing data. The market is now waiting on tomorrow’s Non-Manufacturing data, ahead of the US employment reports on Friday. SPX500 trades 2919.63 last with price having broken back below the 2931.22 level.

Safe Haven Inflows Rise

Safe havens have had a better start today with both gold and the JPY higher against USD in light of the sell-off in equities. USDJPY trades 107.64 last with price potentially creating a lower high against the September highs, signaling further downside. XAUUSD trades 1483.79 last, still way down from the key 1522.75 level for now.

Crude Down Despite Inventories Draw

Oil prices remain lower today ahead of the headline weekly-EIA report due later today. The downside is likely linked to the weakness in US manufacturing given that the API yesterday reported a 6 million barrel drawdown in US crude stores. If the EIA confirms the data later, this could help stem the decline. Though for now, focus is on slower global conditions. Crude trades 53.74 last.

CAD Capped Again

USDCAD has rallied firmly off the 1.3207 level tested yesterday. The sharply lower US manufacturing reading put a dent in USD though weaker oil prices have weighed CAD down, allowing for a recovery in USDCAD. Trade balance data due on Friday will be the key domestic data release of the week for CAD traders.

Fresh 2019 Lows in Aussie

AUDUSD traded down to fresh 2019 lows today as the post-RBA sell-off continues. The RBA cut rates this week to fresh record lows of just .75% and left the door open for further cuts given the ongoing damage being suffered as a result of the US/China trade war as well as persistent domestic headwinds from low wages and high household debt. AUDUSD trades .6677 last, sitting right on 2019 lows as of writing.

By Orbex