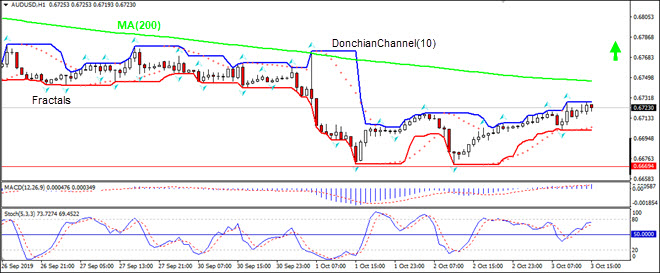
Trade balance surplus narrowing bearish for AUDUSD
Australia’s trade balance surplus narrowed in August to A5.93 billion from A6.00 billion. Will the AUDUSD decline?
The price chart on 1-hour timeframe shows AUDUSD: H1 is in uptrend. The price is rising toward the 200-period moving average MA(200) which is falling. And the Stochastic oscillator is above 50 level and hasn’t reached the overbought zone yet.
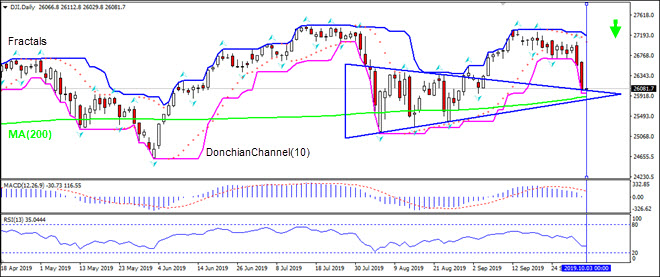
Manufacturing sector in US contracted for second straight month in September. Will the DJI stock index continue declining?
Weak US data lately spurred concerns economy may be on verge of slipping into recession. ISM’s index for manufacturing declined from 49.1 to 47.8 in September, the worst reading since June 2009. The forecast was 50, readings below 50 indicate contraction. While new orders for manufactured goods fell for the second month in a row, the contraction slowed. And the export orders reading was the lowest since March 2009. Earlier report indicated durable goods orders growth slowed to 0.2% over month in August 2019, following an upwardly revised 2% growth in July. Slowing manufacturing activity is bearish for US equities.
On the daily timeframe DJI: D1 is falling toward the 200-day moving average MA(200).
The Donchian channel indicates downtrend: it is narrowing down.
The RSI oscillator is level below 50 mark and has not reached the oversold zone.
We believe the bearish momentum will continue as the price breaches below the lower boundary of Donchian channel at 25968.20. This level can be used as an entry point for placing a pending order to sell. The stop loss can be placed above the fractal high at 27061.20. After placing the order, the stop loss is to be moved every day to the next fractal low, following Parabolic signals. Thus, we are changing the expected profit/loss ratio to the breakeven point. If the price meets the stop loss level (27061.20) without reaching the order (25968.20), we recommend cancelling the order: the market has undergone internal changes which were not taken into account.
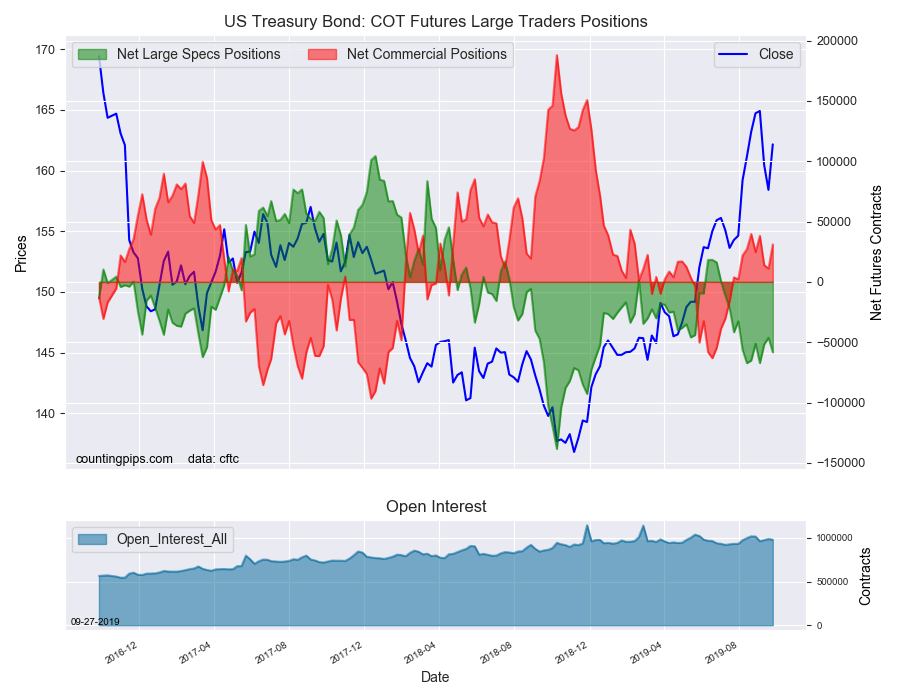
US Treasury Bond Non-Commercial Speculator Positions:
Large bond speculators increased their bearish net positions in the US Treasury Bond futures markets last week, according to the latest Commitment of Traders (COT) data released by the Commodity Futures Trading Commission (CFTC) on Friday.
The non-commercial futures contracts of US Treasury Bond futures, traded by large speculators and hedge funds, totaled a net position of -58,314 contracts in the data reported through Tuesday September 24th. This was a weekly change of -12,074 net contracts from the previous week which had a total of -46,240 net contracts.
The week’s net position was the result of the gross bullish position (longs) lowering by -6,420 contracts (to a weekly total of 125,700 contracts) while the gross bearish position (shorts) got a lift by 5,654 contracts for the week (to a total of 184,014 contracts).
US treasury bond (long bond) speculators added to their bearish bets for the first time in three weeks. Previously, specs had decreased their bearish positions in four out of the previous five weeks after positions had reached a 2019 bearish high of -67,301 contracts on August 13th. Overall, the speculative position has now been in bearish territory for twelve straight weeks after a short bullish spell in June and early July.
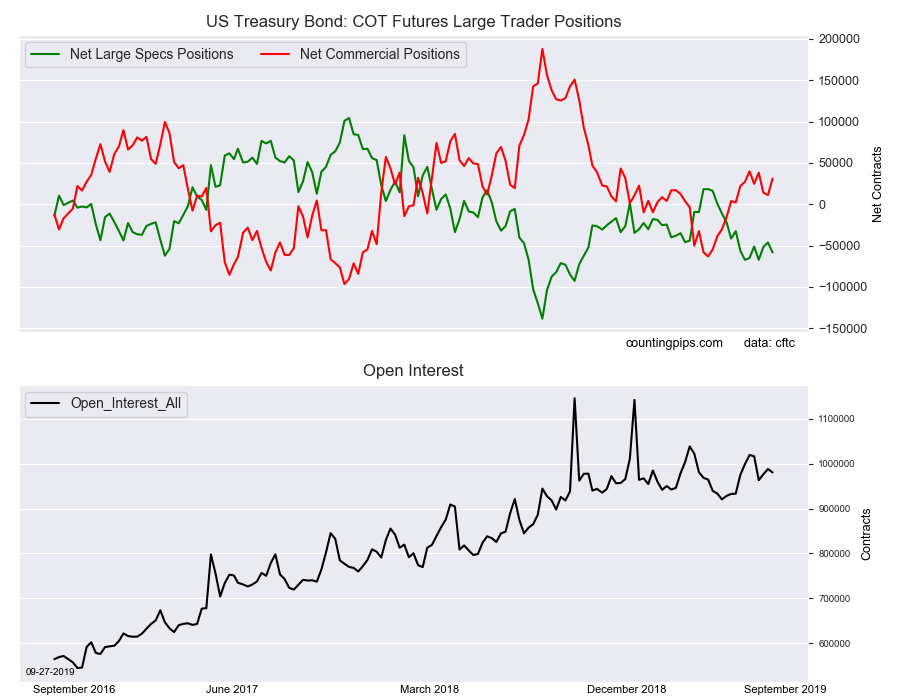
US Treasury Bond Commercial Positions:
The commercial traders position, hedgers or traders engaged in buying and selling for business purposes, totaled a net position of 31,141 contracts on the week. This was a weekly advance of 20,039 contracts from the total net of 11,102 contracts reported the previous week.
US Treasury Bond Futures:
Over the same weekly reporting time-frame, from Tuesday to Tuesday, the US Treasury Bond Futures (Front Month) closed at approximately $162.15 which was a boost of $3.75 from the previous close of $158.40, according to unofficial market data.
*COT Report: The COT data, released weekly to the public each Friday, is updated through the most recent Tuesday (data is 3 days old) and shows a quick view of how large speculators or non-commercials (for-profit traders) as well as the commercial traders (hedgers & traders for business purposes) were positioned in the futures markets.
The CFTC categorizes trader positions according to commercial hedgers (traders who use futures contracts for hedging as part of the business), non-commercials (large traders who speculate to realize trading profits) and nonreportable traders (usually small traders/speculators).
Crude prices were heavily lower on Wednesday as the latest report from the Energy Information Administration showed a further rise in US crude stores. The reaction to the news was particularly heavy. This is because the American Petroleum Institute reported a 6 million barrel drawdown only the day before.
Despite the API reading, the EIA report showed that in the week ending September 27th, US crude stores were higher by 3.1 million barrels. This level was almost twice the forecasted 1.6 million barrel increase the market was looking for.
Refinery Runs Drop
The main driver behind the large increase in US crude inventory levels was a much lower level of refinery runs which fell by 496k barrels per day. This decrease saw refinery utilization rates dropping by 3.4% on the week.
Gasoline Stores Down
However, the report was not all bullish. The EIA showed that US gasoline inventory levels fell by 288k barrels over the week. This was in stark contrast to the forecasted 449k barrel gain the market was looking for. Similarly, distillate inventories, which include heating and diesel oil, were lower by 2.4 million barrels. This outstripped market expectations for a 1.8 million barrel drop.
Elsewhere, the report showed that net US crude imports were higher by 29k barrels per day. Crude stores at the Cushing delivery hub in Oklahoma were lower by 216k barrels.
US Economic Concerns Adding Pressure
Crude oil prices have also been under pressure this week. This has come from renewed concerns over the health of the global economy. Following a set of miserable Eurozone manufacturing PMIs last week, US manufacturing data released this week showed the factory sector hitting a 10 year low of September. The ongoing impact of the US/China trade war is being seen across the globe. Yesterday, the UK reported that its manufacturing sector is also sitting in contractionary territory.
ARAMCO Restores Oil Output Capacity
Further bearish pressure this week came from the announcement by ARAMCO that its Saudi Arabia oil production was now back to full capacity.This is following the drone strike on the largest global processing site two weeks ago. The attack, which was attributed to Iran, wiped around 5% of global oil supply offline and caused a 20% spike higher in crude. This was its largest ever one day gain.
Technical Perspective
The technical picture in crude is looking precarious. Following the failure at the 60.39 level (which was briefly pierced on the drone-strike spike), crude prices have since reversed lower. They are trading back under the bearish trend line from year to date highs. Price is now quickly approaching key structural support at the 50.71. If we break below here, this could see a push as deep as the 42.54 level. Alternatively, if we hold above the 50.71 level, we can expect further consolidation. However, risks remain tilted to the downside in the near term.
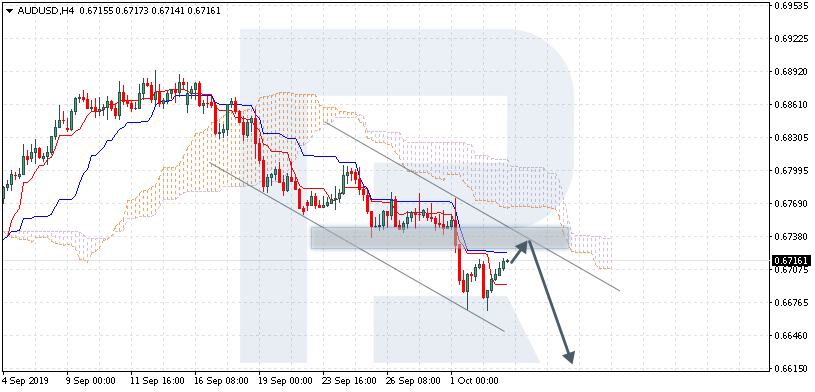
AUDUSD is trading at 0.6716; the instrument is moving below Ichimoku Cloud, thus indicating a descending tendency. The markets could indicate that the price may test Tenkan-Sen and Kijun-Sen at 0.6725 and then resume moving downwards to reach 0.6615. Another signal to confirm further descending movement is the price’s rebounding from the descending channel’s upside border. However, the scenario that implies further decline may be canceled if the price breaks the cloud’s upside border and fixes above 0.6800. In this case, the pair may continue growing towards 0.6885.
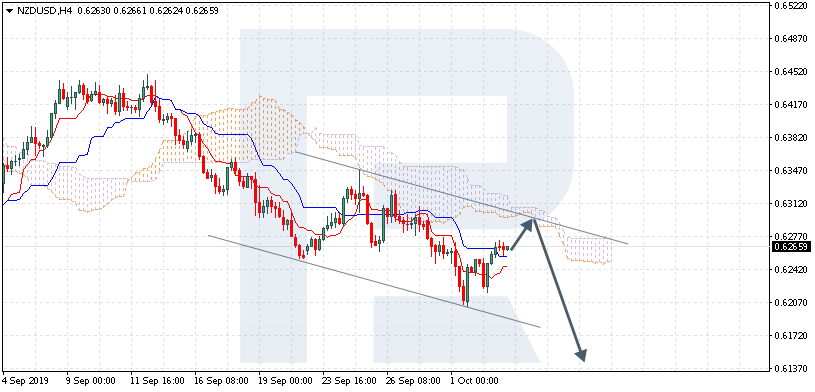
NZDUSD, “New Zealand Dollar vs US Dollar”
NZDUSD is trading at 0.6265; the instrument is moving below Ichimoku Cloud, thus indicating a descending tendency. The markets could indicate that the price may test the cloud’s downside border at 0.6280 and then resume moving downwards to reach 0.6135. Another signal to confirm further descending movement is the price’s rebounding from the descending channel’s upside border. However, the scenario that implies further decline may be canceled if the price breaks the cloud’s upside border and fixes above 0.6315. In this case, the pair may continue growing towards 0.6405.
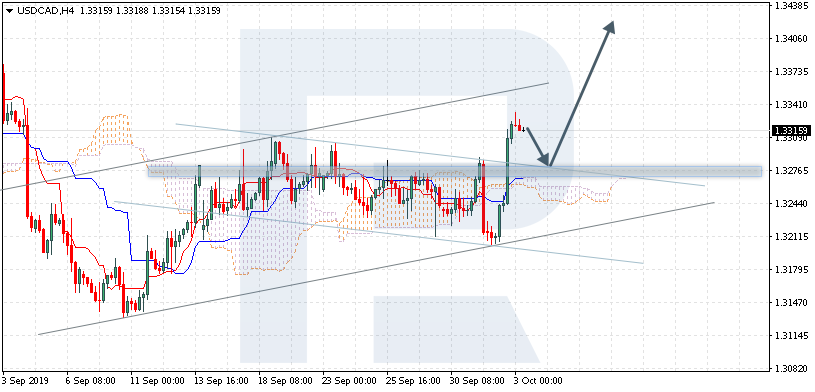
USDCAD, “US Dollar vs Canadian Dollar”
USDCAD is trading at 1.3315; the instrument is moving above Ichimoku Cloud, thus indicating an ascending tendency. The markets could indicate that the price may test Tenkan-Sen and Kijun-Sen at 1.3280 and then resume moving upwards to reach 1.3415. Another signal to confirm further ascending movement is the price’s rebounding from the descending channel’s upside border. However, the scenario that implies further growth may be canceled if the price breaks the cloud’s downside border and fixes below 1.3220. In this case, the pair may continue falling towards 1.3145.
Attention! Forecasts presented in this section only reflect the author’s private opinion and should not be considered as guidance for trading. RoboForex LP bears no responsibility for trading results based on trading recommendations described in these analytical reviews.
September’s ISM non-manufacturing PMI report is due to come out today.
Economists forecast that non-manufacturing or services activity in the United States will decline during the reporting month.
The ISM services sector has also been slowing over the past few months.
For September, the consensus view is that non-manufacturing activity will decline to 55.8. In August, non-manufacturing PMI registered a print of 56.4. The index briefly spiked to 56.9 in May following which there has been a steady decline ever since.
ISM Non-Manufacturing PMI
The services sector contributes quite a bit to the US gross domestic product. The manufacturing sector has also been weakening quite a bit. Thus, a decline in both manufacturing and non-manufacturing will potentially signal a possible downturn in the near term.
The services sector in the US accelerated in August. This saw an increase in private hiring which suggested that the economic services sector activity managed to buck the trade war uncertainty.
Investors will be closely watching the non-manufacturing PMI report today. The data will give us a glimpse into how the services sector has contributed to US GDP growth during the third quarter of the year.
There is no doubt that the expectations are for lower GDP growth during the three months ending September. A weaker ISM print will, however, confirm this view.
Flash Services PMI Fare Better in September: Markit
IHS Markit’s flash services PMI for September showed that business activity was muted. However, there was evidence of some modest increase in business activity. The flash US composite output index was at 51.0 in August, marking a two-month high.
The business activity index rose to 50.9 compared to 50.7 in August.
The flash services PMI output showed a modest increase in activity.
In August, Markit’s measure of the services sector fell to a three and a half year low. Business activity was, however, muted. Firms reported that the demand continued to remain sluggish during the month.
The rate of private-sector business growth was also one of the weakest since October 2009. The overall data, despite rising in September, reflects broad weakness. Sharper declines in work logs were noted.
Some companies also said that they had to cut back on hiring due to subdued demand. Payrolls in the private services sector were seen falling for the first time since January 2010. However, having said the above, the flash services PMI are always due for corrections.
As a result, there is a good chance that the actual reading could be somewhat better than expected.
From the ISM’s perspective, a slowdown in September will potentially see a slower average pace of growth. In the second quarter, the average of the ISM non-manufacturing PMI was 55.8. Even if the non-manufacturing PMI matches the estimates, it would still fall below the second-quarter average.
Trade Uncertainty to Weigh on Business
The current economic landscape isn’t the best. The global markets are already moving into the late growth cycle. While a slowdown in such a period is expected, this is further hastened by the trade war uncertainty.
While the trade war was relatively quiet during September, the expected declines are a result of the previous decisions made by the Trump administration.
With many expecting growth to slow, it will not be surprising to see a weaker headline print on the ISM non-manufacturing PMI. The next question will be whether investors will be expecting to see another rate cut from the Fed.
In the H4 chart, USDCHF is still moving upwards. In this case, the price is expected to continue growing to reach the resistance at 5/8. However, this scenario may no longer be valid if the price breaks 3/8 to the downside. After that, the instrument may continue falling towards the support at 1/8.
As we can see in the M15 chart, the pair has broken the upside line of the VoltyChannel indicator and, as a result, may continue moving upwards.
XAUUSD, “Gold vs US Dollar”
In the H4 chart, XAUUSD is consolidating. In this case, the price is expected to continue growing to reach the resistance at 7/8. However, this scenario may no longer be valid if the price breaks 3/8 to the downside again. After that, the instrument may resume falling towards the support at 1/8.
As we can see in the M15 chart, the pair has broken the upside line of the VoltyChannel indicator and, as a result, may continue its growth.
Attention! Forecasts presented in this section only reflect the author’s private opinion and should not be considered as guidance for trading. RoboForex LP bears no responsibility for trading results based on trading recommendations described in these analytical reviews.
The World Trade Organization ruled in favor of the United States in regard to the dispute on aircraft subsidies from the EU. At the heart of the dispute is the complaint from Washington about Airbus SE (a European aircraft manufacturer) receiving government subsidies. President Trump vowed to hit back at the EU with tariffs in response. The WTO ruling is the largest in history and allows the US to impose tariffs worth $7.5 billion on EU products which includes aircraft parts, leather goods, wines, and spirits.
Euro Gains for a Second Day on USD Weakness
The euro currency maintained the bullish momentum in the backdrop of a weaker US dollar. Lack of economic data from the Eurozone saw investors focusing on US data instead. The ADP private payrolls report saw hiring rise just 135,000 in September. This was below the estimate of 140,000. The numbers for August were revised down to 157,000 from 195,000 originally.
Further Gains in EURUSD Unlikely for Now
The currency pair has managed to post a strong reversal after slipping to a fresh two-year low. But further gains are unlikely to come by as the currency pair tests the resistance level from below. Only a convincing rally above the trend line and the horizontal support/resistance area will confirm the bullish bias. In the near term, we expect EURUSD to remain confined to the current range.
UK Submits Final Brexit Proposal to EU
UK Prime Minister submitted a newly drafted proposal to his EU counterparts. The new deal is seen to be going soft on the Irish backstop. The British PM maintained that if a deal was not reached, the UK will leave the EU. However, this could get complicated as lawmakers can legally block a no-deal Brexit.
GBPUSD Stays Flat for Now
The cable remained muted to Brexit developments on Wednesday. Price is currently trading near the recently breached support level of 1.2291. Any further gains could see GBPUSD trading within the range of 1.2291–1.2370. However, the risks to the downside remain. The lower support at 1.2228 will be the downside target for the short term.
Gold Ticks Up as Risk Sentiment Drops
The precious metal continued its upswing as investor risk sentiment fell. Weak manufacturing reports and the latest WTO ruling heightens uncertainty for the global economy. Equity markets responded with their continuing declines for a second day. It was the worst decline in more than five weeks.
Can XAUUSD Maintain the Current Gains?
The bullish reversal in gold comes right after prices fell below the price level of 1485. Further gains are required as XAUUSD trades in the support/resistance area between 1485 and 1508. Unless gold prices close with clear gains above 1508, the current retracement could fizzle. This Friday’s payrolls report could be the catalyst.
The US dollar has been well sold over the European session so far on Thursday as traders display nerves ahead of key US data later today. The ISM Non-Manufacturing reading for September is due and following a weak manufacturing print, there is a great deal of focus being placed on today’s reading. Finally, tomorrow, traders will receive the US employment reports for September. On the back of yesterday’s lackluster ADP result, there is a concern that the numbers might disappoint. USD index trades 98.70 last.
EUR Recovers Though Risks Remain
EURUSD has been a little higher over early trading today given the weakness in USD. However, the Eurozone itself has seen plenty of data weakness yesterday which is keeping ECB-easing expectations firmly rooted. EURUSD trades 1.0958 last, as price continues to recover above the 1.0914 level.
Brexit Uncertainty Continues
GBPUSD has been firmer against USD today also. The UK PM is set to address parliament today with his amended Brexit plan. There are fears that EU leaders will reject it following some initial negative responses. The PM has until October 19th to secure a deal or will be required to request an extension to Article 50 GBPUSD trades 1.2314 last.
SPX500 Stabilises
Risk assets have firmed today despite weaker global data. Soft PMI sets from the Eurozone, UK, and US have raised fears over the growing global slowdown. However, with USD pulling back today, SPX500 has been able to stabilize following heavy declines yesterday. SPX500 trades 2891.93 last, holding back above late August lows.
Gold & JPY Rally
Safe havens have had a better session so far today also as a weaker USD and recent sell-off in global equities has boosted both JPY and gold. USDJPY trades 107.06 last with price now testing last week’s lows. XAUUSD trades 1502.99 last with price moving firmly back in the direction of the key 1522.75 level.
Crude Crumbles On EIA Report
Oil prices remain under pressure today, extending their decline to an eleventh straight losing day. Yesterday, the EIA reported a further build in US crude stores which has added further pressure to the concern over the global demand outlook. Fears of growing recessionary risks in light of recent global data weakness are keeping oil prices weighed down also. Crude trades 52.34 last with price sitting back under the 52.72 support.
CAD Crashes
USDCAD has exploded higher over recent sessions as the heavy falls in the price off oil, as well as concerns for global growth, have hit CAD hard. USDCAD trades 1.3334 last following the sharp break back above 1.33. Price is now not far off the 1.3345 resistance level, putting 2019 highs back in focus.
Aussie On The Up
AUDUSD has been a little higher against USD today. Despite the turn lower in global risk sentiment this week, higher gold prices are helping keep AUD supported against a weaker USD. US data over the remainder of the week could see the downward USD move continue, allowing for further recover in AUDUSD which trades .6720 last, still below the .6758 level for now.
The USD continued to lose ground relative to currency majors. The EUR/USD quotes updated the local highs again. Greenback was pressured by weak labor market data from ADP. Currently, the EUR/USD currency pair is consolidating. The local support and resistance levels are: 1.09400 and 1.09650, respectively. A trading instrument has the potential for further growth. We are expecting important economic releases. We recommend opening positions from key levels.
The Economic News Feed for 03.10.2019:
– A number of indicators on business activity (GER/EU) – 10:55/11:00 (GMT+3:00);
– Initial Jobless Claims (US) – 15:30 (GMT+3:00);
– ISM Manufacturing Business Activity Index (US) – 17:00 (GMT+3:00);
Indicators signal the strength of buyers: the price has fixed above 50 MA and 100 MA.
The MACD histogram is in the positive zone, but below the signal line, which gives a weak signal to buy EUR/USD.
The Stochastic Oscillator is near the oversold zone, the %K line crossed the %D line. There are no signals at the moment.
Trading recommendations
Support levels: 1.09400, 1.09050, 1.08800
Resistance levels: 1.09650, 1.09900, 1.10250
If the price consolidates above 1.09650, expect further correction toward 1.09900-1.10200.
Alternatively, the quotes can drop toward 1.09000.
The GBP/USD currency pair
Technical indicators of the currency pair:
Prev Open: 1.22933
Open: 1.22988
% chg. over the last day: +0.03
Day’s range: 1.22763 – 1.23107
52 wk range: 1.1995 – 1.3385
GBP continues to trade in a long flat. There is no defined trend. At the moment, the local support and resistance levels are 1.22600 and 1.23200, respectively. GBP/USD quotes can decline further. The pound remains under pressure due to uncertainty around Brexit, as well as weak business activity releases in the UK. Positions must be opened from key levels.
At 11:30 (GMT+3:00), the composite business activity index in the UK will be published.
Indicators do not give accurate signalы: the price crossed 50 MA and 100 MA.
The MACD histogram is close to the 0 mark. There are no signals at the moment.
The Stochastic Oscillator is in the neutral zone, the %K line crossed the %D line. There are no signals at the moment.
Trading recommendations
Support levels: 1.22600, 1.22100
Resistance levels: 1.23200, 1.23750, 1.24150
If the price consolidates below 1.22600, expect further descend in GBP/USD quotes toward 1.22200-1.22000.
Alternatively, the quotes could grow toward 1.23600-1.23800.
The USD/CAD currency pair
Technical indicators of the currency pair:
Prev Open: 1.32217
Open: 1.33252
% chg. over the last day: +0.81
Day’s range: 1.33145 – 1.33344
52 wk range: 1.2727 – 1.3664
Yesterday, aggressive purchases were observed on the USD/CAD currency pair. The quotes grew by 100 points. CAD updated the key extremes. The trading tool found resistance at 1.33300. Mark 1.33000 is already a mirror support. Pressure on the Canadian dollar was caused by a collapse in oil prices. We do not exclude further growth of the USD/CAD currency pair. We recommend paying attention to the news background from the USA. Positions must be opened from key levels.
The Economic News Feed for 03.10.2019 is calm.
Indicators signal the strength of buyers: the price has fixed above 50 MA and 100 MA.
The MACD histogram is in the positive zone, but below the signal line, which gives a weak signal to buy USD/CAD.
The Stochastic Oscillator is in the neutral zone, the %K line is below the %D line, which indicates a bearish sentiment.
Trading recommendations
Support levels: 1.33000, 1.32800, 1.32550
Resistance levels: 1.33300, 1.33500
If the price consolidates above 1.33300, expect further growth toward 1.33500-1.33700.
Alternatively, the quotes could decrease toward 1.32800-1.32600.
The USD/JPY currency pair
Technical indicators of the currency pair:
Prev Open: 107.726
Open: 107.178
% chg. over the last day: -0.54
Day’s range: 106.965 – 107.287
52 wk range: 104.97 – 114.56
The USD/JPY currency pair continues to show negative dynamics. During yesterday’s and today’s trading, the drop in quotations exceeded 70 points. The trading instrument reached a round level of 107,000. Mark 107.350 is already a mirror resistance. Demand for USD weakened after weak economic releases. We do not exclude a further decline in the USD / JPY currency pair. We recommend that you pay attention to the dynamics of yield on US government bonds. Positions must be opened from key levels.
The Economic News Feed for 03.10.2019 is calm.
Indicators signal the strength of sellers: the price has fixed below 50 MA and 100 MA.
The MACD histogram is in the negative zone, but above the signal line, which gives a weak signal to sell USD/JPY.
The Stochastic Oscillator is located near the overbought zone, the %K line is above the %D line, which indicates bullish sentiment.
Trading recommendations
Support levels: 107.000, 106.600
Resistance levels: 107.350, 107.650, 107.900
If the price consolidates below the round level of 107,000, expect a further drop toward 106.700-106.500.
Alternatively, the quotes could grow toward 107.600-107.800.