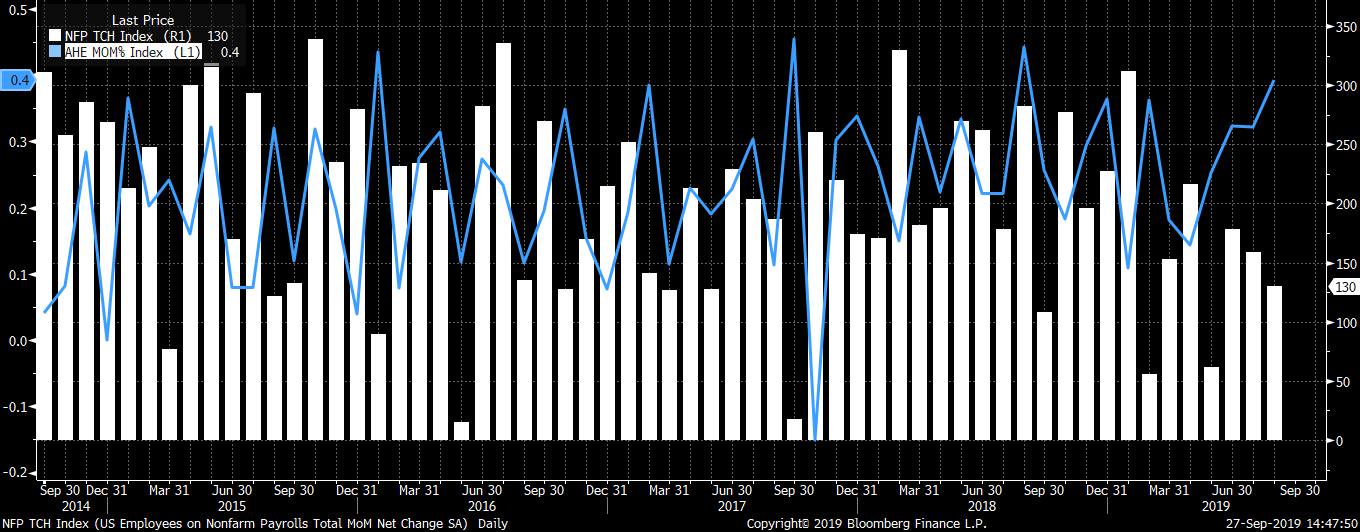
The US dollar has become stable against currency majors. The dollar index (#DX) is consolidating near weekly lows. Financial market participants have taken a wait-and-see attitude before the publication of the US labor market report for September. Recent economic releases from the US were pessimistic. Experts expect mixed data: the number of people employed in the US non-farm sector will accelerate from 130,000 to 145,000; the growth in average hourly earnings will be 0.3% (m/m) compared to the previous value of 0.4% (m/m); the unemployment rate will remain unchanged (3.7%). We recommend paying attention to the difference between the actual and forecasted values of the indicators.
In August, retail sales in Australia accelerated by 0.4%, which was below market expectations at 0.5%. Investors continue to monitor trade negotiations between the US and China, as well as the situation concerning Brexit. Donald Trump said that a delegation from China would come to the US next week to participate in trade negotiations. We also recommend paying attention to the statistics from Canada.
The “black gold” prices have been recovering after a continuous fall. Currently, futures for the WTI crude oil are testing the $52.65 mark per barrel.
Market Indicators
Yesterday, there were purchases in the US stock markets: #SPY (+0.82%), #DIA (+0.49%), #QQQ (+1.10%).
The 10-year US government bonds yield continues to show negative dynamics. At the moment, the indicator is at the level of 1.52-1.53%.
The Economic News Feed for 04.10.2019:
– Report on the labor market in the US at 15:30 (GMT+3:00).
– Ivey PMI in Canada at 17:00 (GMT+3:00).
We also recommend paying attention to the speeches by the FOMC representatives.
As we enter the weekly close with the Non-Farm Payrolls being released shortly, we want to have a look at the USD/JPY.
After the weakest ISM Manufacturing reading since June 2009 last Tuesday (seeing the biggest September contraction since the end of the 2007-2009 recession), the ISM Employment component coming in at 46.3 against 47.4 for August 2019, and Wednesday’s ADP employment disappointing market participants with private business having hired 135k workers in September against 140k expected, today’s Non-Farm Payrolls have a higher likelihood of coming in weaker than the 145k expectation.
If today’s NFPs significantly disappoint by coming in below 100k, another attempt to break back below 106.80/107.00 into the weekly close is a serious possibility.
This is especially true if any further signs of risk aversion start to materialise (impeachment inquiry into US president Trump and/or escalation of the trade dispute between the US and China respectively between the US and Europe). Here, a subsequent wave of selling could already level the path lower to the region around 105.80 into the next week where a drop below 105.80 could trigger further selling, quickly activating the region around 105.00.
Generally and technically, we consider the USD/JPY bearish on a daily time-frame below 108.50/109.00, a region which shouldn’t be attacked today and in the days to come, even if today’s NFPs come in better than expected:
Source: Admiral Markets MT5 with MT5-SE Add-on USD/JPY Daily chart (between August 17, 2018, to October 4, 2019). Accessed: October 4, 2019, at 10:00 PM GMT – Please note: Past performance is not a reliable indicator of future results, or future performance.
In 2014, the value of the USD/JPY increased by 13.7%, in 2015, it increased by 0.5%, in 2016, it fell by 2.8%, in 2017, it fell by 3.6%, in 2018, it fell by 2.7%, meaning that after five years, it was up by 4.1%.
Discover the world’s #1 multi-asset platform
Admiral Markets offers professional traders the ability to trade with a custom, upgraded version of MetaTrader 5, allowing you to experience trading at a significantly higher, more rewarding level. Experience benefits such as the addition of the Market Heat Map, so you can compare various currency pairs to see which ones might be lucrative investments, access real-time trading data, and so much more. Click the banner below to start your FREE download of MT5 Supreme Edition!
Disclaimer: The given data provides additional information regarding all analysis, estimates, prognosis, forecasts or other similar assessments or information (hereinafter “Analysis”) published on the website of Admiral Markets. Before making any investment decisions please pay close attention to the following:
This is a marketing communication. The analysis is published for informative purposes only and are in no way to be construed as investment advice or recommendation. It has not been prepared in accordance with legal requirements designed to promote the independence of investment research, and that it is not subject to any prohibition on dealing ahead of the dissemination of investment research.
Any investment decision is made by each client alone whereas Admiral Markets shall not be responsible for any loss or damage arising from any such decision, whether or not based on the Analysis.
Each of the Analysis is prepared by an independent analyst (Jens Klatt, Professional Trader and Analyst, hereinafter “Author”) based on the Author’s personal estimations.
To ensure that the interests of the clients would be protected and objectivity of the Analysis would not be damaged Admiral Markets has established relevant internal procedures for prevention and management of conflicts of interest.
Whilst every reasonable effort is taken to ensure that all sources of the Analysis are reliable and that all information is presented, as much as possible, in an understandable, timely, precise and complete manner, Admiral Markets does not guarantee the accuracy or completeness of any information contained within the Analysis. The presented figures refer that refer to any past performance is not a reliable indicator of future results.
The contents of the Analysis should not be construed as an express or implied promise, guarantee or implication by Admiral Markets that the client shall profit from the strategies therein or that losses in connection therewith may or shall be limited.
Any kind of previous or modeled performance of financial instruments indicated within the Publication should not be construed as an express or implied promise, guarantee or implication by Admiral Markets for any future performance. The value of the financial instrument may both increase and decrease and the preservation of the asset value is not guaranteed.
The projections included in the Analysis may be subject to additional fees, taxes or other charges, depending on the subject of the Publication. The price list applicable to the services provided by Admiral Markets is publicly available from the website of Admiral Markets.
Leveraged products (including contracts for difference) are speculative in nature and may result in losses or profit. Before you start trading, you should make sure that you understand all the risks.
On Thursday the 3rd of October, trading on the EURUSD pair closed up by 0.05%. The day’s candlestick shows a range of 58 pips.
The pair spent most of its time hovering around 1.0957 before shooting up in the US session. The rate jumped to 1.0999 after which the bulls erased all the gains.
The ISN non-manufacturing index came out at 52.6 (against a forecast of 55.0 and a previous reading of 56.4). This is the lowest it’s been in three years. This has further justified investor fears over an impending economic slowdown.
Day’s news (GMT+3):
15:30 US: unemployment rate (Sep), nonfarm payrolls (Sep), average hourly earnings (Sep), average weekly hours (Sep), trade balance (Aug).
15:30 Canada: imports (Aug), exports (Aug).
17:00 Canada: Ivey PMI (Sep).
20:00 Baker Hughes US oil rig count.
21:00 US: Fed’s Chair Powell speech.
Current situation:
Yesterday was volatile, but the candlestick ended up closing with a small bullish body. Markets are awaiting the US jobs report. The NFP report is expected to record 140k new jobs added in September, against 130k the previous month. We think that markets are actually expecting a lower figure than 140k and that this has already been partially factored in.
Everyone is worried about the reaction to the report. No one knows what to expect. This is a very unpredictable indicator and the actual result almost invariably differs from projections by about 30 – 40k. This is just the average deviation, however, and it could easily differ by up to 100k. Moreover, we will also get revised readings for the previous 2 or 3 months.
The EURUSD pair is currently trading around the balance line (1.0956). Considering that when we get a rise on the euro, a sharp correction follows, it seems unlikely that the single currency will make significant ground against the US dollar. The 112th degree runs through 1.1009. The reaction to Jerome Powell’s remarks is likely to be significant. Everybody wants to know how the Federal Reserve will respond to the weak ISM non-manufacturing index.
Asian stocks are mostly lower, unable to keep in step with the S&P 500 that erased early losses to close higher on Thursday. US equities saw a boost as investors ramp up their expectations that the Federal Reserve will have to roll out more supportive measures before the year is over, following some downcast US economic prints this week.
Looking at the Fed Funds futures, markets are now pricing in a 25-basis point cut for each of the Fed’s two remaining scheduled meetings in 2019. Recent US data point to a 10-year low for its manufacturing PMI, while the services PMI saw its lowest reading since 2016. Although the figures suggest that growth momentum is wavering, US equity bulls are heartened by the prospects of more Fed policy stimulus in the pipeline that should soften the slowdown.
NFP, Powell speech to prompt near-term Dollar moves; Greenback to remain elevated till year-end
The September US non-farm payrolls announcement, as well as Fed chair Jerome Powell’s speech later today, are set to determine the Dollar’s next move. Investors expect a jobs print of 145,000, which would be higher than the 130,000 registered in August.
Should the jobs data underwhelm market expectations, that could translate into another soft patch for the Dollar, as investors solidify their bets that the Fed will have to turn extra dovish. Powell’s remarks will also be sieved for clues as to policymakers’ bias over the coming months, especially following waning confidence over the health of the world’s largest economy.
While the Dollar index (DXY) has moderated to currently trade below the 99.0 psychological level, the bullish trend seen so far in the second half of the year remains intact. Overall, the Greenback should remain elevated going into 2020, fueled by growing concerns over the global economic landscape, as the Dollar’s safe haven status stands in good stead.
US-China trade talks next week set to influence risk sentiment for rest of 2019
The Dollar’s risk to the downside could come from risk-on mode making a comeback, triggered by positive developments in the US-China trade conflict. Much of this rests on the outcome from the keenly-anticipated trade negotiations next week. While it appears very unlikely that a conclusive trade deal will be announced in the near future, any sign of thawing tensions would provide enough justification for investors to venture further into risk-on territory. Headlines suggesting as much could spur gains in Asian currencies and emerging-market assets, at the expense of safe havens.
Disclaimer: The content in this article comprises personal opinions and should not be construed as containing personal and/or other investment advice and/or an offer of and/or solicitation for any transactions in financial instruments and/or a guarantee and/or prediction of future performance. ForexTime (FXTM), its affiliates, agents, directors, officers or employees do not guarantee the accuracy, validity, timeliness or completeness, of any information or data made available and assume no liability as to any loss arising from any investment based on the same.
Traders are looking to the monthly nonfarm payrolls due later this afternoon.
The release will no doubt shape the decision of monetary policymakers.
According to the economists polled, the monthly payrolls for September is forecast to rise 140k in September.
This comes after a disappointing 130k result in August. Payrolls have been disappointing over the past few months.
US Nonfarm Payrolls, August 2019
But this shouldn’t come as a surprise. Despite the headline decrease, the US labor markets remain one of the key pillars of the economy. In July, payrolls added just 159k during the month.
Economists are looking for a 200k print in order to be convinced that the labor market remains robust, which hasn’t been the case in the past couple of weeks.
The US unemployment rate is, however, expected to remain steady at 3.7%. This marks an unchanged print as the unemployment rate sits near a multi-decade low. In the past, the unemployment rate has shifted around.
However, the trends in the unemployment rate show a steady decline. After spiking to 4.0% in January, the US unemployment rate has been steadily declining over the months.
For the past three months, the unemployment rate has been steady at 3.7%.
Wage growth is another component that will be closely watched.
The pace of wage growth has been somewhat sluggish, rising at an average pace of 0.3% in the past couple of months.
The forecasts for September indicate that wage growth will rise 0.3% on a month over month basis. This follows a 0.4% increase in August.
The payroll report for August was consistent with the view that the US economy is slowing. Although the declines do not suggest that a recession is around the order.
Can the Fed’s Cuts Help Boost the Labor Market?
The Federal Reserve lowered interest rates twice this year. First in July and later in September. The Fed cut rates by a total of 50 basis points this year. However, since the July through August period, payrolls have not rebounded.
We expect that it will take at least a few more monthly payrolls before we see whether the rate cuts have any impact. Although not directly impacting the labor markets, lower rates mean that firms get access to cheaper credit.
The next big Fed meeting is due in December. Meaning that policymakers will be closely watching the labor market’s indicators.
A steady decline in the upcoming months will no doubt spur officials to cut rates again. But given the fact that the Fed has maintained a neutral tone so far, investors aren’t too sure if the central bank is shifting to an easing bias.
In July, Fed Chair Powell reminded the markets that the rate cut was not the start of an easing bias but only an adjustment.
This, the payrolls data for September will have some importance. Given the fact that it marks the end of the third quarter, the numbers will be closely watched.
According to various other indicators, the forward-looking GDP trackers are already assigning a sub 2.0% GDP growth in the third quarter. This remains consistent with the slower pace of economic expansion.
There are many headwinds to growth globally. Manufacturing has been steadily declining and the trade war between the US and China isn’t conducive for growth either.
Thus, a lot will depend on just the domestic, but also the global factors.
US stocks retreat halted on Thursday on rising hopes recent weak US data will prompt the Federal Reserve to cut rates again at its October meeting. The S&P 500 rose 0.8% to 2910.63. The Dow Jones industrial average added 0.5% to 26201.04. Nasdaq composite index rallied 1.1% to 7872. The dollar weakening slowed as Labor Department reported the number of Americans applying for new unemployment benefits rose by 6,000 to 219,000 last week: the live dollar index data show the ICE US Dollar index, a measure of the dollar’s strength against a basket of six rival currencies, lost 0.1% to 98.90 and is lower currently. Stock index futures point to mixed openings today.
FTSE 100 falls while CAC 40 gains
European stocks ended marginally lower on Thursday after more weak data. Both EUR/USD and GBP/USD continued rising yesterday and are higher currently. The Stoxx Europe 600 index ended 0.01% lower as Markit’s September final composite PMI for euro-zone came in at 50.1, down from 51.9 in August . The German market was closed for German Unity Day holiday. France’s CAC 40 rose 0.3% while UK’s FTSE 100 fell 0.6% to 7077.64.
Hang Seng falls as emergency is declared
Asian stock indices are mixed today. Nikkei rose 0.3% to 21410.20 despite yen continued climb against the dollar. Hong Kong’s Hang Seng Index is 1.1% lower as Hong Kong’s leader Carrie Lam invoked emergency powers banning face masks among protesters. Australia’s All Ordinaries Index rebounded 0.4% despite continuing Australian dollar climb against the greenback.
Note: This overview has an informative and tutorial character and is published for free. All the data, included in the overview, are received from public sources, recognized as more or less reliable. Moreover, there is no guarantee that the indicated information is full and precise. Overviews are not updated. The whole information in each overview, including opinion, indicators, charts and anything else, is provided only for familiarization purposes and is not financial advice or а recommendation. The whole text and its any part, as well as the charts cannot be considered as an offer to make a deal with any asset. IFC Markets and its employees under any circumstances are not liable for any action taken by someone else during or after reading the overview.
October 3rd, 2019, Limassol (Cyprus). RoboMarkets, a financial company that provides online trading services on the European market, has received a prestigious award, “Leading European Indices Broker”, at “Global Forex Awards 2019” exhibition. Organizers highly appreciated the success of RoboMarkets on the European market and honored the company’s achievements in providing services for trading indices.
Global Forex Awards honors best companies and forex brands on the global and regional scale. Among the winners are the companies that achieved state-of-the-art results in the realization of their projects in areas of high technologies, market researches, educational programs, and provision of quality services on the Forex market. This exhibition is one of the most important Forex events in Europe, where the winners are decided by a popular vote among traders and clients.
Anton Ivanov, RoboMarkets marketing officer, is commenting on the award reception: “We take “Leading European Indices Broker” award as another confirmation of our efficient work in expanding the range and improving the quality of the services we provide. At the same time, it’s a motivation to keep up the speed of our expansion and provide our clients with the most up-to-date and quality professional service, as well as continue working on the improvement of range and scope of services we have to offer”.
About RoboMarkets
RoboMarkets is an investment company with the CySEC license No. 191/13. RoboMarkets offers investment services in many European countries by providing traders, who work on financial market, with access to its proprietary trading platforms. More detailed information about the Company’s products and activities can be found on the official website at www.robomarkets.com.
Non-invasive medical device maker Zynex Inc’s. shares are trading 12% higher on an overall down market day after the company reported that Q3/19 orders are up 95% over the same period in 2018.
This morning medical technology company specializing in manufacturing and selling non-invasive medical devices for pain management, stroke rehabilitation, cardiac monitoring and neurological diagnostics Zynex Inc. (ZYXI:NASDAQ)announced 95% year-over-year order growth for the third quarter 2019.
The firm elaborated in the release that orders in the third quarter of 2019 grew by 95% compared to the third quarter of 2018 and were 30% above the second quarter of 2019. The firm further noted that in the second quarter of 2019, orders grew 65% year-over-year.
The report did not provide specific revenue data or any breakdown of the orders booked by product category. In the same corresponding period in Q3/18 the firm reported revenue of $8.131 million and in Q2/19 the firm previously advised that revenue in that quarter was $10.297 million.
The company’s CEO Thomas Sandgaard commented, “The investment in our sales force expansion is clearly beginning to bear fruit. Our prescription-strength NexWave device is clearly a healthy alternative to prescribing opioids as the first line of defense when treating pain. We continue to aggressively add additional sales reps in territories throughout the U.S. that we have not covered previously…We advocate for pain patients, and for physicians to prescribe our NexWave technology as the first line of defense in treating chronic and acute pain without side effects. We are dedicated to promoting our technology in an effort to remove patient addiction and other side effects from prescription opioids.”
Zynex was founded in 1996 and describes itself as an innovative medical technology company specializing in manufacturing and selling non-invasive medical devices for pain management, stroke rehabilitation, cardiac monitoring and neurological diagnostics. The firm markets and sells its own design of electrotherapy medical devices, which include NexWave, InWave, Electrodes and Batteries, and the company’s proprietary NeuroMove device designed to help recovery of stroke and spinal cord injury patients. The firm’s devices are intended for pain management to reduce reliance on drugs and medications. Zynex indicates that is also developing a new blood volume monitor for use in hospitals and surgery centers.
Zynex shares opened higher today at $10.05 (+$0.32, +3.29%) over yesterday’s $9.73 closing price. The stock has traded today between $9.96 and $11.13/share and currently is trading at $10.90 (+$1.17, +12.02%).
Disclosure: 1) Stephen Hytha compiled this article for Streetwise Reports LLC and provides services to Streetwise Reports as an independent contractor. He or members of his household own securities of the following companies mentioned in the article: None. He or members of his household are paid by the following companies mentioned in this article: None. 2) The following companies mentioned in this article are billboard sponsors of Streetwise Reports: None. Click here for important disclosures about sponsor fees. 3) Comments and opinions expressed are those of the specific experts and not of Streetwise Reports or its officers. The information provided above is for informational purposes only and is not a recommendation to buy or sell any security. 4) The article does not constitute investment advice. Each reader is encouraged to consult with his or her individual financial professional and any action a reader takes as a result of information presented here is his or her own responsibility. By opening this page, each reader accepts and agrees to Streetwise Reports’ terms of use and full legal disclaimer. This article is not a solicitation for investment. Streetwise Reports does not render general or specific investment advice and the information on Streetwise Reports should not be considered a recommendation to buy or sell any security. Streetwise Reports does not endorse or recommend the business, products, services or securities of any company mentioned on Streetwise Reports. 5) From time to time, Streetwise Reports LLC and its directors, officers, employees or members of their families, as well as persons interviewed for articles and interviews on the site, may have a long or short position in securities mentioned. Directors, officers, employees or members of their immediate families are prohibited from making purchases and/or sales of those securities in the open market or otherwise from the time of the interview or the decision to write an article until three business days after the publication of the interview or article. The foregoing prohibition does not apply to articles that in substance only restate previously published company releases. 6) This article does not constitute medical advice. Officers, employees and contributors to Streetwise Reports are not licensed medical professionals. Readers should always contact their healthcare professionals for medical advice.
Precious metals markets enter the often favorable fourth quarter trading season with the potential to reinvigorate their major uptrends.
Despite posting impressive gains in the third quarter, gold and (especially) silver finished it on a downbeat note.
On Monday, sellers smashed silver spot prices down 3.6% to test the $17.00/oz. level.
The disappointing finish to the month and the quarter does raise the possibility that momentum selling could continue to drag prices lower in the near term. However, quarter-end profit taking and portfolio shuffling by institutional futures traders could also work in favor of an immediate price bounce.
The big question is whether silver’s strong breakout this summer to multi-year highs was a fluke… or a prelude to bigger things to come.
At the time, multiple indicators pointed toward it being the real deal – the first big impulsive wave within a larger new cyclical bull market for silver. Price itself is the most important technical indicator, and the silver price had broken out of a long consolidation phase to spike up just shy of $20.00/oz by early September.
The subsequent pullback came as no surprise to our readers. We warned on August 29th, with silver rallying above $18.50/oz, that it “may finally be due for a pause, if not a pullback.” We noted that a gauge of weekly upside momentum was “in extremely overextended territory.”
Now that some of the overenthusiastic speculators who entered the market at higher prices have been washed out, we suspect that the remaining bulls have strong hands and will tend to be buyers rather than sellers on any further price declines.
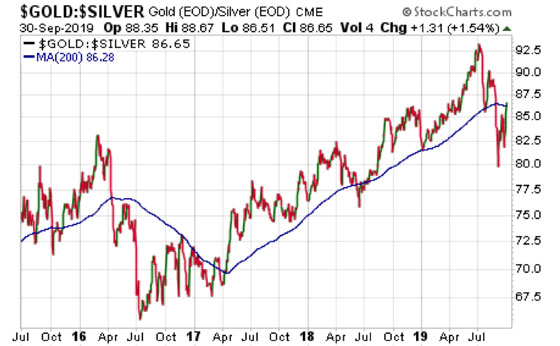
Ratio Trade Opportunities in Silver and Platinum
We will be watching the gold:silver ratio closely during days when precious metals markets rally for confirmation that silver is leading.
In a healthy bull market for the metals, silver leads on both the upside and the downside – both rallying and declining more sharply than gold.
As silver prices surged earlier in the year, the gold:silver ratio declined rapidly from a quarter-century high of over 93:1 to as low as 80:1. In September, the ratio spiked back above 86:1 as silver sold off.
The chart of the gold:silver ratio appearing below suggests we could soon see a turn in favor of silver. In recent years, the ratio has tended to key off its 200-day moving average. It ran straight into that line on Monday.
The 200-day moving average is starting to point down for the first time since 2016. That suggests the major trend for the gold:silver ratio is also down – which, again, would be bullish for silver in particular and precious metals in general.
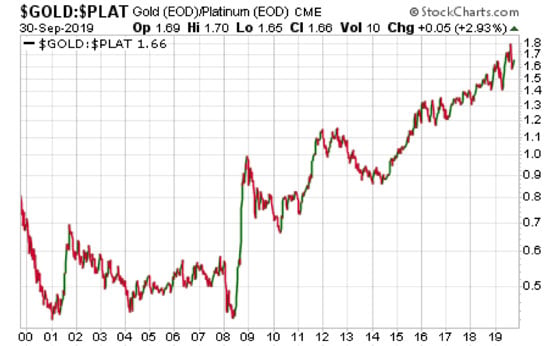
Another ratio that tells an interesting story is that of gold:platinum.
Earlier this year, gold commanded a historically large premium over platinum (1.8:1). Up until the current decade, the norm was for gold to trade at a discount to platinum.
Fundamentally, the platinum market has suffered from softening automotive demand as automakers have favored palladium for use in catalytic converters. Palladium, which historically traded at a discount to platinum, now trades at a premium to both platinum and gold.
At some point, the value proposition offered by platinum should become compelling to both industrial consumers and precious metals investors. But at this particular point, the beaten down metal shows no technical signs of trending higher against either palladium or gold.
The most compelling ratio trade in the metals space at the moment appears to be to favor silver over gold.
Conservative investors will want to still hang on to a core gold position. However, more aggressive investors who are inclined to trade might consider selling gold in exchange for silver.
If the gold:silver ratio trends in favor of silver in the months and years ahead, the magnitude of the move should be more than large enough to offset the transaction costs associated with switching in and out.
For example, if the ratio falls to 32:1 (a level last seen in 2011), then silver would nearly triple in value versus gold. At 32:1, a $1,600/oz gold price would imply $50 silver.
Of course, it’s more likely that gold would show significant nominal appreciation on the way to a 32:1 gold:silver ratio. A $2,500 gold price would imply $78 silver – more than 4.5 times today’s spot silver quote.
These are not price forecasts, but rather just illustrations of potential price scenarios that (among many others) could play out over time. As always, precious metals investors should retain a long-term perspective and be prepared to weather near-term volatility.
The Money Metals News Service provides market news and crisp commentary for investors following the precious metals markets.
Closing out the week for Australia, we have the first potentially market-moving economic data after the RBA meeting.
As expected, the bank cut interest rates. But that only leaves open the question as to when it will cut them again.
So, it’s back to tracking data! Especially those related to employment, since that’s what Governor Lowe reiterated the central bank was intent upon.
Given the slashed rate, the expectation would be that consumer sentiment should improve as more money is available to the market.
Lower rates are meant to be a disincentive for savers and incentivize taking on debt with cheaper loans. However, retail sales have remained below since the best result this year, before the RBA started cutting rates.
The Other Events
We should note that the RBA will be publishing its Financial Stability Report at the same time as the Retail Sales data.
Because we just had a meeting, the effect of the FSR is likely to be dwarfed by the sales data. Though analysts will be looking for clues as to how the central bank sees the economy evolving over the next six months.
The report could change some of the math around when the next rate cut is.
Currently, we aren’t expecting the RBA to take action until next year.
There are just two more policy meetings before January. But, with the rate approaching zero, analysts are now on the hunt for comments relating to unconventional measures that the RBA might take if they don’t get the desired rebound in the economy.
What to Expect from the Data
Expectations are for monthly retail sales to have increased by just 0.2% in September, compared to -0.1% in August.
The average growth in consumer spending over the last couple of years has been around 0.3%. In fact, results above 0.5% are rare. Ups and downs in the data series are normal, but there are some possibilities of a stronger market reaction.
While negative results are common, generally they are one-offs. If the results were to disappoint into negative territory, we could see some further weakness in the AUD.
On the other hand, a result above 0,5% would potentially see strength in the currency. It might be indicative of the RBA’s policy finally having an effect.
The Unconventional Data
Lost in the discussion about the effects of the trade war, and the slump in the Australian economy is the importance of foreign shopping.
Australia is the primary foreign destination for luxury shopping outside of China for Chinese nationals. And they represent a substantial portion of retail trading.
With the currency controls put in place by China in response to the ramp-up in tariffs from the US, it was initially thought that Chinese shopping in Australia would take a hit.
While Chinese investment did drop, this was not reflected in luxury spending. This is especially true in Melbourne and Sydney. In fact, not only are existing luxury brands stepping up their investments in the area, but more brands are opening up new locales.
The best performers are independent retail sellers, who are able to offer a personalized experience to customers wary of buying online.
As the antipodean summer kicks off, an increase in tourist arrivals could help keep retail sales healthy despite other structural issues in the economy. Visitors might keep the service sector performing even if exports are still under pressure.
However, unless it translates into inflation, it’s not likely to interest the RBA.