On Monday the 7th of October, trading on the EURUSD pair closed 0.06% down. The rate jumped to 1.1001 during the European session before slipping to 1.0969 during the US session. These fluctuations were brought about by weak German data, comments from Neil Kashkari, and uncertainty over US-Chinese trade talks.
The factory orders index in Germany dropped by 0.6% against a forecast of -0.3%. There’s an increased likelihood of the German economy going into recession.
Minneapolis Fed President Neil Kashkari said that the Fed should continue to slash interest rates. This is a necessary measure to prevent risks to the economy and to grow wages. The next FOMC meeting is at the end of the month.
Negotiators began talks on the 7th of October ahead of the meeting between the Chinese Vice Premier and US Trade Representative, which is planned for Thursday. Reuters has reported that these talks are taking place amid a tense atmosphere, with neither side showing signs of compromise.
Day’s news (GMT+3):
7:10 UK: BoE’s Governor Carney speech.
15:15 Canada: housing starts (Sep).
15:30 Canada: building permits (Aug).
15:30 US: PPI (Sep).
21:30 US: Fed’s Chair Powell speech.
23:30 US: API weekly crude oil stock (4 Oct).
Current situation:
The pair reached its predicted target, only after a drop below the trend line. We allowed for a false breakout given the upcoming talks as well as the disappointing German data.
This week, attention is turned towards the publication of the FOMC minutes and the trade talks between the US and China (10th and 11th of October). US trade advisor Larry Kudlow has hinted that the two sides may make some progress during the negotiation process.
At the time of writing, the euro is trading at 1.0981. The pair is currently around the balance line. The formation from 1.0999 (03/10) has a bearish feel to it, but since geopolitics are currently taking centre stage, the pair could exit the 1.0958 – 1.1000 range in any direction. It’s better to look at making trades at the boundaries of this channel. With the pair trading in the middle of the channel, there are high stop levels and a higher risk of triggering them.
Gold struggles to defend $1500 as Dollar stabilizes
High level trade negotiations will certainly be the major theme this week as Chinese officials head to Washington to resume talks with their US counterparts.
Given the unfavorable global macroeconomic conditions and growing pain manufacturers are feeling from protracted trade disputes, markets are cautiously optimistic for some progress in trade talks. However, any hopes of a major breakthrough deal are being quashed by mixed messages from the United States and China. It was only on Monday, the Trump administration blacklisted 28 Chinese organizations which essentially restricted their ability to do business with American firms. This move by the Trump administration will most likely strain US-China relations and add to the growing list of barriers preventing a major breakthrough anytime soon.
Nevertheless, an interim deal that halts the scheduled tariff hikes on Chinese goods coming into effect on October 15th will be warmly welcomed by investors across the globe. Fresh signs of both sides expressing interest for further discussions should offer some light at the end of the long trade war tunnel.
Asian stocks are flashing green on Tuesday amid trade hopes and this sentiment could lift European stocks later in the day.
Another rollercoaster week for the Pound
This will be another choppy trading week for the British Pound as investors evaluate whether the United Kingdom and Brussels will be able to strike a Brexit deal before the EU summit on October 17-18. With just over three weeks till the October 31st Brexit deadline, the clock is ticking with the hourglass almost empty. Will Prime Minister Boris Johnson be able to secure a last-minute deal with the European Union? Will he be forced to ask Brussels for an extension if Parliament has not agreed to leave the EU with or without a deal by October 19th? Or is Britain on route to crashing out of the European Union on October 31st?
The outlook for the Pound remains clouded by uncertainty and this continues to be reflected in the currency’s valuation. GBPUSD remains under pressure on the daily charts. A breakdown below 1.2250 should open the doors towards 1.2200 and 1.2080.
Commodity spotlight – Gold
Gold is struggling to push back above the psychological $1500 level on Tuesday thanks to a firmer Dollar and cautious optimism over US-China trade talks. While the precious metal may depreciate in the near term, the downside losses will be limited by core market theme draining risk sentiment.
Where the metal concludes this week will be heavily influenced by high-level trade talks between the United States and China. A market friendly outcome that paves the way to further negotiations could send Gold prices sinking towards the $1485 level. Alternatively, if the negotiations disappoint markets and fuel risk aversion, Gold bulls should be injected with enough confidence to challenge $1515 and $1525.
Disclaimer: The content in this article comprises personal opinions and should not be construed as containing personal and/or other investment advice and/or an offer of and/or solicitation for any transactions in financial instruments and/or a guarantee and/or prediction of future performance. ForexTime (FXTM), its affiliates, agents, directors, officers or employees do not guarantee the accuracy, validity, timeliness or completeness, of any information or data made available and assume no liability as to any loss arising from any investment based on the same.
US stocks pulled back on Monday after reports the Chinese Commerce Ministry will not make “changes to their laws to protect intellectual property” while willing to strike a deal with US. The S&P 500 finished 0.5% lower at 2938.79. Dow Jones industrial lost 0.4% to 26478.02. The Nasdaq composite slid 0.3% to 7956.29. The dollar strengthening resumed: the live dollar index data show the ICE US Dollar index, a measure of the dollar’s strength against a basket of six rival currencies, rose 0.2% to 98.98 but is lower currently. Stock index futures point to lower openings today.
DAX posts biggest gain among European indexes
European stocks extended gains on Monday despite weak economic data. EUR/USD joined GBP/USD’s slide yesterday with euro turning higher currently while Pound still lower. The Stoxx Europe 600 index ended 0.7% higher led by chemicals and energy shares. The DAX 30 rose 0.7% to 12097.43 despite report German industrial orders for August fell by more than expected on weaker domestic demand. France’s CAC 40 added 0.6% and UK’s FTSE 100 gained 0.6% to 7197.88 as Prime Minister Boris Johnson on Sunday reiterated his intention for the UK to leave the EU on October 31.
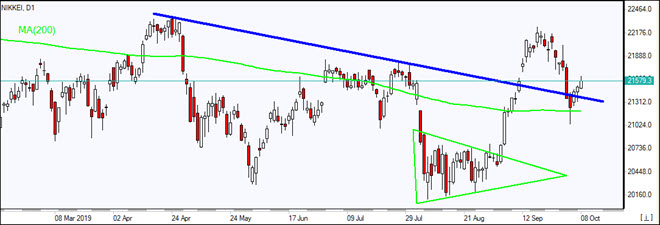
Nikkei leads Asian indexes gains as Japan signs trade deal with US
Asian stock indices are gaining today. Nikkei rose 1% to 21587.78 as Japan on Monday signed a limited trade deal with US returning US farmers benefits they lost when Trump pulled the US out of the Trans-Pacific Partnership in 2017. Markets in China are rising despite US blacklisting 28 Chinese public security bureaus and companies on Monday by adding them to the so-called Entity List: the Shanghai Composite Index is up 0.3% and Hong Kong’s Hang Seng Index is 0.3% higher. Australia’s All Ordinaries Index added 0.5% despite resumed Australian dollar climb against the greenback.
Brent futures prices are edging higher today after marginal decline Monday despite OPEC report its output fell in September 1.48 million barrels a day from August: December Brent crude closed 2 cents lower at $58.35 a barrel on Monday.
Note: This overview has an informative and tutorial character and is published for free. All the data, included in the overview, are received from public sources, recognized as more or less reliable. Moreover, there is no guarantee that the indicated information is full and precise. Overviews are not updated. The whole information in each overview, including opinion, indicators, charts and anything else, is provided only for familiarization purposes and is not financial advice or а recommendation. The whole text and its any part, as well as the charts cannot be considered as an offer to make a deal with any asset. IFC Markets and its employees under any circumstances are not liable for any action taken by someone else during or after reading the overview.
Despite the gravity of an impeachment inquiry that threatens to bring down the presidency of Donald J. Trump, markets have largely shrugged it off.
The reason? Odds of a two-thirds majority in the Republican-controlled Senate voting to remove Trump from office are slim.
What has Wall Street more concerned are the rising odds of Elizabeth Warren becoming the Democrat nominee for president. Her surge (and Joe Biden’s weakness) in the polls may have even contributed to some of last week’s stock market volatility.
The Democrats’ 2016 nominee, Hillary Clinton, was a status quo candidate who had the backing of billionaires, bankers, and big tech. Warren, on the other hand, worries wealth holders of all stripes with her proposals to break up some of America’s largest corporations and impose an array of confiscatory new taxes.
One of Warren’s signature campaign promises is to impose a “wealth tax.” It would introduce a dangerous new concept into the tax code – namely that the government gets to tax not just capital gains on investments, but also the market value of investments and other household assets taken together.
Under Warren’s plan, the government would take 2% of a household’s assets above $50 million. The tax would increase to 3% for wealth above $1 billion.
Of course, it is being marketed as a tax on “the rich.” That’s how the income tax was initially sold to the American people. As we now know, the thresholds for how “rich” gets defined can quickly slide into the middle class.
As proposed, Warren’s wealth tax would generate just over $200 billion per year. That’s not even close to enough to cover the current annual budget deficit of $960 billion (and rising), let alone the laundry list of new spending programs Warren wants to roll out.
Once imposed on a small segment of wealthy Americans, a wealth tax would become a revenue source for a chronically over-spending government that could be gradually expanded to capture more and more Americans’ wealth.
Imagine having to account for the value of all your assets – from your financial accounts to your home, your car, and your personal possessions.
Consider an example that “Pocahontas” might identify with: a collection of Gold Indian Head coins.
You might have held some of these U.S. coins, originally minted in the early 1900s, secretly in a safe for decades without ever needing to account for their value. Under current law, they generate no tax liabilities or reporting requirements until they are sold or bequeathed.
Under a wealth tax, gold coins and other tangible assets in your possession could get an annual scalping by the government.
Regardless of whether such a proposal ever gets enshrined into law, the government will be looking for ways to raise revenues in the years ahead as budget deficits expand. One way to hedge against a Warren wealth tax and other forms of tax increases on investments is by moving assets you want to protect into a tax-sheltered IRA.
For now, at least, the rules are clear: the government can’t tax IRA assets, including IRA-eligible physical precious metals products, until you take distributions. And with a Roth IRA, you may be able to avoid taxes completely even as tax risks rise.
The Money Metals News Service provides market news and crisp commentary for investors following the precious metals markets.
Uganda’s central bank lowered its Central Bank Rate (CBR) by 100 basis points to 9.0 percent, saying it believes “the benign inflation outlook provides room for a reduction in the policy rate to support economic growth.”
It is Bank of Uganda’s (BOU) first rate change since it raised the rate by the same amount in October 2018, returning its key rate to the level it was between February 2018 and October that year.
BOU sharply lowered its inflation forecast.
“The economy continues to grow but at a slowing rate,” BOU said, noting gross domestic product slowed in the first half of 2019 from the second half of 2018 and the Composite Index of Economic Activity (CIEA) points to moderation of economic activity in the first quarter of the current 2019/20 financial year, which began July 1.
Uganda’s GDP eased to annual growth of 5.4 percent in the second calendar quarter from 5.6 percent in the first quarter and in August BOU Governor Emmanuel Tumusiime-Mutebile had forecast growth in 2019/20 of 6.0 to 6.3 percent.
“The outlook is uncertain, particularly as a result of the unfavorable global economy,” BOU said, adding a combination of widening fiscal and current account deficits could exert pressure on lending interest rates, leading to a further decline in economic growth.
Inflation in Uganda has been decelerating in the last three months and headline inflation fell to 1.9 percent in September from 2.1 percent in August, partly driven by a stronger shilling, moderating domestic demand and lower food prices.
Core inflation fell to 2.5 percent in September from 4.9 percent in June.
BOU lowered its forecast for core inflation to remain below its 5.0 percent target until the fourth quarter of 2020, with the risks to the downside and inflation forecast to converge to the target in the medium term, or over 2-3 years as demand side pressures remain subdued and the exchange rate is expected to remain relatively stable.
The revision to BOU’s inflation forecast follows Tumusiime-Mutebile’s forecast in August that core inflation would edge up and peak in the in the fourth quarter of 2020 at about 6.5 percent.
The Bank of Uganda released the following statement:
“Bank of Uganda (BoU) has in the October 2019 Monetary Policy Committee (MPC) meeting decided to reduce the Central Bank Rate (CBR) by 1 percentage point to 9 percent in response to the expected path of macroeconomic indicators and the international economic environment. The economy continues to grow but at a slowing rate. Economic activity seems to have slackened in the first half of 2019 compared to the second half of 2018. Indeed, the recently released quarterly GDP estimates by Uganda Bureau of statistics (UBOS) indicate that GDP growth slowed in the second half of Financial Year (FY) 2018/19. In addition, the BoU’s high frequency indicator of economic activity, the Composite Index of Economic activity (CIEA), points to a moderation of economic activity in the first quarter of FY 2019/20. The outlook is uncertain, particularly as a result of the unfavourable global economy. Moreover, a combination of widening fiscal and current account deficits, coupled with public sector domestic financing needs, could exert pressure on the lending interest rates leading to further moderation of economic growth. The Consumer Price Index (CPI) data for September 2019, released by UBOS, indicates that inflation remained subdued. Annual headline and core inflation declined to 1.9 percent and 2.5 percent, respectively from 2.1 percent and 2.7 percent in August 2019. The decline in inflation was in part driven by a relatively stronger shilling, moderation of domestic demand and lower food prices. Food crops inflation declined from minus 1.4 percent in August 2019 to minus 3.0 percent in September 2019. However, Energy Fuel and Utilities (EFU) inflation rose to 2.5 percent in September 2019 from 1.0 percent in August 2019.
The inflation outlook has been revised downwards compared to the August 2019 round of forecast. Annual core inflation is now projected to remain below the 5 percent target until the fourth quarter of 2020. The risks to the inflation outlook in the near term (12 months ahead) are assessed to be largely on the downside and inflation is forecast to converge to the target of 5 percent in the medium-term (2-3 years). Demand side pressures remain subdued. In the absence of shocks, the relative stability of the exchange rate is expected to continue. The BoU believes that the benign inflation outlook provides room for a reduction in the policy rate to support economic growth. The economy still has spare capacity and lower interest rates will help reduce the output gap. Against this backdrop, the BoU has decided to reduce the CBR by 100 basis points to 9 percent. The band on the CBR will remain at +/-3 percentage points and the margin on the rediscount rate and bank rate will remain at 4 and 5 percentage points on the CBR, respectively. Consequently, the rediscount rate and the bank rate have been set at 13 percent and 14 percent, respectively. Going forward, the BoU will continue to monitor emerging price and output developments to ensure that monetary policy decisions remain consistent with price stability while being supportive of sustained non- inflationary economic growth over the medium term.” www.CentralBankNews.info
It looks like we could be in for some volatility in AUD pairs this week, with some key events expected.
To start with, we get a deeper look at the Australian economy and how experts expect it to evolve over the next six months thanks to the release of the NAB Business Confidence Survey.
Unprecedented actions have been taken by the RBA to prop up the Australian economy. In light of this, the hope would be for businesses to be taking advantage of the lowered borrowing costs to expand and support the economy.
However, surveys show that domestic demand remains weak, and that government spending initiatives are what’s supporting the economy.
Without economic expansion, it’s unlikely for the AUD to strengthen in the near term.
What Are We Looking For?
Expectations are for NAB Business confidence to further deteriorate.
However, there isn’t a firm consensus on a particular figure, yet. But with September’s results at 1, “lower than prior month” expectations imply at best 0, and from there into negative territory (contraction).
That would be the first time that Business Confidence has been this bad since the post-GFC drop in commodity prices circa mid-2013.
NAB splits off the business conditions segment, which contains the evaluation of the current situation. Typically it’s higher than the confidences segment, which contains the outlook for the next six months.
With lower expectations for growth, it would imply a lower AUD in the future. This keeps the AUDUSD in the downward channel it’s been maintaining since near the beginning of the year.
So the RBA Didn’t Do Anything?
The view of the National Australia Bank’s analysts, both the recent tax and rate cuts have may “have had little impact” on the outlook for the economy. Consumer demand remains weak, leaving many businesses with higher inventory and keeping production capacity low.
The measure of employment remains steady, with expectations that businesses will retain their current workforce.
But, on the other hand, expectations of profitability have already dropped into negative. The combination of these indicators shows that businesses are choosing to withstand lower margins in order to keep from cutting headcount.
This is not a long-term sustainable condition. And, if profitability projections continue to fall, job cuts and rising unemployment could be in the future.
But Commodity Prices?
Despite the consternation surrounding the trade war between the US and China, commodity prices remain high, even if we consider the downturn last month.
Australia’s exports remain healthy, setting records even as the economy floundered.
On the other hand, cash flows turned negative last quarter for the first time since 1980. Officials are refusing to address this, even as the drop in interest rates continues to discourage carry traders.
The primary source of carry trading, Japan, has not cut rates. And the RBA is moving faster than the Fed. As the yield spread drops, there is little incentive to invest capital in Australia.
Saying that the RBA had little effect on borrowing might not be all that accurate for the wrong reasons: private lending topped out at a record high a couple of months ago.
It dropped after the RBA’s actions, as did consumer sentiment.
The Markets Going Forward
Unless there is a major surprise to the upside in business sentiment, the current situation doesn’t appear to provide reasons for medium-term strength in the AUD. It will be interesting to review Q3 earnings reports since that’s when businesses adjust their final Capex expectations.
It would be the last chance for support to the AUD from corporate spending.
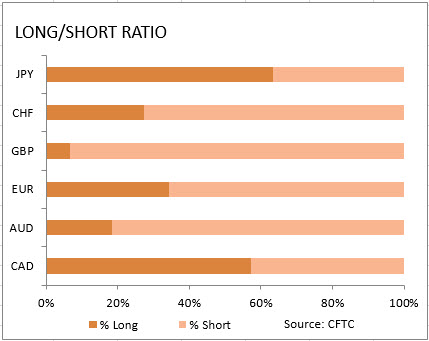
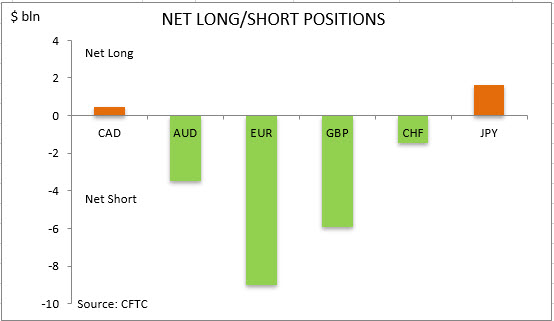
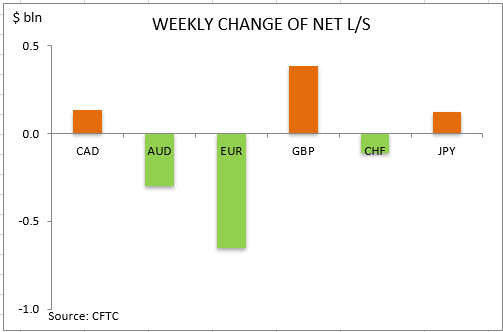
US dollar net long bets rose to $17.80 billion from $17.34 billion against the major currencies during the one week period, according to the report of the Commodity Futures Trading Commission (CFTC) covering data up to October 1 and released on Friday October 4. The ICE US Dollar index USDX rose despite weak Institute for Supply Management report: ISM data showed the manufacturing index slipped from 49.1 to 47.8 for September, with readings below 50 indicating contraction.
Note: This overview has an informative and tutorial character and is published for free. All the data, included in the overview, are received from public sources, recognized as more or less reliable. Moreover, there is no guarantee that the indicated information is full and precise. Overviews are not updated. The whole information in each overview, including opinion, indicators, charts and anything else, is provided only for familiarization purposes and is not financial advice or а recommendation. The whole text and its any part, as well as the charts cannot be considered as an offer to make a deal with any asset. IFC Markets and its employees under any circumstances are not liable for any action taken by someone else during or after reading the overview.
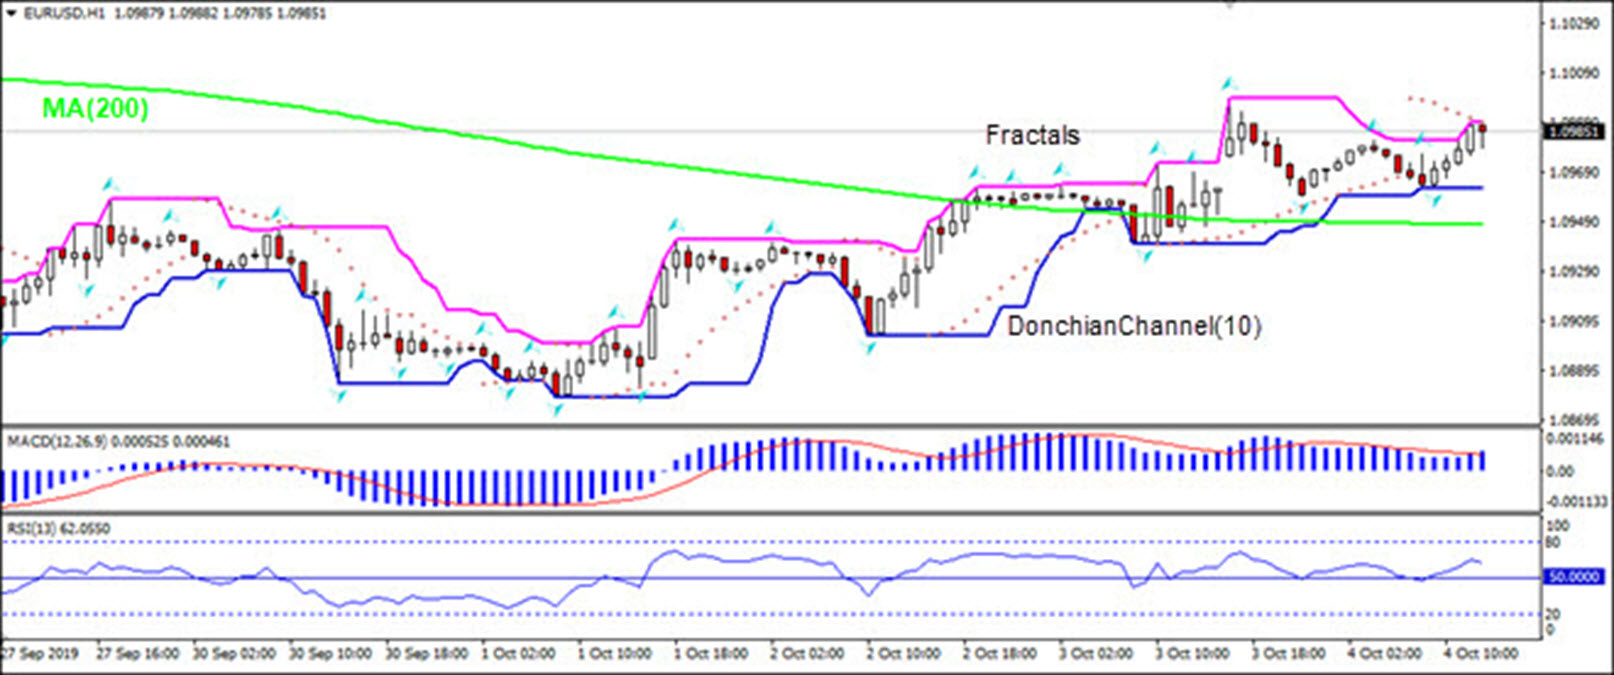
German factory activity decline bearish for EURUSD
German factory orders declined over month in September more than expected. Will the EURUSD decline?
The price chart on 1-hour timeframe shows EURUSD: H1 is trading sideways. The price is above the 200-period moving average MA(200) which is falling. And the RSI is rising above 50 level but has not reached the overbought zone. There is no trend yet formed, traders have to decide when it would be a best time to enter the market.
Sector expert Michael Ballanger offers his observations on recent market fluctuations.
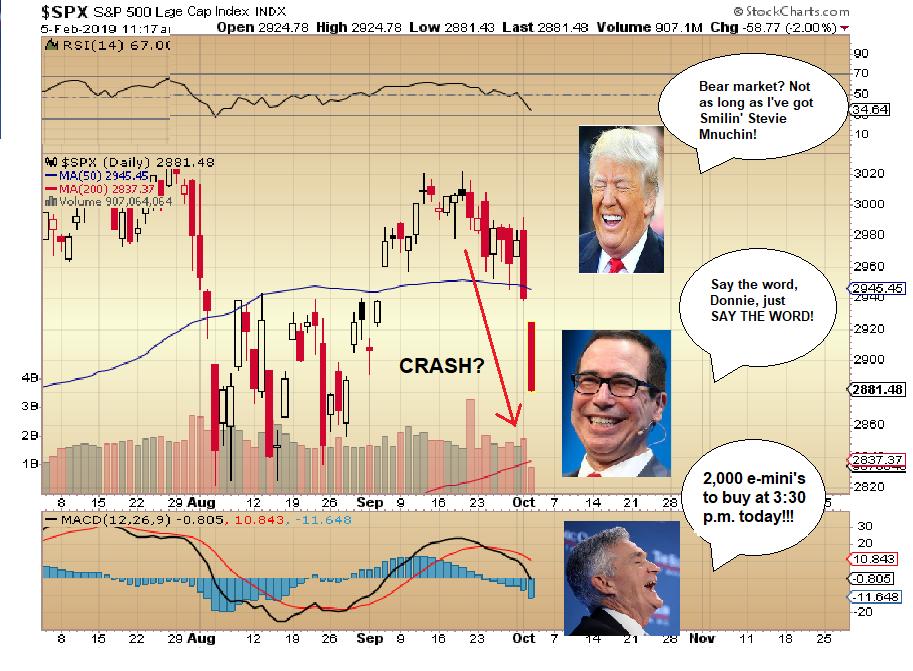
On Wednesday, as the kiddies were upset over a swooning S&P, then trading a paltry 5% from the all-time high of 3,027, I tweeted out this graphic that perfectly describes my cynical view of the paper markets around the world.
What prompted me to exercise my artistic flair was that the screams were loudest in the world of social media where the Millennial Horde had leveraged Mommy’s 2018 BMW Roadster convertible in order to trade S&P futures from the long side. “Cut rates!” they type-screamed using CTRL-B,U,I for emphasis; “Do the China Deal, Donald!” as margin calls came flooding into their inboxes. And as surely as the sun rises and gold gets hammered on an NFP Friday, the invisible hand reached out and rescued them with mercurial deft and timely precision. All is now right with the world, and stocks are charging back toward the highs with a 57-point turnaround in the S&P in less than two trading sessions. As I tweeted out [yesterday], it was (and is) laughingly predictable.
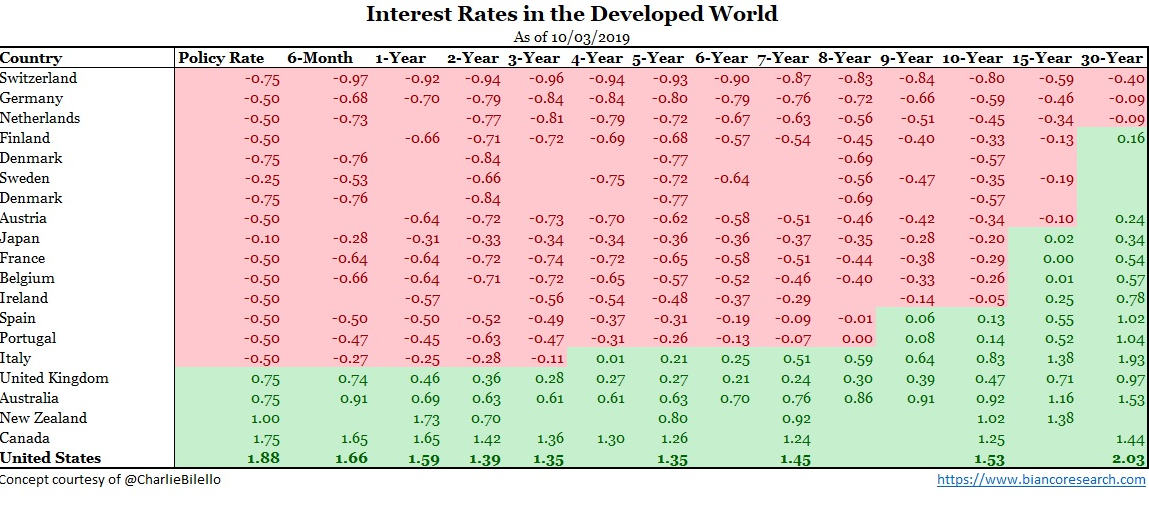
Now, to underscore the absurdity of this obsession with rising stock markets, take a peak at the next graphic courtesy of Bianco Research. The pink section is all bonds trading at a negative yield, while the green is what would be historically “normal”you know, a bond that pays the holder that is taking all of the risk a positive return. Is it any wonder that money managers around the world are all flooding into stocks, when over 50% of sovereign (not corporate) bonds are penalizing their owners?
Do any of you recall the term “lender of last resort?” That term refers to the reason why sovereign bonds and bills are assigned a heavenly credit rating, which assumes that, because they own and control the power of taxation, there will always be a working population upon which governments can rely for interest coverage. Where corporations and individuals can file for bankruptcy protection in favor of the bondholder, sovereign nations enjoy the realm of privilege and are blindly obeyed until exogenous shocks to the status quo occur, which place a sovereign nation in default.
The last two countries to default on debt were Greece and Venezuela, and while Greece has had its standard of living stabilized under the shelter of the ECB (European Central Bank) umbrella, Venezuela has no such safety net and its citizens are suffering a malaise not unlike Wiemar Germany 19211923 or Zimbabwe post-1986. Now look at this list of countries on “credit default watch,” as measured by spreads on credit default swaps.
Ukraine
Pakistan
Egypt
Brazil
South Africa
Russia
Portugal
Kazakhstan
Turkey
Vietnam
Around the turn of the century, there was an acronym that combined four countries believed to be global growth drivers for the new millennium, then known as BRIC (Brazil, Russia, India and China). They were the darlings of the Wall Street analytical community for years until quite recently. For reasons beyond all logic, two out of four of them are now on the “watch list” (Brazil and Russia), with China’s current trade war with the West and its suspect shadow banking system making them a soon-to-be-added member. South Africa used to be one of the most dependable and credit-worthy countries on the planet until a socialist thug took over (sharing a common history with Venezuela), and Brazil was once lauded and applauded for its thriving mining and agricultural foundations. Even Germany, the industrial and political backbone of the ECB, has not one bond or bill yielding positive returns.
I submit to you, my friends, that the malaise to which I refer, starting with the blatant control of all markets (bonds, stocks, Forex and commodities) by government interference is symptomatic of the accelerating early stages of a massive global debt disease. You have read my thoughts on “mistrust“; now you actually can quantify it in the chart shown above. Those negative yields are a wailing air-raid siren, just like 1941 London, and the 2019 version of the Luftwaffe is debt, pure and simple.
The best and only real defense against a debt implosion is to have your wealth held outside of the traditional banking system, because as we have seen in the countries over time that have defaulted, governments, aided and abetted by their police and armed forces, think nothing of confiscating your wealth “for the common good,” meaning, for their “job security.” They cannot confiscate that which they don’t see, which is precisely why they are jamming the notion of a “cashless society” down your throat. However, this is a very well-trodden path of discussion and debate that you have all heard and read before, so I shall move along.
Nothing new to be seen here:
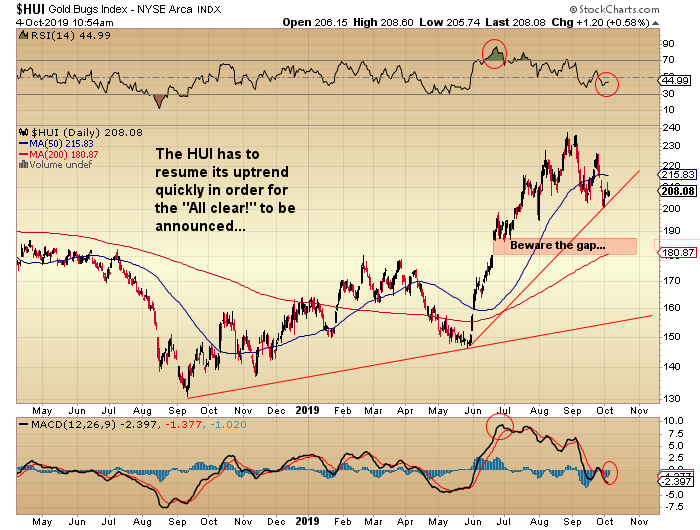
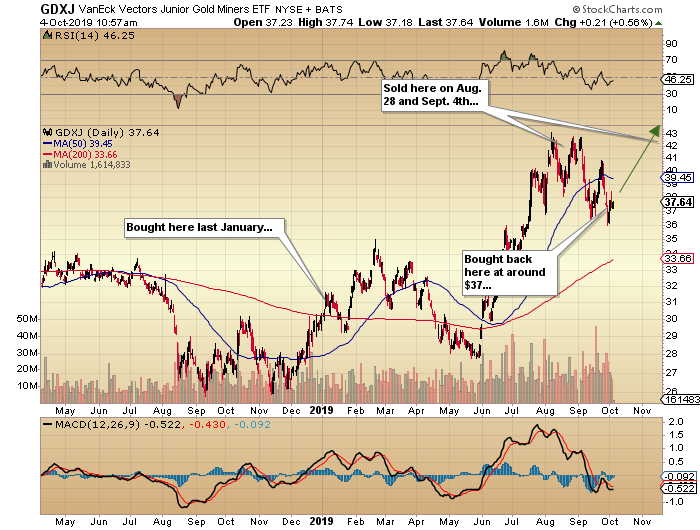
The gold miners, as represented by the HUI (ARCA Gold Bugs Index), have treated me very well thus far in 2019, and while I lament the early exit from the leveraged ETFs (NUGT/JNUG), I did make decent money on both. But where I made “the cut” was on the exits of GDX, GDXJ, GBR.V., and the SLV calls, all in that topping window from Aug. 28 until Sept. 5.
The hate mail I received was nothing short of profane, and in some cases threatening. While I looked on dispassionately, I dumped all of my precious metals paper holdings while retaining all physical positions in gold and silver. I have now started accumulating from the long side of the paper markets (miner ETFs), and have initiated a small position in the SLV December $18 calls, with two purchases in the past two weeks at $0.23 and $0.47, for an average price of $0.35. I look for a retest of the $18.35 high before year-end. As I stated a few missives ago, I feel far more comfortable owning these positions, with small losses or break-evens, than being on the sidelines with a pile of rotting cash, just sitting there in the full envious view of bankers and government bureaucrats.
As to gold and silver, my only point of concern is the gap shown above in the HUI chart. There is an old saw all gaps must be closedand whether or not this one proves to be true shall remain to be seen. I have chosen to disregard it because the cause of the gap was a runaway up-thrust in gold after the $1,375/ounce breakout. Like so many other “rules” that gold and silver have tossed aside since June, I am aware of the gap but simply not acting upon it.
As I am writing this on Friday morning due to an afternoon engagement, I will not be able to comment on the COT until Monday. But suffice it to say that I expect a massive reduction in the aggregate shorts in gold held by Commercials, offset by a similar reduction in longs held by Large Speculators. Watching the plunge in open interest and the sudden and very mysterious halt in the declines of the precious metals, it is eerily reminiscent of the same “mysterious” action when it topped on Sept. 4. It is the Commercial Cretins at work doing exactly what they have been doing for ages because it is obvious that the RICO action brought against JP Morgan has done squat to deter their criminal behaviors.
I urge you all to follow me on Twitter (@Miningjunkie ) in order to get all of the intraday musings (and trading suggestions) that pertain to this abomination called the stock “market.” The month of October is hard upon us and as the intraday events happen too fast for e-mail, Twitter notifies followers of opportunities within seconds. In this world of algobots and managed prices, speed is a tactical advantage and Twitter is one application that delivers.
Originally trained during the inflationary 1970s, Michael Ballanger is a graduate of Saint Louis University where he earned a Bachelor of Science in finance and a Bachelor of Art in marketing before completing post-graduate work at the Wharton School of Finance. With more than 30 years of experience as a junior mining and exploration specialist, as well as a solid background in corporate finance, Ballanger’s adherence to the concept of “Hard Assets” allows him to focus the practice on selecting opportunities in the global resource sector with emphasis on the precious metals exploration and development sector. Ballanger takes great pleasure in visiting mineral properties around the globe in the never-ending hunt for early-stage opportunities.
Disclosure: 1) Statements and opinions expressed are the opinions of Michael Ballanger and not of Streetwise Reports or its officers. Michael Ballanger is wholly responsible for the validity of the statements. Streetwise Reports was not involved in any aspect of the article preparation. Michael Ballanger was not paid by Streetwise Reports LLC for this article. Streetwise Reports was not paid by the author to publish or syndicate this article. 2) This article does not constitute investment advice. Each reader is encouraged to consult with his or her individual financial professional and any action a reader takes as a result of information presented here is his or her own responsibility. By opening this page, each reader accepts and agrees to Streetwise Reports’ terms of use and full legal disclaimer. This article is not a solicitation for investment. Streetwise Reports does not render general or specific investment advice and the information on Streetwise Reports should not be considered a recommendation to buy or sell any security. Streetwise Reports does not endorse or recommend the business, products, services or securities of any company mentioned on Streetwise Reports. 3) From time to time, Streetwise Reports LLC and its directors, officers, employees or members of their families, as well as persons interviewed for articles and interviews on the site, may have a long or short position in securities mentioned. Directors, officers, employees or members of their immediate families are prohibited from making purchases and/or sales of those securities in the open market or otherwise from the time of the interview or the decision to write an article until three business days after the publication of the interview or article. The foregoing prohibition does not apply to articles that in substance only restate previously published company releases.
Charts provided by the author.
Michael Ballanger Disclaimer: This letter makes no guarantee or warranty on the accuracy or completeness of the data provided. Nothing contained herein is intended or shall be deemed to be investment advice, implied or otherwise. This letter represents my views and replicates trades that I am making but nothing more than that. Always consult your registered advisor to assist you with your investments. I accept no liability for any loss arising from the use of the data contained on this letter. Options and junior mining stocks contain a high level of risk that may result in the loss of part or all invested capital and therefore are suitable for experienced and professional investors and traders only. One should be familiar with the risks involved in junior mining and options trading and we recommend consulting a financial adviser if you feel you do not understand the risks involved.
The US dollar has started the week on a soft note with the dollar index trading 98.58 last, reversing from earlier highs on the session.
USD has been following a string of poor data sets recently. On Friday, the headline NFP figure came in at just 136k, narrowly beating the 130k forecasts.
The results reflected a sluggish month for the US economy which also saw softer-than-expected manufacturing and non-manufacturing readings for September.
Euro Lower
EURUSD has been a little lower today, despite the weakness in USD as concerns for the state of the eurozone economy keep the outlook bearish.
Data sets have continued to trend lower over the last month meaning that the ECB might not yet be done with easing.
EURUSD trades 1.0937 last. In the absence of any key domestic data this week, EUR flows likely to be tied to trade war and Brexit headlines.
GBP Consolidates Further
GBPUSD price action has become very congested over recent days as traders wait for news on the UK Brexit negotiations.
The UK is expected to receive a decision from the EU this week regarding the new proposals submitted by the UK PM last week.
The UK currently has until October 19th to reach a deal or the PM is required to request an extension to Article 50. GBPUSD trades 1.2306 last.
Waiting on Trade War Updates
Risk assets have had a soft start to the week as uncertainty ahead of the next round of US-China trade talks due this week is keeping traders sidelined for now.
While Trump has sounded optimistic over the prospect of a deal, the market remains hesitant. SPX500 trades 2940.18 last with price sitting back above the 2932 level.
Slow Start for Safe Havens
Safe havens have seen a subdued session so far with gold a little weaker against USD while JPY has been a little firmer.
The US-China trade talks present two-way risk for safe havens which will likely be lower on good news though could see strengthening if talks fail, driving safe-haven inflows.
XAUUSD trades 1501.36 last with price in the middle of the 1481.93 – 1522.75 levels. USDJPY trades 106.86 last, with price still sitting above the 106.75 level for now.
Crude Recovers
Oil prices have seen better buying over the European morning on Monday.
Cautious optimism ahead of US-China trade talks is helping keep oil supported. However, the backdrop remains bearish for crude. The EIA last week reported a further build in US crude stores, highlighting the ongoing demand issue facing oil.
Crude trades 53.09 last with price having bounced off the 50.93 level support.
CAD Higher on Oil
USDCAD has been sold across the European session so far today.
A weaker US dollar along with resurgent oil prices is helping lift CAD. Given how weighted the Canadian economy is to commodity prices, any positive developments with US-China trade talks this week should provide a further lift
Aussie Down
AUDUSD has started the week on an offered tone as expectations of further RBA rate cuts keep the outlook bearish for the Aussie.
If the US and China can agree on a short term deal this week, this could help buffer AUD. However, if talks fail, AUD is likely to take the brunt of the FX reaction. AUDUSD trades .6735 last.
 Current situation: