USDPLN Analysis: European Court ruling could help Polish zloty rate

By IFCMarkets

European Court ruling could help zloty rate

The representative of the National Bank of Poland Lukasz Hardt said that the decision of the European Court of Mortgage Loans does not pose a risk to the Polish banking sector. Will the polish zloty continue growing?

On the chart, it looks like a downtrend movement. Earlier, the European Court ruled that Polish mortgage borrowers have the right to convert their loans into zlotys from Swiss francs. The number of foreign currency mortgages in the country exceeds 700 thousand people, so the demand for zloty has increased. A positive factor was also the confirmation of the statistical service of Poland last year’s GDP growth of 5.1%. Recall that in early October, the National Bank of Poland kept the rate at 1.5%. This is significantly higher than the rates of central banks in Western Europe. Inflation in Poland fell in September to 2.6% on an annualized basis from 2.9% in August. The National Bank said it expects its further reduction to 2.3% by the end of 2019. At the same time, GDP growth this year should be 4.3%.

USDPLN

On the daily timeframe USDPLN: D1 approached the support line of the uptrend. Before opening a sell position, it must be broken down. Various technical analysis indicators formed a downward signal. Decrease in quotations is possible in case of publication of positive data on the Polish economy and a weakening US dollar.

  • The Parabolic indicator gives a downtrend signal.
  • The Bolinger bandswidened, indicating high volatility. Both Bollinger Lines Slope Down.
  • The RSI indicator It is below the 50 mark. It has formed a double divergence to fall.
  • The MACD indicator gives a bearish signal.

The bearish momentum may develop if USDPLN drops below its last low: 3.925. This level can be used as an entry point. The initial stop- lose may be placed higher than the last upper fractal, the highest since March 2017 and the Parabolic signal: 4.025. After opening the pending order, the stop shall be moved following Bollinger and Parabolic signals to the next fractal minimum. TThus, we are changing the potential profit/loss to the breakeven point. More risk-averse traders may switch to the 4-hour chart after the trade and place a stop loss moving it in the direction of the trade. If the price meets the stop level (4,025) without reaching the order (3,925), we recommend to cancel the order: the market sustains internal changes that were not taken into account.

Technical Analysis Summary

PositionSell
Sell stopBelow 3,925
Stop lossAbove 4,025

Market Analysis provided by IFCMarkets

USD Holds Steady After Declines From Last Week

By Orbex

The US dollar index was seen holding steady after posting steady declines last week. The fresh lows in the US unemployment rate failed to push the dollar index higher. Lack of economic data also kept price action mostly subdued. But investors remain cautious amid a host of headline narratives including the US and China headlines and the economic data.

Eurozone Sentix Investor Confidence Falls

Investor confidence in the Eurozone as measured by Sentix fell to the lowest level since April 2013. The index for October fell to -16.8 comparing to -11.1 in September. The declines come amid fears of a recession despite the ECB measures in relaunching stimulus program. The assessment of the current situation fell to a five-year low of -15.5 comparing to -9.5 a month ago.

EURUSD Holds Steady Above Support

The currency pair was seen holding steady after clearing the support area of 1.0944 last week. Price action opened briefly higher but intraday selling saw prices retreating lower. EURUSD remains somewhat subdued. But given that the support level has been cleared, the bias is to the upside for a test of 1.1033.

EU Likely to Make a Decision on Brexit this Week

French President Macron said that the European Union could decide on Brexit by the end of this week. Reports from news outlets said that the French leader wanted the EU to discuss Brexit swiftly. This comes after Boris Johnson submitted fresh proposals on Brexit late last week.

GBPUSD Caught in the Range

The currency pair is seen trading within the established range of 1.2370–1.2291. It is likely that the currency pair will remain within this range for a while. The Brexit decision announcement from the EU could potentially be a catalyst. The bias remained mixed for the moment. However, there is scope for GBPUSD to decline towards 1.2082 level of support.

Gold Prices Fall as Risk Appetite Improves

The precious metal was seen extending declines, resuming the bearish trend from Friday. Economic data from the US was sparse with most of the trade flows coming in from Friday’s payrolls report. FOMC member, Esther George, in her speech on Monday said that the US economy was in a good place with low inflation and low unemployment. George was one of the dissenters at the September FOMC rate cut.

XAUUSD Likely to Fall Toward 1485

XAUUSD has been trading within the levels of 1508 and 1485. Price opened briefly higher but the precious metal was seen resuming the downside quickly. The current momentum should see gold prices easing to 1485. As long as this support holds, XAUUSD could maintain the sideways range. A close below 1485 will potentially trigger further selling toward  the previously established lows of 1462.

By Orbex


GBP Falls On No-Deal Fears

By Orbex

USD Down – Powell In Focus

The US dollar has been a little weaker over the European session so far on Tuesday. Data weakness in the US last week has seen upside capped for now with the dollar index remaining congested around the 98.60 level. Looking ahead this week, Fed chair Jerome Powell speaks and his comments will be closely watched as the October FOMC comes into view. FOMC meeting minutes and CPI later in the week will also provide volatility.

EUR Rallies on Weak USD

EURUSD has been firmer against USD today in light of the ongoing pullback in the greenback. Looking ahead this week, the September ECB meeting minutes will be the key focus as traders try to assess the likelihood of further ECB easing this year. EURUSD trades 1.0990 last with price nearing a retest of the 1.1025 level.

Johnson’s Brexit Deal “Impossible”

GBPUSD has been firmly under pressure today. Despite the softness in USD, GBPUSD has traded back down to 1.2234 following yesterday’s rejection at the 1.2382 level. GBP has been heavily sold on reports that Johnson’s deal with the EU is “essentially impossible” to complete on the back of a phone conversation with German chancellor Merkel.

Risk Sentiment Rocked

Risk assets have come under pressure today also as the market digests the news of the US pulling out of the Turkish/Syrian border region ahead of a planned Turkish invasion of Syria. The move has raised concerns over fresh violence in the Middle East following four years of the US being active in the area. SPX500 trades 2921.38 last having broken back down below the 2932 level.

Gold & JPY Soar on Safe Haven Inflows

Safe havens have been firmly higher today as a mix of negative Brexit headlines and fresh Middle East fears combine to weigh on investor sentiment, driving both gold and JPY higher against USD. USDJPY trades 106.75 level. XAUUSD trades 1503.63 last as price continues to push back towards the 1522.75 level.

Oil Falls Despite Middle Tensions

Oil prices, for now, remain subdued despite the fresh Middle East concerns. Crude has been heavily sold since the failure above the 60.09 level last month as worries for the health of the global economy and consequently, the global oil demand outlook, have kept flows bearish for oil. Crude trades 52.35 last, still sitting above the 51.28 level for now.

CAD Crushed

USDCAD has been sharply higher today as weakness in risk markets has weighed on the commodity-driven CAD. USDCAD trades 1.3312 last with price having rallied back above the 1.33 level once again. While above here, focus remains on a further push higher.

Gold Holds AUD Up

AUDUSD is holding up today, despite the general risk-off tone to trading. Moves higher in gold are helping keep AUD supported as are quiet hopes about the upcoming US/China trade talks at the top of the week. AUDUSD trades .6745 last as price continues to hold above the .6690 level.

By Orbex


Ichimoku Cloud Analysis 08.10.2019 (AUDUSD, NZDUSD, USDCAD)

Article By RoboForex.com

AUDUSD, “Australian Dollar vs US Dollar”

AUDUSD is trading at 0.6749; the instrument is moving above Ichimoku Cloud, thus indicating an ascending tendency. The markets could indicate that the price may test the cloud’s downside border at 0.6715 and then resume moving upwards to reach 0.6855. Another signal to confirm further ascending movement is the price’s rebounding from the descending channel’s upside border. However, the scenario that implies further growth may be canceled if the price breaks the cloud’s downside border and fixes below 0.6685. In this case, the pair may continue falling towards 0.6595.

AUDUSD
Risk Warning: the result of previous trading operations do not guarantee the same results in the future

NZDUSD, “New Zealand Dollar vs US Dollar”

NZDUSD is trading at 0.6319; the instrument is moving above Ichimoku Cloud, thus indicating an ascending tendency. The markets could indicate that the price may test the cloud’s downside border at 0.6280 and then resume moving upwards to reach 0.6420. Another signal to confirm further ascending movement is the price’s rebounding from the descending channel’s upside border. However, the scenario that implies further growth may be canceled if the price breaks the cloud’s downside border and fixes below 0.6240. In this case, the pair may continue falling towards 0.6165.

NZDUSD
Risk Warning: the result of previous trading operations do not guarantee the same results in the future

USDCAD, “US Dollar vs Canadian Dollar”

USDCAD is trading at 1.3287; the instrument is moving above Ichimoku Cloud, thus indicating an ascending tendency. The markets could indicate that the price may test the cloud’s upside border at 1.3265 and then resume moving upwards to reach 1.3425. Another signal to confirm further ascending movement is the price’s rebounding from the support level. However, the scenario that implies further growth may be canceled if the price breaks the cloud’s downside border and fixes below 1.3225. In this case, the pair may continue falling towards 1.3165.

USDCAD

Article By RoboForex.com

Attention!
Forecasts presented in this section only reflect the author’s private opinion and should not be considered as guidance for trading. RoboForex LP bears no responsibility for trading results based on trading recommendations described in these analytical reviews.

Japanese Candlesticks Analysis 08.10.2019 (USDCAD, AUDUSD)

Article By RoboForex.com

USDCAD, “US Dollar vs Canadian Dollar”

As we can see in the H4 chart, after forming several reversal patterns close to the rising channel’s downside border and reversing, USDCAD has formed Hanging Man pattern in the center of the channel, which may indicate a new correction before the price continues growing towards 1.3372. However, we shouldn’t ignore another scenario, according to which the instrument may fall and return to 1.3200.

USDCAD
Risk Warning: the result of previous trading operations do not guarantee the same results in the future

AUDUSD, “Australian Dollar vs US Dollar”

As we can see in the H4 chart, after forming several reversal patterns, including Hammer, close to the support level, AUDUSD is reversing. Judging by the previous movements, we may assume that the price may finish the correction and then continue trading upwards to reach 0.6800. However, we shouldn’t ignore a possibility that the instrument may resume falling towards 0.6655.

AUDUSD

Article By RoboForex.com

Attention!
Forecasts presented in this section only reflect the author’s private opinion and should not be considered as guidance for trading. RoboForex LP bears no responsibility for trading results based on trading recommendations described in these analytical reviews.

The US Dollar Is Consolidating. Geopolitical Events Are in the Focus of Attention

by JustForex

The US dollar strengthened slightly against a basket of major currencies. The dollar index (#DX) closed yesterday’s trading session in the positive zone (+0.18%). The US currency was supported by the news that the US and Japan concluded a major trade agreement. US President, Donald Trump, noted that the agreement was very strong and would improve the condition of American farmers, as it would open them access to the Japanese market. Donald Trump also said that the parties continued to work on the following provisions of this agreement.

Financial market participants continue to monitor the progress of trade negotiations between Washington and Beijing. Summit talks should continue on Thursday. However, there is already news that China is not going to cede the US and will insist on its positions, which is contrary to the expectations of the US regarding this agreement.

Also, market sentiment is still unstable due to impeachment proceedings against US President Donald Trump. As it became known, the Federal Court of New York demanded from Donald Trump to submit his tax returns and other financial documents over the past eight years into the Manhattan prosecutor.

The “black gold” prices have been declining. At the moment, futures for the WTI crude oil are testing the $52.75 mark per barrel. At 23:30, API weekly crude stock will be published.

Market Indicators

Yesterday, there was the bearish sentiment in the US stock markets: #SPY (-0.43%), #DIA (-0.35%), #QQQ (-0.30%).

The 10-year US government bonds yield has become stable. At the moment, the indicator is at the level of 1.54-1.56%.

The Economic News Feed for 08.10.2019:
  • – US producer price index at 15:30 (GMT+3:00).

We also recommend paying attention to the speech by Fed Chairman Powell.

by JustForex

EURUSD Analysis: German industrial output gain bullish for EURUSD

By IFCMarkets

German industrial output gain bullish for EURUSD

German industrial output rose in August when a decline was expected. Will the EURUSD rise?

EURUSD rising above MA(200)

The price chart on 1-hour timeframe shows EURUSD: H1 is trading sideways still. The price is above the 200-period moving average MA(200) which has started rising. And the RSI is rising above 50 level but has not reached the overbought zone. There is no trend yet formed, traders have to decide when it would be a best time to enter the market.

Market Analysis provided by IFCMarkets

The Analytical Overview of the Main Currency Pairs on 2019.10.08

by JustForex

The EUR/USD currency pair

Technical indicators of the currency pair:
  • Prev Open: 1.09789
  • Open: 1.09701
  • % chg. over the last day: -0.11
  • Day’s range: 1.09648 – 1.09783
  • 52 wk range: 1.0884 – 1.1623

Major currency pairs show mixed results. Quotes EUR/USD continue to consolidate. The trading tool has formed the following critical support and resistance levels: 1.09650 and 1.10000, respectively. Investors continue to monitor the scandal surrounding a possible impeachment of the US president. A federal court in New York ruled that Donald Trump should file his tax returns over the past eight years with Manhattan prosecutors. Today we expect notable economic releases from the USA. Positions must be opened from key levels.

At 15:30 (GMT+3:00), the manufacturer price index in the United States will be published.

EUR/USD

Indicators do not give accurate signals: the price crossed 50 MA and 100 MA.

The MACD histogram is located near the 0 mark.

The Stochastic Oscillator is near the overbought zone, the %K line crossed the %D line. There are no signals at the moment.

Trading recommendations
  • Support levels: 1.09650, 1.09400, 1.09050
  • Resistance levels: 1.10000, 1.10250

If the price consolidates above the round level of 1.10000, expect further growth toward 1.10250-1.10400.

Alternatively, the quotes could drop toward 1.09400-1.09200.

The GBP/USD currency pair

Technical indicators of the currency pair:
  • Prev Open: 1.23030
  • Open: 1.22886
  • % chg. over the last day: -0.39
  • Day’s range: 1.22844 – 1.23003
  • 52 wk range: 1.1995 – 1.3385

The technical picture on the GBP/USD currency pair is still ambiguous. GBP is trading in a flat. At the moment, the key support and resistance levels are 1.22850 and 1.23350, respectively. Participants in financial markets are waiting for new information regarding the UK’s exit from the EU. Today we recommend paying attention to the news background from the USA. Positions must be opened from key levels.

The Economic News Feed for 08.10.2019 is calm.

GBP/USD

Indicators do not give accurate signals: 50 MA has crossed 100 MA.

The MACD histogram is in the negative zone, but above the signal line, which gives a weak signal to sell GBP/USD.

The Stochastic Oscillator is in the neutral zone, the %K line is above the %D line, which indicates a bullish sentiment.

Trading recommendations
  • Support levels: 1.22850, 1.22450, 1.22100
  • Resistance levels: 1.23350, 1.23800, 1.24150

If the price consolidates above 1.23350, GBP/USD is expected to rise. The potential movement is to 1.23700-1.24000.

An alternative could be a decrease in the GBP/USD currency pair to 1.22500-1.22200.

The USD/CAD currency pair

Technical indicators of the currency pair:
  • Prev Open: 1.33224
  • Open: 1.33087
  • % chg. over the last day: -0.08
  • Day’s range: 1.32881 – 1.33117
  • 52 wk range: 1.2727 – 1.3664

The USD/CAD currency pair retreated from local highs and moved to a decline. CAD is currently consolidating. The local support and resistance levels are: 1.32800 and 1.33100, respectively. The technical picture signals a further correction of the USD/CAD quotes after a sharp rally last week. Today we recommend that you pay attention to economic reports from the United States, as well as the dynamics of oil prices. Positions must be opened from key levels.

At 15:15 (GMT+3:00), a report on the construction of new houses in Canada will be published.

USD/CAD

Indicators do not give accurate signals: 50 MA crossed 100 MA.

The MACD histogram is in the negative zone and continues to decline, which indicates further correction of the USD/CAD currency pair.

The Stochastic Oscillator is in the oversold zone, the %K line crossed the %D line. There are no signals at the moment.

Trading recommendations
  • Support levels: 1.32800, 1.32550, 1.32350
  • Resistance levels: 1.33100, 1.33300, 1.33450

If the price consolidates below 1.32800, expect further correction toward 1.32550-1.32400.

Alternatively, the quotes could grow toward 1.33400-1.33500.

The USD/JPY currency pair

Technical indicators of the currency pair:
  • Prev Open: 106.637
  • Open: 107.243
  • % chg. over the last day: +0.46
  • Day’s range: 107.204 – 107.445
  • 52 wk range: 104.97 – 114.56

Yesterday, bullish sentiment prevailed on the USD/JPY currency pair. Quotation growth exceeded 60 points. The trading tool has updated local highs. At present, the currency of the “safe haven” is consolidating in the range 107.100-107.450. We do not exclude further correction of the USD / JPY quotes. We recommend that you keep track of up-to-date information regarding trade negotiations between the United States and China. Positions must be opened from key levels.

Today, Japan published weak data on household spending during the Asian trading session.

USD/JPY

The price has fixed above 100 MA, which signals the strength of buyers.

The MACD histogram is in the positive zone and above the signal line, which gives a strong signal to buy USD/JPY.

The Stochastic Oscillator is in the overbought zone, the %K line crossed the %D line. There are no signals at the moment.

Trading recommendations
  • Support levels: 107.100, 106.800, 106.600
  • Resistance levels: 107.450, 107.650, 107.900

If the price consolidates above 107.450, expect further correction toward 107.800-108.000.

Alternatively, the quotes can drop toward 106.800-106.600.

by JustForex

Is Bill Gates Right On Energy Investing?

By OilPrice.com

Not long ago, Bill Gates offered some investment advice. That, in itself, constitutes news, but the content and the reactions make up a more interesting story.

Gates told the Financial Times, in essence, that investors who want to do something about climate change should stop making up lists of companies they do not want in their portfolios based on involvement in fossil fuel production or use. They should, instead, invest in disruptive technologies that will provide actual solutions to climate change.

Environmental-social-governance (ESG) investors have pushed back on this position partly on moral grounds. But there are economic reasons as well. Their withdrawal of capital, and demand that banks not finance fossil fuel projects limits the pool of capital available to fossil fuel companies, which raises their cost of capital. And their insistence that fossil fuel companies more explicitly lay out risks to shareholders sets on notice fiduciary investors, who do not want to have to explain, afterwards why they made an investment in disregard of warnings. But the actions of ESG investors are essentially negative, and possibly of limited effectiveness, given the huge cash flows that oil companies generate. The oil companies can continue to do what they always did. And the capital market boycotts do not create solutions.

Okay, easy advice for Bill Gates to give, because he and his fellow billionaires have the money and contacts to acquire interests in those disruptive technology companies before they go public. The rest of us don’t. We will, as consumers, pay for the new technologies that will make the original investors richer.

Some energy experts have said, don’t worry, the big energy firms will make those investments, and they have the money to do it. In truth, some giant energy firms have looked into doing so. Royal Dutch Shell, for instance, set up a team of executives to figure out how. They immediately ran into the problem. Shell is the biggest dividend payer in the world. It wants to maintain that dividend of $16 billion per year. The bulk of cash flow comes from the oil and gas business. It has invested in natural gas (lower carbon content than oil or coal) in windmills, in hydrogen energy, but all this green investing, no matter the prospects, cannot generate enough cash to pay that dividend. Shell will not make the Schumpeterian move, to dump the old business before it is too late, and go whole hog into the new. Shell cannot afford to be disruptive. Somebody else will have to do it. In that respect, Bill Gates is right.

Presumably the market will (eventually) furnish the capital needed to decarbonize the economy, but, so far, venture capitalists seem more interested in disrupting the taxi, restaurant, scooters and office space industry. They pour billions into those ventures. Meanwhile, the climate continues to warm.

We would suggest an alternative to waiting for the Silicon Valley crowd to come to our salvation. One that takes into account the need to secure public backing for the required social and economic changes. We believe that the nation needs one or several publicly sponsored energy and climate funds, similar in ways to Comsat, a government sponsored but privately financed and managed corporation that first launched our communications satellites. Anyone could buy a share in the new telecommunications technology. Why not something similar for climate change? Maybe allow payroll deductions for small investors or state-sponsored funds for local projects. Climate change mitigation efforts will succeed only if the public buys into the concept. And giving the public a chance to buy in, literally, might hasten the process.

So back to Bill Gates’ advice. Great idea. And, as the old saying goes, “What is sauce for the goose is sauce for the gander.” So why can’t the rest of us invest along with Bill?

Link to article: https://oilprice.com/Energy/Energy-General/Is-Bill-Gates-Right-On-Energy-Investing.html

By Leonard Hyman and William Tilles


US Stock Markets Trade Sideways – Waiting on News/Guidance.

By TheTechnicalTraders.com

Our researchers believe the global concerns centered around Banking and Debt within the Emerging Markets and Asia/Europe are very likely to become major issues over the next 3+ months.  These potentially dangerous issues could have far-reaching pricing ramifications for almost all of the world’s financial markets.  This weekend, we received first-hand information from an associate in Hong Kong about banks limiting ATM withdrawals and very limited transportation services.  Our source stated the biggest issue was the lack of transportation right now.

We also followed the news of the Bank collapse in India this weekend and the aftermath for Indian banking customers – PMC Bank

Many of you remember how the US credit crisis event started in a similar manner.  First, it is news of a few select financial institutions or lenders that are in trouble.  This sends a shock-wave throughout the populous – they react by becoming more “protectionist” in their actions.  Sometimes, small bank runs can happen as consumers want to have more cash on hand instead of “in the bank”.  Next, the local economic metrics start to fall – almost like a self-fulfilling nightmare, the consumers, acting to protect their interests and assets, are now pushing the local economy over the edge and the banks, possibly, over the breaking point in terms of Non-Performing Loans.

This time, as we have detailed in our previous research posts, we believe the crux of the credit problems is related to how emerging markets and foreign markets took advantage of the cheap US dollar between 2011 and 2015.  At that time, it was cheaper for banks to borrow the US Dollar than it was for them to borrow money from their own local central banks.  Thus, many went out seeking to borrow as much US Dollar as they could because it provided an opportunity to save on interest fees.  Now, as the global economy continues to contract in a “stagflation” type of manner, it becomes even harder for many of these firms, banks, and individuals to service their debt.

We believe the global markets and the US stock market are waiting for news before initiating any new price trends.  We believe the recent US manufacturing number is indicative of the type of economic output values we can expect over the next 30+ days.  Unless the US Christmas season starts off with a big spending spree or the US/China trade issue is resolved and settled within 30+ days, we believe the markets will continue to search for and identify “true price value” by seeking out true support before attempting to move higher again.

Our morning coffee video analysis recap is the one thing… that single investment that’s going to turn into the greatest thing you’ve ever made for your trading and investment accounts.
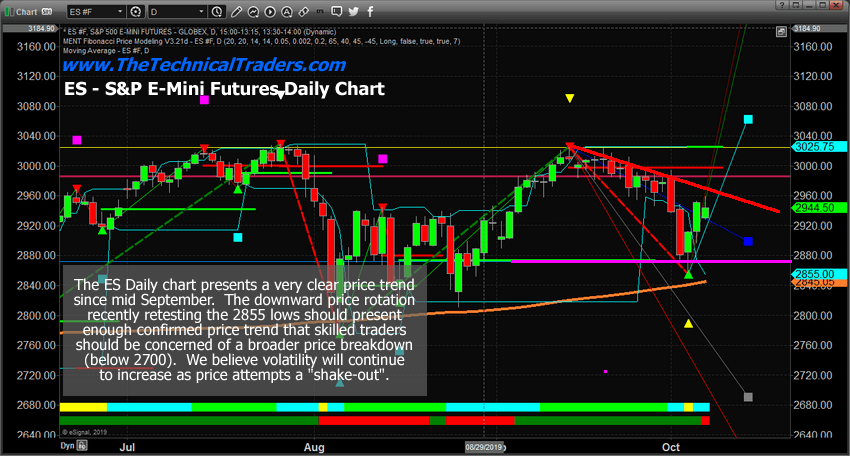
S&P 500 Daily Chart

This ES Daily chart highlights the recent resistance, triple-top formation, near 3025.  It is clearly obvious that this 3025 level is a very strong price resistance level.  Below this ceiling, we have multiple support levels to watch.  2875 is highlighted in MAGENTA and is one that we believe is the most critical right now.  Below that, the Moving Average level, currently at 2845, could also provide some support.  Below these two, we suspect the 2700 level is the only level of support left before we could experience a much bigger price breakdown.

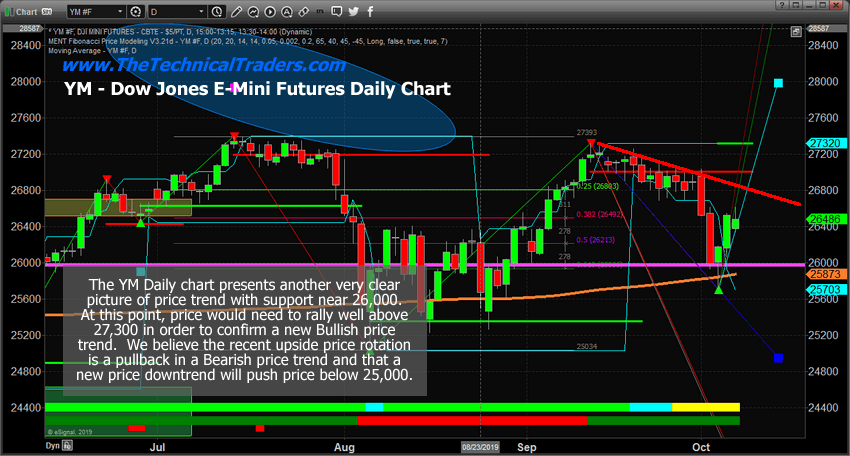
Dow Jones Daily Chart

This YM Daily chart sets up a similar type of price pattern.  In fact, they are almost identical.  Again, the current downside price rotation has already established new recent price lows.  The RED resistance channel we drew across the tops should provide some real level of a price ceiling within this trend.  Our concern is that price will attempt a further breakdown without any positive news to extend a positive perspective for the US markets future.  There is just too much uncertainty in the world for investors to have the confidence to push prices higher.  The most logical transition would be for price to “reset” by rotating lower, finding true price value levels and establishing a new price bottom to begin a new rally from.

Dow Jones 2-Week Chart

This 2-Weekly YM Chart highlights exactly why we believe skilled technical traders need to be cautious right now and why having a very skilled team of researchers is important.  This is not the time to go ALL-IN on any trades.  This is not the time to roll your retirement account into HIGH-RISK funds.  We suggest being very cautious at the moment and to prepare for any downside rotation by scaling back your trading account to 70 to 80% CASH.  Deploying only about 20 to 25% into the markets right now.

Concluding Thoughts:

It is funny how real traders understand the value of having a skilled team of dedicated technical and fundamental researchers assisting them at times like this.  While other people freak out and turn into “super protectionist traders”.  The reality of these types of markets is that they are the best markets for traders.  Price swings are larger, opportunities are setting up nearly everywhere and skilled traders can attempt to make 45%, 65%, 85% or more within a very short time-frame.  Not like the regular market moves of 3~5% annually in the SPY.  This is the time when you want to become more attentive and active in the markets – with the right team.

Opportunities are setting up EVERYWHERE and will continue to present very clear trade setups over the next 16+ months.

As a technical analysis and trader since 1997, I have been through a few bull/bear market cycles. I believe I have a good pulse on the market and timing key turning points for both short-term swing trading and long-term investment capital. The opportunities are massive/life-changing if handled properly.

Be sure to ride my coattails as I navigate these financial markets and build wealth while others lose nearly everything they own during the next financial crisis.

I can tell you that huge moves are about to start unfolding not only in metals, or stocks but globally and some of these supercycles are going to last years. My simple technical trading strategy using ETFs will allow you to follow the markets closely and trade with it so you never get caught on the wrong side of the market with big losses.

Chris Vermeulen
TheTechnicalTraders.com

NOTICE: Our free research does not constitute a trade recommendation or solicitation for our readers to take any action regarding this research.  It is provided for educational purposes only.  Our research team produces these research articles to share information with our followers/readers in an effort to try to keep you well informed.  Visit our web site to learn how to take advantage of our members-only research and trading signals.