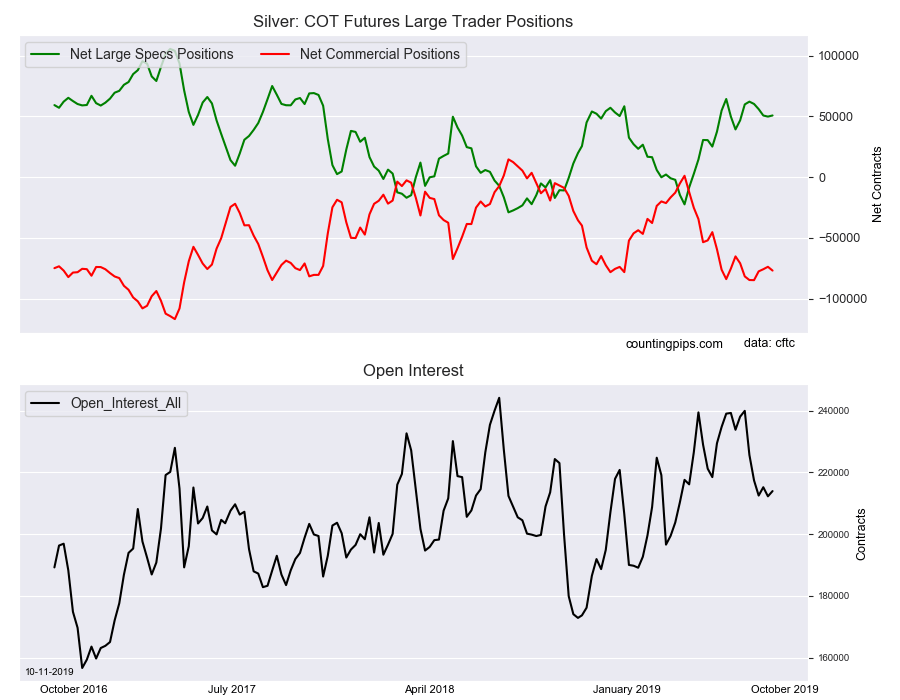
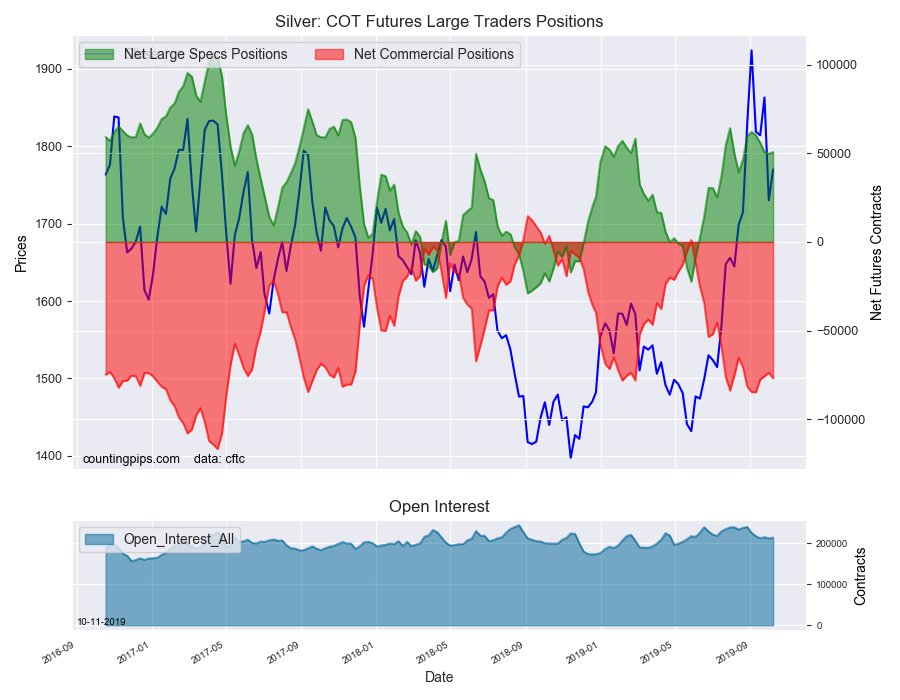
Large precious metals speculators slightly advanced their bullish net positions in the Silver futures markets this week, according to the latest Commitment of Traders (COT) data released by the Commodity Futures Trading Commission (CFTC) on Friday.
The non-commercial futures contracts of Silver futures, traded by large speculators and hedge funds, totaled a net position of 50,754 contracts in the data reported through Tuesday October 8th. This was a weekly rise of 939 net contracts from the previous week which had a total of 49,815 net contracts.
The week’s net position was the result of the gross bullish position (longs) advancing by 125 contracts (to a weekly total of 90,092 contracts) while the gross bearish position (shorts) decreased by -814 contracts for the week (to a total of 39,338 contracts).
Silver speculators edged their bets higher this week following four straight weeks of declines that had subtracted a total of -12,310 contracts from the overall position. The gain this week pushed the net position total above the +50,000 contract level after a dip below this threshold last week. The speculative silver position has now been in bullish territory for eighteen straight weeks, dating back to early June.
Silver Commercial Positions:
The commercial traders position, hedgers or traders engaged in buying and selling for business purposes, totaled a net position of -76,906 contracts on the week. This was a weekly loss of -3,125 contracts from the total net of -73,781 contracts reported the previous week.
Silver Futures:
Over the same weekly reporting time-frame, from Tuesday to Tuesday, the Silver Futures (Front Month) closed at approximately $1770.00 which was an uptick of $39.80 from the previous close of $1730.20, according to unofficial market data.
*COT Report: The COT data, released weekly to the public each Friday, is updated through the most recent Tuesday (data is 3 days old) and shows a quick view of how large speculators or non-commercials (for-profit traders) as well as the commercial traders (hedgers & traders for business purposes) were positioned in the futures markets.
The CFTC categorizes trader positions according to commercial hedgers (traders who use futures contracts for hedging as part of the business), non-commercials (large traders who speculate to realize trading profits) and nonreportable traders (usually small traders/speculators).
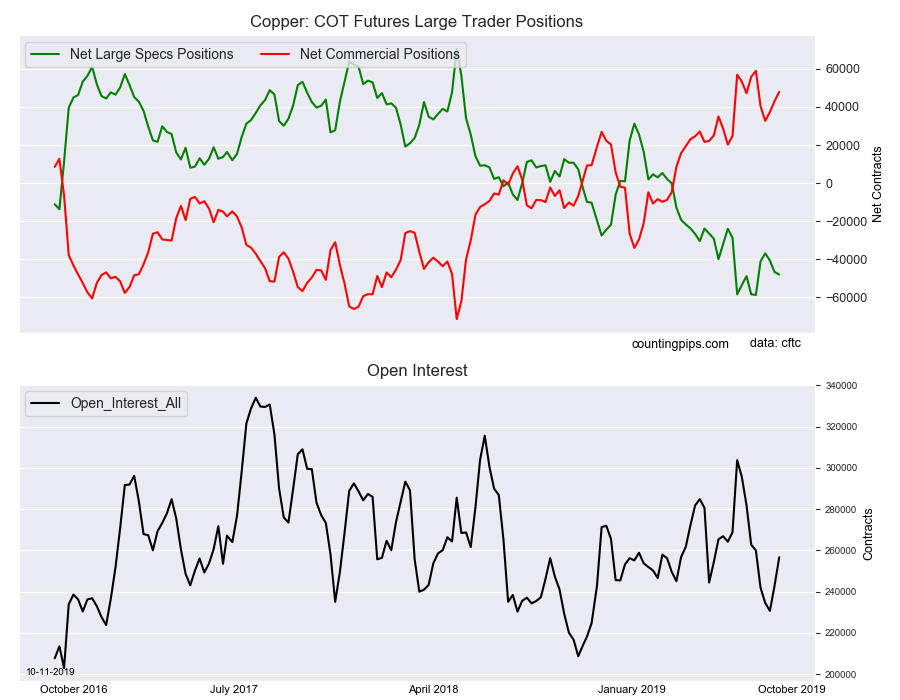
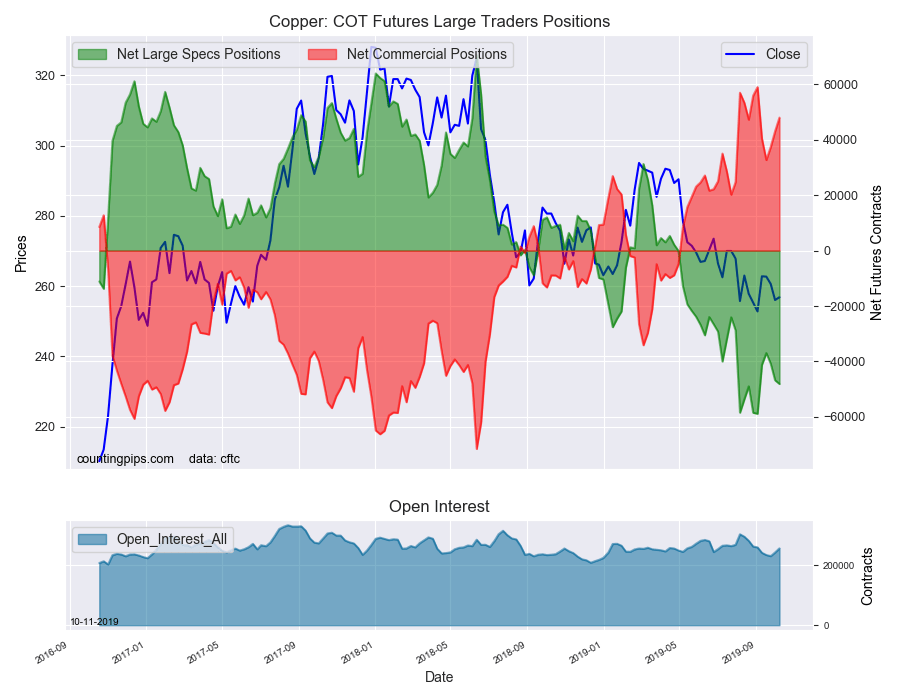
Large precious metals speculators raised their bearish net positions in the Copper futures markets once again this week, according to the latest Commitment of Traders (COT) data released by the Commodity Futures Trading Commission (CFTC) on Friday.
The non-commercial futures contracts of Copper futures, traded by large speculators and hedge funds, totaled a net position of -48,093 contracts in the data reported through Tuesday October 8th. This was a weekly change of -1,320 net contracts from the previous week which had a total of -46,773 net contracts.
The week’s net position was the result of the gross bullish position (longs) tumbling by -1,387 contracts (to a weekly total of 69,884 contracts) while the gross bearish position (shorts) fell slightly by -67 contracts for the week (to a total of 117,977 contracts).
Copper speculators added to their bearish bets for a 3rd consecutive week. The overall bearish level is now at the highest standing since the recent record high short position reached on September 3rd at a total of -58,841 contracts. Copper speculative contracts have now been in bearish territory for twenty-four straight weeks.
Copper Commercial Positions:
The commercial traders position, hedgers or traders engaged in buying and selling for business purposes, totaled a net position of 47,981 contracts on the week. This was a weekly boost of 4,935 contracts from the total net of 43,046 contracts reported the previous week.
Copper Futures:
Over the same weekly reporting time-frame, from Tuesday to Tuesday, the Copper Futures (Front Month) closed at approximately $256.85 which was a gain of $0.80 from the previous close of $256.05, according to unofficial market data.
*COT Report: The COT data, released weekly to the public each Friday, is updated through the most recent Tuesday (data is 3 days old) and shows a quick view of how large speculators or non-commercials (for-profit traders) as well as the commercial traders (hedgers & traders for business purposes) were positioned in the futures markets.
The CFTC categorizes trader positions according to commercial hedgers (traders who use futures contracts for hedging as part of the business), non-commercials (large traders who speculate to realize trading profits) and nonreportable traders (usually small traders/speculators).
Welcome to this week’s Market Wrap Podcast, I’m Mike Gleason.
Coming up MoneyMetals.com columnist and Senior Analyst at The Morgan Report David Smith joins me for another wonderful conversation on why he thinks the recent correction in metals is creating what may be the last great buying opportunity in the sector, and also why he believes those who do buy should be thinking insurance first and profit second. So be sure to stick around for my conversation with David Smith, coming up after this week’s market update.
As the Federal Reserve prepares more stimulus injections into the financial system, investors continue to flip back and forth from favoring safe haven assets one week to growth stories another. This week markets swung back toward growth, perhaps in hopes of progress on U.S.-China trade talks.
Global equity markets got a bounce mid-week. Industrial commodities including copper and platinum group metals also made gains. Bonds, meanwhile, sold off, and gold and silver struggled to hold significant near-term technical levels.
Gold prices dipped on Thursday to test $1,500 per ounce support. As of this Friday recording, gold is struggling to close the week here and comes in at $1,480 and shows a weekly loss of 1.8% now.
Turning to silver, the white metal is down 0.7% this week to trade at $17.51 an ounce. Platinum is up 0.9% for the week, now checking in at $891. And finally, palladium recorded another new record high. The catalytic metal currently trades at $1,696 per ounce on the heels of a 2.0% weekly advance.
Metals traders are processing the latest price inflation data as well as the prospects for more monetary inflation courtesy of the Federal Reserve. Thursday’s Consumer Price Index report showed the CPI rising by a miniscule 0.1% in the month of September and 1.7% year over year.
With government statistics showing annual costs of living running below the Fed’s 2% target, Fed chairman Jerome Powell may be inclined to cut rates again later this month. The minutes from the last FOMC meeting show policymakers divided over the issue, with some reluctant to cut at all and at least one ultra-dove favoring a 50 basis point cut.
Odds favor a 25 basis point cut by the end of October, and perhaps another by the end of the year.
Perhaps just as importantly, the Fed is also expected to continue expanding its balance sheet as an outgrowth of its recent rescue operation in the repo market. The Fed will continue to provide daily liquidity injections into the first week of November at least while making some of its “temporary” open market operations permanent.
Chairman Powell insisted this week at a Q and A with economists that the Fed isn’t pursuing QE – Quantitative Easing. Critics aren’t buying Powell’s denials.
Moderator: Is the Fed almost coming back into QE or would you describe this intervention as something different?
Chairman Powell: Let’s start there. This is not QE. In no sense is this QE. This is nothing like at all. I’ll come back to that point.
Financial News Anchor: Lots of pains taken to label it, not QE. But there’s still balance sheet expansion… still money being added.
Ben Emons: Well, you know, it’s kind of a misnomer, right? Is this QE or is it just open market operations? At the end of the day you aren’t going to expand the balance sheet.
Max Keiser: Is this the beginning of Quantitative Easing? Is it the same as Quantitative Easing? Is it different than Quantitative Easing? It looks and smells like quantitative easing on the short end anyway. How does it differ?
Ben Emons: Well, it is. It’s a permanent open market operation, so they’re going to be adding liquidity and eventually they’re going to come in, and whether they want to call it QE4, QE5. We’ve discussed this before. It’s QE infinity.
Chairman Powell: But not QE. Did I mention that?
Moderator: Not QE. You did mention that.
Compared to previous QE iterations, the Fed is more narrowly focused this time around – specifically on manipulating overnight lending rates lower for banks. But what matters here is that it has dramatically reversed itself on balance sheet management.
When Fed officials were unloading assets off their books earlier this year, that was called Quantitative Tightening. Now that they are absorbing Treasuries from the repo market to the tune of several hundred billion dollars, it sure looks an awful lot like “QE something.”
If more trouble hits the banking system or the economy, perhaps Jerome Powell’s “not QE” will grow and morph into the biggest QE to date. “QE forever” or “QE infinity” are definite possibilities that investors shouldn’t take lightly.
What all this QE, “not QE” madness may be building toward is an ideal environment for precious metals.
Gold and silver markets broke out to multi-year highs this past summer. They have rallied this year overall in spite of the fact that the U.S. Dollar Index so far refuses to break down. Although it is showing some weakness this week, the USD exchange rate remains higher versus other major foreign currencies for the year.
And for the year, gold and silver are looking strong in terms of all major fiat currencies. It makes sense given that central bankers around the world are all pursuing easy money policies of their own.
Still, it’s been largely a stealth rally in metals up to this point. Gold and silver aren’t garnering much attention in the financial media – perhaps because the U.S. bond and stock markets have also shown strength since the Fed turned dovish late last December.
Equities could potentially run up further as the Fed continues to ease. But if the recent hiccups in the repo market are a sign of bigger trouble to come in the financial system, then the Fed may be behind the curve. The stock market may be headed for some volatile times ahead.
Although gold and silver can go up based on their own fundamentals regardless of how financial markets perform, public demand for physical bullion tends to go up during times of fear. Ordinary investors and savers may come to fear an accelerating loss of purchasing power in their dollars and dollar-denominated stocks and bonds. That would be an ideal environment for precious metals indeed.
Well now, without further delay, let’s get right to this week’s exclusive interview.
Mike Gleason: It is my privilege now to welcome back David Smith, senior analyst at The Morgan Report and regular contributor to MoneyMetals.com. David, good to talk to you and thanks for the time. How are you?
David Smith: Same here, Mike. I’m just fine. It’s good to speak with you again. Interesting times indeed.
Mike Gleason: They always are it seems. Well, you recently wrote a piece for the MoneyMetals.com site last week in which you termed this most recent correction in precious metals as “the last train out” for bulls. Gold and silver had been trading range bound for years now. We saw a false breakout in 2016 when silver ran do about $1 an ounce and then got smashed lower.
People can be forgiven for questioning whether things are really different from metals now but expecting prices to remain stagnant given what the Federal Reserve is doing and the awful fundamentals for the U.S. dollar also seemed like a pretty bad bet. Can you elaborate on why the opportunity to buy metals at these levels is going to be limited? What has changed today versus 2016 for example?
David Smith: Well, I think there are so many elements that are pointing toward this being different than 2016 more and more of the sophisticated money, the large funds, the people that are kind of the first in line to see a trend change – a major trend change – are coming up publicly stating that they’re taking major positions in gold, silver and the mining stocks. Also, in the last few days, I’ve run across two intriguing elements, which also I think are under most people’s radar and it supports a comment that I made here in the next essay that I’ll be talking about.
About the idea that we all know how much gold and silver had been purchased and continued to be purchased by Russia, China, Turkey, and India, but what’s happening is that Europe, which had been relatively light on purchasing in terms of European retail sales are really starting to amp up. And I think that’s going to be the spark that’s going to set off the demand situation where we already have a fairly declining silver and gold supplies and yield, and actual ounces each year for the last several years. And I think this is going to nudge it more and more toward that breakout point where the public recognition phase starts to kick in. And my guess is that that takes place early next year.
It’s starting to take place now and so where most people still are a little bit fearful about adding to their position or even getting started. I think this is an excellent time for the people in the retail sector to be buying the physical metal and putting into the way into periods of witness whenever possible.
Mike Gleason: You study the silver supply fundamentals quite closely as you follow the mining industry and analyze the sector for The Morgan Report and I want to ask you about the state of things with regards to silver supply.
As we both know, the silver price has done very little over the last few years and that is tamped down exploration among the miners. What can you say about silver supply, David? And share with us any you have there about what appears to be some dwindling stockpiles.
David Smith: Well, the production of silver has been declining for the last several years. And the thing is this can take quite a while for it to really be reflected in the price. If you look at palladium, it was in a deficit for quite some time and people thought not much was going to change, and all of a sudden there was a price explosion. And I don’t think anybody, including myself, would have imagined that it would go to $1,600 and then stay there…. 15, $1,600 an ounce.
And it wasn’t that long ago when you could buy it for seven or eight or $900 and I think that’s what’s going to happen with silver. It’ll be a little bit different scenario, but when it really gets going, silver as such an emotional metal that people really get involved with it. And it’s also an industrial and an investment metal, and it has that going forward even more so than palladium does.
One of the things that I meant to mention was that the two charts that I saw here within two days of each other, one is that the silver – looking at the global ETFs all around the world, the exchange traded funds that actually holds silver – they have the highest amount of silver that’s been deposited in that since they’ve kept records on that type of an activity. And then two days later, I saw the same thing for gold.
So, the strong hands, that’s what’s happening, the metal is moving in the stronger and stronger hands. And the last of those who kind of gave up and thought it’ll never change or it’s 2016 all over again, they’re getting rid of their metal, but other people are picking it up. And so that’s a very strong indicator along with the increased sales in Europe and especially France, Germany and UK that indicate to me that that unexpected spark is getting ready to be lit under the price and the actual supply of the precious metals getting well on their way here before the end of this year.
Mike Gleason: What do you make of gold’s outperformance over silver? The ratio has been pretty firm here in the 80s. Now it did get up to say 90 to 1 a few months back, but silver can’t seem to get below 80 or 85 to 1 on that ratio.
I know we like to see silver lead in a bull market, so what do you make of the fact that gold has really been the better metal for, say, the third year in a row now?
David Smith: That doesn’t bother me at all. I was actually involved with futures and the physical metal during the run up into 1980. And gold outperformed initially and there were times when silver would just sit there for several weeks at a time, and gold would be roaring and people would wonder. And then all of a sudden you’d wake up and you’d have three weeks of almost vertical moves in silver. So, I’m not concerned about that at all. I think it’s important that the ratio is declining and it’s kind of a trend change.
And I think you’re to see that over time declining where silver becomes more and more viable in relationship to gold than it has been in the last couple of years. So, I don’t think people should obsess over where that thing’s going on any given day, week, or even month. Just to understand that the trend is changing and that the outperformance of silver is getting ready to be taking place over the next few years in relation to gold. They’ll both do very well, however.
Mike Gleason: Yeah, for the year, gold is up about 17%. Silver’s up about 14%. We’re not talking about a major difference this year and silver has performed quite well as that ratio got over 90 to 1 a few months ago. It has come down a little bit since then, so it does seem to be trending in the right direction, if you’re looking for silver to lead a metals rally.
Getting back to the Platinum Group Metals, David, I know you like to find value in the PGMs where you made an amazing call a few years ago when you were banging the drum for palladium at the time when no one else was thinking about it and it’s nearly tripled in prices when you first started telling our podcast audience about that value play. What are your thoughts on the PGMs and do you see any opportunities there today like maybe going short palladium or long platinum? Let’s hear your thoughts on the other precious metals there, David.
David Smith: Going short is always dangerous in a bull market and palladium hasn’t shown any indications that it’s ready to roll over just yet. I do think the platinum makes some real sense because it has so long been actually more expensive than gold by usually several hundred dollars and we’ve had a period of several years now where it’s been just the opposite. And for example, platinum is a little bit under $900 now and gold is about $1,500 so that’s a $600 deficits per ounce in relationship to the price of gold to compare it to it normally being $300 over.
So, there’s almost a $900 difference and it wouldn’t have to go back to that ratio to make it a very good investment. If it just closed the gap by, say, half of that $400 to $500, that would be a substantial improvement without gold going anywhere. All platinum has to do is rise above that amount. And it is an industrial metal, it’s used mostly for catalytic converters and things like this. So, I understand the question about the global economy, how strong it is, and this type of a thing is weighing on that a little bit.
But really, I think the downside risk on a percentage basis for platinum rounds for example, or platinum bars, is really not any larger than it is for gold and silver. So, I think they all share that one aspect of being an asymmetric trades. And by that I mean where a relatively small amount of committed funds has the potential to outperform substantially in terms of the risk-reward ratio.
Mike Gleason: Yeah, I think that’s a great point. And I would stress the fact that, yeah, I would say there’s very limited downside risk and platinum at these prices. Sure it could go maybe a hundred dollars down from here, if it even does that, but I think you could get a two bagger potentially if it starts to finally catch a bid. And of course, you’ve got the automotive manufacturers who have been choosing palladium for several years now because palladium was a fraction of the price of platinum a few years back and they haven’t ended up really switching back to platinum even though it’s about half the price of palladium. Has that surprised you a little bit or is that just a function of the fact that it takes these manufacturers a long time to retool for some other type of raw material?
David Smith: I’m no expert on how long it takes, but you hit the nail on the head. Because I’ve read this from several sources that tend to know and in the manufacturing space. You don’t just flip a switch and stop using palladium and certain applications and do platinum. It does take a while and I think that’s what doing market does what it does best, over time it moves to what makes the most sense from a financial standpoint. And my guess is that quite a few of these operations that have used palladium are now quietly moving over to the platinum space.
And I think that’s what’s going to start that extra amount of usage being taken place. And so, and another thing too, Mike, not only with platinum but also going back to silver for just a minute and even gold, but when the person is coming in to buy physical metal, when things are relatively quiet, the spread, the bid-ask spread decreases and also the premium decreases, because there’ll be a little bit more supply there.
So, it’s always good to be doing it either in terms of falling prices and/or in terms of quiet prices when you want to accumulate. You don’t want to be running with the herd if you want to get the best price. And so, going in in portions, not just buying it all at once and doing it when we have things like we have are going on today when the metals are on the weak side. It really makes a lot of sense over time to get to keep your overall cost down per ounce as much as you can get them, because it increases your insurance capability, and your profit potential over time.
Mike Gleason: Yeah, well stated. That’s a good point. Well, David, give us a sense of what you think for the rest of the year. You alluded to this a little bit in your first answer, but talk about that and then also 2020 is an election year. We’ve got that on the horizon now.
Will most asset classes including metals maybe just grind sideways as everyone waits on the November election outcome or will there be some kind of a spark that finally ignites what appears to be a rather tenuous situation on many financial fronts?
David Smith: Mike I will be speaking at the Silver & Gold Summit in San Francisco here in just a couple of weeks and the topic that I’ll be discussing will be a lot along the lines of what you and I’ve been talking about here today. And what I think is that this is a tremendous opportunity for people to get their core position set up and maybe even add a little more if they want because it will be much, much cheaper and much lower risk to do it before the end of the year.
I think with the election cycle coming up, almost anything imaginable could happen and nobody knows including us, what it’s going to happen, what the effect is or whatever. But the more that the market and businesses and retail people get convinced that we might have a big change in government in terms of taxation structure and the deficit, and things like this, that’s going to increase the fear and that’s going to cause people to start realizing that we can’t depend on things being like they are today, perhaps.
It could be better or it could be worse, but I need some insurance and anyone that has any sense has to look at this and say, “You know what? I just cannot remain completely in paper. I need to have some physical metal as insurance first and as profit second.” And I don’t think they’re going to be unhappy by making that kind of a choice because for 2020 I think all bets are off.
I think it’s going to be a very strong year for the metals. It’s going to be unpredictable and the swings, they’ll be up and down, big ones. But on balance, I think we’re headed into the last big leg, which will take place over several years. It could be three or four years, it could be 10 years, but it’s going to take place during that time, which will end up in a public mania for the metals. And why wait until that happens before you add your stash?
Mike Gleason: Yeah, something you said there I think is very key and I’ll repeat it. Insurance first, profits second when it comes to the metals and people really should be looking at it as that type of investment or really just insurance, that’s really what it is and a lot of people don’t necessarily grasp that and I think it’s a, it’s a very important point.
Well finally, David, as we close today, give us some of the key levels and gold and silver that you think we need to hold on the downside if we see them fall from here and then the overhead resistance levels that you want to see get taken out to the upside that will get you excited about where things are headed in the metals over the long-term… let’s hear some of those technical levels as we start to wrap up here today.
David Smith: Well, first of all, I think that looking at HSR levels; horizontal support and resistance, I think if you draw a line across the page, they tend to be more accurate than in triangles and boxes, and all this sort of thing. So, I would say, for example, right now gold is about $1,500 I think $1,380, $1,360 on the downside is where you would want to watch. That’s a pretty big range. I don’t know that it looked down that far, but I’m just saying that is the support.
The more it digs into that branch where it broke out of six-year highs here earlier this year, the more you’re going to find people coming in and buying, either the people that want to buy more to add to their position or the people that didn’t get in, so it’s going to chew slowly down into that area, and who knows how far to go down.
It might not go much farther. I’m amazed and quite impressed with how gold is hanging right around $1,500. It doesn’t like to much below that. We could easily see a stab down to $1,450 or $1,425, but I think that’s going to uncover a lot of buy-in. On the upside, if you get above $1,650 it’s off to the races. So, $1,650-$1,700 that may not happen until next year, next spring, but I see a predictions from people that are pretty reliable that say could happen before the end of the year. So, it’s not so much when it happens but that it is going to happen.
Silver, $17.50 now it’s got the belts of support down into $16 if it gets much above $18.50 or so, then it’s going to be a breakout in terms of the lines there and you can see it stab up into the $19-$20 area. And I believe that levels just to watch for going forward are most above $26 in silver, and I move above $1,750 to $1,800 in gold. That is really going to ignite the market and it’s really going to take off, and increase rapidly in price after that point. It’s not going to get up there tomorrow, but it’s on the way and it could happen as early as next spring on a lot of this.
And then on platinum, which is about $900 now, you’ve got support down at about $820 and getting above $1,000 I think would reignite that movement going forward. So, those are pretty well defined, and they can be seen on the chart easily. Everybody else is looking at them. And so, when you see those different levels being tested and hit, that’s when you say, “Well, it looks like what’s going to happen here is getting ready to go.”
Mike Gleason: Eventually there will be a public mania phase in the metals. Obviously, they can’t continue to do what they’re doing to these fiat currencies around the world. We didn’t even get to that and what they’re doing here in the repo market and injecting billions and billions of dollars into that market, trying to add liquidity, because they’re nervous about exactly what’s going on there.
Fiat currencies around the world are all devaluing in tandem, and eventually when that does get out, there is going to be that mania phase. There’s going to be a mad scramble into the safe havens like precious metals and like you said earlier, just take advantage of these opportunities. If the market’s going to put it on sale, then take a position, add to your position. I’ll think you’ll be rewarded in the end and we totally agree there.
Well, we’ll leave it there, David. Good stuff once again and thanks for the time today. I look forward to catching up with you again soon and we’ll always be watching for more of your articles at MoneyMetals.com. Keep up the good work and take care, goodbye for now.
David Smith: You bet. Goodbye. Take care, Mike.
Mike Gleason: Well that will do it for this week, thanks again to David Smith, Senior Analyst at The Morgan Report and a regular columnist for MoneyMetals.com, and the co-author, along with David Morgan, of the book Second Chance: How to Make and Keep Big Money During the Coming Gold and Silver Shock Wave, which is available at MoneyMetals.com and Amazon. Pick up a copy today.
And check back here next Friday for our next Weekly Market Wrap Podcast. Until then, this has been Mike Gleason, with Money Metals Exchange. Thanks for listening and have a great weekend everyone.
The Money Metals News Service provides market news and crisp commentary for investors following the precious metals markets.
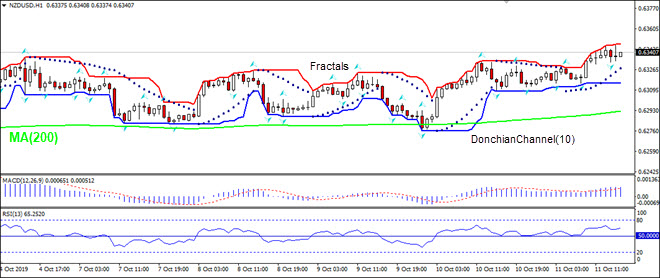
New Zealand manufacturing contraction bearish for NZDUSD
New Zealand’s manufacturing sector contracted for a third consecutive month. Will the NZDUSD decline?
The price chart on 1-hour timeframe shows NZDUSD: H1 is trading sideways. The price is above the 200-period moving average MA(200) which is rising. And the RSI is rising above 50 level but has not reached the overbought zone yet. There is no trend yet formed, traders have to decide when it would be a best time to enter the market.
In contrast to gloomy international projections, economic realities suggest that China’s Golden Week may have exceeded expectations.
I spent China’s 70-year National Day festivities in Shanghai, China’s global financial hub, and Guangzhou, the global trade hub of the Guangdong-Hong Kong-Macao Greater Bay Area. In both, China’s massive transition toward consumption and innovation is now an increasing reality.
Due to US tariff wars, Chinese mass consumers – like their peers in the United States, Europe and Japan – are cost-conscious, increasingly discriminate and sophisticated in their spending. Indeed, sales of gold jewelry boomed during the holidays, fueled by gold prices, holiday festivities and the wedding season.
But unlike their counterparts in advanced economies where middle-classes are shrinking, Chinese middle classes continue to grow, expand and consume. That is the great opportunity in China and abroad alike.
The just-ended Golden Week is a case in point.
Golden Week retail sales 8.5% up
In effect, China has two “Golden Week” holidays; the Lunar New Year around January and February, and the National Day week in early October. Both are seen as a barometer for Chinese private consumption, due to gift-giving, family reunions, thriving retail and catering.
Last February, the Lunar New Year showed the slowest increase in years, according to international media. Yet, Chinese retail sales actually rose almost 7% from a year earlier.
Prior to the National Day Golden Week, once again, much of international media expected the trade wars to undermine Chinese holiday sales. And again, they were proved wrong. During the holidays, retail sales growth exceeded China’s growth rate by almost a half, with online sales soaring even higher.
During the Golden Week, Chinese retail and catering businesses saw sales of $213 billion, up 8.5% on the same period last year (spending on consumer services is not yet included, but will be released later in the month). New highlights featured spending on tourism, culture and sports, and “first-store economy”; that is, new brands launching their first brick-and-mortal stores.
These figures do not include the highly-popular discount sales that follow after the Golden Week.
Golden Week tourism revenues 8.5% up as well
Prior to the Golden Week, much of international media expected Chinese consumers to cut back on travel, due to trade wars and weaker yuan. In reality. Chinese people may have spent more than ever before at home and abroad.
During the past week, there were 520 million trips on all modes of transportation, with the number of rail passengers up 5.2% on the same period last year, according to the Ministry of Transport. At home, many visited Beijing, Shanghai, Xi’an, Chengdu, Chongqing and Xiamen. Abroad, the top locations featured Japan, Thailand, Korea, Vietnam, Indonesia, even Australia.
In the first Golden Week in 1999, only 29 million Chinese traveled, and all of them domestically. During the past week, almost 780 million domestic tourists – more than half of the mainland’s population – hit the road for vacations; an increase of 7.8% year-on-year. It was the greatest holiday migration in history.
Domestic tourism revenue soared to more than $90 billion; an increase of 8.5% on an annual basis, according to the Ministry of Culture and Tourism. Alipay, China’s leading and smooth online payment platform, confirmed that catering, travel and retail fueled domestic consumption during the holidays.
Currently, every 10th of the 1.4 billion Chinese holds a passport for international travel; that’s a potential of 140 million potential outbound travelers. With increasing prosperity, that figure is expected to double in the next decade.
Rise of Chinese consumption
No global brand can afford to ignore Chinese market any longer. In 2019, China’s economic growth is likely to be around 6%. Yet, in-store sales are estimated at 9% and online shopping at 24% year on yearly basis, according to KPMG.
Similarly, China’s consumer retail market is no longer a dream of the future. Last year, it grew 8% to $5.3 trillion. The Golden week is the country’s second-biggest shopping bonanza, right after Chinese New Year.
Despite US trade protectionism, Chinese tourists reportedly spent $128 billion overseas in the first half of the year. More than half of that was used in Asia, a fourth in the Americas and much of the rest in Europe. The Golden Week sales suggest that a similar pace will prevail toward year-end.
Last week, the biggest airport in the world was opened in Beijing. It was a prelude to the mid-2020s, when China will surpass the US as the largest aviation market, according to the International Air Transport Association. In two decades, Chinese airports could serve 1.6 billion passengers annually.
As China’s middle classes continue to increase and per capita incomes to grow, domestic and global retail and tourism will be major beneficiaries. China’s rise supports economic prospects at home and abroad. As the Golden Week demonstrated, Chinese consumption is now a global force.
About the Author:
Dr Dan Steinbock is the founder of Difference Group and has served at the India, China and America Institute (US), Shanghai Institute for International Studies (China) and the EU Center (Singapore). For more, see https://www.differencegroup.net/
The commentary was released by China Daily on October 10, 2019.
Positive expectations related to the US/China trades negotiations on October 10th prompted a moderately strong upside move in the US major indexes and the stock market.
Additionally, the precious metals fell in correlation to the upside move in the US stock market and presented another opportunity for skilled technical traders to look for entries below $1500 in Gold and below $17.75 in Silver.
We can’t stress the importance of this critical $1500 price level in Gold as a key level for all traders to watch. It has continued to provide key support for Gold since the price rally that initiated in late April 2019. We believe this level will act as a relatively strong price “floor” going forward and any price activity below $1500 could represent a very opportunistic entry area for skilled traders.
Back in early September, we authored this research post highlighting what we believed would happen going forward 30 to 60+ days for Gold. At that time, the price of Gold has just rallied above $1500 for the first time in 2019.
Gold Weekly Chart from Our September 2nd Research Post
This is a Gold Weekly chart from that September 2 research post. We still believe our research from that post is accurate and we believe this new move below $1500 is an incredible opportunity for skilled traders that understand the real potential of the future of precious metals.
120 Minute Gold Chart Showing Price Correction Warning Before it happened
This 120 Minute Gold chart showing the early price decline on October 10, 2019 and highlighting the $1500 price support zone in RED illustrates how price has continued to find this level acting as strong support and how price has, in the past, moved through this level and back above it to form the new “momentum base/bottom” near October 1, 2019.
We believe any move below $1500 (or more precisely – $1495) is a very strong entry point. Obviously, a price move to lower levels would be even better. Currently, as long as price stays above the Momentum Base level (near $1463), then we consider the October 1 price rotation the true momentum base “low”.
Current Daily Chart of Gold – Support Zone, and Forecast
This Daily chart highlights the same $1500 price support zone and clearly illustrates why we believe any price move below $1500 is a very strong opportunity for skilled traders. The next leg in Gold should push prices above $1700 (possibly higher). Longer-term, we believe the fear and uncertainty in the global markets will not subside until well after the 2020 US Presidential election cycle completes.
Concluding Thoughts:
Therefore, we have at least 12 to 16+ months of continued fear driving investor uncertainty in precious metals and as the US political chaos heats up, so will precious metals. At this point, we believe Gold has just started to “lift-off” in terms of the ultimate upside potential over the longer term. We’ve discussed the potential of Gold reaching above $3750 and we believe this target level is very valid.
Yesterday I talked about how to trade and where gold, silver and miners were within their bul/bear market cycle which may surprise you. Listen to my thoughts in this Podcast here.
Play these moves accordingly. This may be the last time you see Gold trading below $1500 for quite a while.
As a technical analysis and trader since 1997, I have been through a few bull/bear market cycles. I believe I have a good pulse on the market and timing key turning points for both short-term swing trading and long-term investment capital. The opportunities are massive/life-changing if handled properly.
Be sure to ride my coattails as I navigate these financial markets and build wealth while others lose nearly everything they own during the next financial crisis.
NOTICE: Our free research does not constitute a trade recommendation or solicitation for our readers to take any action regarding this research. It is provided for educational purposes only. Our research team produces these research articles to share information with our followers/readers in an effort to try to keep you well informed. Visit our web site to learn how to take advantage of our members-only research and trading signals.
The Pound has breached the 1.26 level against the US Dollar for the first time since early-July, and is set for its best two days since 2009. GBPUSD extended Thursday’s gains on hopes that a Brexit deal is becoming increasingly likely.
According the media reports, the EU’s chief negotiator, Michel Barnier, has indicated that both the UK and EU can now discuss the legal draft of the Brexit deal, although an official decision may only be made early next week. This is being interpreted as a positive development by the markets, as it moves the UK further away from a no-deal Brexit, while fueling Sterling’s gains of more than one percent today versus most G10 and Asian currencies.
Brexit talks must overcome political hurdles before it can claim more upside
While the looming October 31 Brexit deadline does provide enough impetus for both sides to reach a deal, any pact must be met with approval at next week’s EU leaders’ summit, followed by Westminster’s consent the following Saturday, October 19. If the Brexit deal can overcome all these political hurdles, then GBPUSD is expected to climb significantly higher and could breach the 1.34 mark.
Still, investors are at risk of getting carried away, as the detailed discussions could yet hit a brick wall. Should the UK-EU negotiations reach yet another impasse over the Brexit deal’s details, the Pound’s recent gains are likely to unravel rapidly back towards the lower 1.20 range.
Pound’s climb aided by softer Dollar amid US-China trade deal optimism
The Pound’s climb has been made easier by the softer Dollar, as the Greenback is now weaker against most G10 currencies, with the Dollar index (DXY) now testing the psychological 98.0 mark. Investors are hoping that some measure of a US-China trade deal will be announced over the coming hours, which is stoking risk-on sentiment while dampening demand for the Greenback. Still, it remains to be seen what the official outcome will be from the ongoing US-China trade negotiations in Washington, and how that will affect the currency markets heading into the weekend.
Disclaimer: The content in this article comprises personal opinions and should not be construed as containing personal and/or other investment advice and/or an offer of and/or solicitation for any transactions in financial instruments and/or a guarantee and/or prediction of future performance. ForexTime (FXTM), its affiliates, agents, directors, officers or employees do not guarantee the accuracy, validity, timeliness or completeness, of any information or data made available and assume no liability as to any loss arising from any investment based on the same.
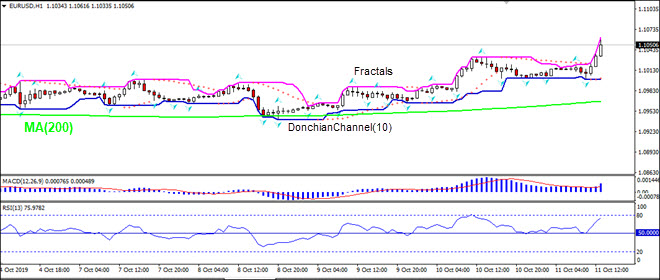
The German inflation rate, measured by the consumer price index change over year, decreased from 1.4% in August to 1.2% in September. Will the EURUSD decline?
The price chart on 1-hour timeframe shows EURUSD: H1 is trading sideways. The price is above the 200-period moving average MA(200) which is rising. And the RSI is rising above 50 level but has not reached the overbought zone yet. There is no trend yet formed, traders have to decide when it would be a best time to enter the market.
Australia’s trade surplus declined as did business and consumer sentiment. Will the AU200 stock index continue advancing?
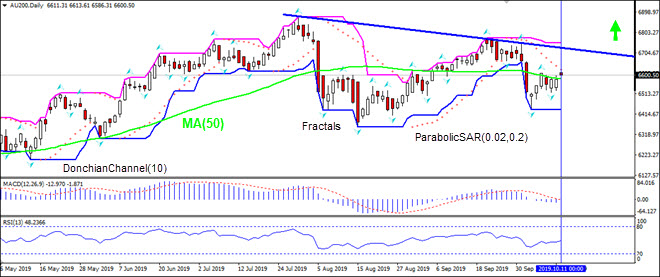
Recent economic data from Australia were mixed: Australia’s retail sales rose in August but trade surplus declined while private sector activities expanded in September after a contraction in August. Retail sales rose by 0.4% in August after stagnant sales in July, driven by stronger spending in restaurants and on household goods. Australia’s trade surplus declined to A$5.926 billion following A$7.253 billion surplus in July, as exports fell by 3%, while imports declined by 0.4%. Markit reported the Commonwealth Bank Composite PMI increased to 52.0 in September from 49.3 in the previous month. And NAB business confidence index declined in September with Westpac Bank Consumer Sentiment Index falling from 98.2 in September to 92.8 in October, its lowest level since July 2015. However the AU200 is entering an uptrend phase on daily tirmeframe chart.
On the daily timeframe AU200: D1 is retracing after breaching above 50-day moving average MA(50).
The Donchian channel indicates no trend: it is flat.
The MACD indicator is below the signal line and the gap is narrowing, which is a bullish signal.
The RSI oscillator is rising and has not reached the overbought zone.
We believe the bullish momentum will continue after the price closes above the upper boundary of Donchian channel at 6608.45. This level can be used as an entry point for placing a pending order to buy. The stop loss can be placed below the fractal low at 6519.31. After placing the order, the stop loss is to be moved every day to the next fractal low, following Parabolic signals. Thus, we are changing the expected profit/loss ratio to the breakeven point. If the price meets the stop loss level (6519.31) without reaching the order (6608.45), we recommend cancelling the order: the market has undergone internal changes which were not taken into account.