Oil prices are still attracting a lot of attention due to their increased volatility.
According to heads of several major global oil and gas companies, the oil will cost about 50 USD per barrel in October 2020. This opinion was voiced at the Oil & Money conference that took place last week. The key risks for the oil are US-China trade wars, an increase in oil extraction and production in the USA, and a slowdown in the global economic growth rate. In other words, the same as right now, meaning that these risks can be considered long-term. This, in its turn, means that they are significantly underestimated and can pull oil prices down at any moment.
The report from Baker Hughes published last Friday showed that the number of rigs in the USA rose for the first time in eight weeks. The total number added 1 unit and is now equal to 856. This being said, the number of oil rigs added 2 units, while gas rigs lost 1.
On Monday morning, October 14th, Brent is trading at 60.22 USD and this price still includes the events that happened the week before – oil prices jumped after reports of Iranian tanker explosion not far from the Red Sea coast of Saudi Arabia.
In the H4 chart, we can see some signs of “Head & Shoulders” reversal pattern. After breaking the top of the first wave at 60.05, Brent is consolidating around 60.35. This structure may be considered as an upside continuation pattern; the entire ascending structure may be considered as the third wave to the upside. After reaching the target, the instrument may start a new correction towards 60.40 and then resume trading inside the uptrend with the first target at 64.10. From the technical point of view, this scenario is confirmed by MACD Oscillator: its signal line is moving above 0. As long as the Oscillator is staying above 0, the uptrend will dominate.
As we can see in the H1 chart, Brent is moving inside a narrow consolidation range around 60.35. Possibly, today the pair may expand the range towards 61.25 and then return to 60.35. After that, the instrument may grow to break 61.25 and then continue trading upwards to reach 62.66. From the technical point of view, this scenario is confirmed by Stochastic Oscillator: its signal line is about to reverse while moving inside the “oversold area”. Practically, the Oscillator tells that the price is trading near the downside border of the consolidation range. The indicator is expected to grow towards 50. Breakout of this level will boost the uptrend.
Disclaimer
Any predictions contained herein are based on the authors’ particular opinion. This analysis shall not be treated as trading advice. RoboForex shall not be held liable for the results of the trades arising from relying upon trading recommendations and reviews contained herein.
This week – October 13 through October 17 – central banks from 2 countries or jurisdictions are scheduled to decide on monetary policy: Singapore and South Korea.
Following table includes the name of the country, the date of the next policy decision, the current policy rate, the result of the last policy decision, the change in the policy rate year to date, and the rate one year ago.
The table is updated when the latest decisions are announced and can always accessed by clicking on This Week.
The mid-month week ahead is expected to remain mostly quiet. Being that it isn’t one of the exciting weeks in terms of data, focus shifts to China’s GDP figures that are due to be released on Friday. The data will provide further insights into the world’s second-largest economy.
Forecasts already point to a modest decline in the GDP to 6.1% from 6.2% previously. Meanwhile, a host of other data includes retail sales and industrial production.
In the US and European markets, the economic data for the week ahead will focus on retail sales, inflation reports from the UK among other things. It is a short week, however, with the US, Japan and Canadian markets closed for business.
Here’s a quick preview into the economic calendar for the week ahead.
Slow Week for the US Dollar
From the economic data perspective, not much is happening for the US dollar. The economic docket will see the retail sales report standing out.
This week is also a short one, as the US markets are opening on Tuesday, following Monday’s Columbus day bank holiday. Still, the data will give some insights into consumer spending.
Slower Retail Sales Expected in September
For the month of September, retail sales are forecast to rise just 0.3% on the month. This marks a second consecutive month of slower retail sales. In August, retail sales slowed to a pace of 0.4% after rising 0.8% in July.
The weaker retail sales are forecast on the back of a dismal auto sales for September. The declines are mostly due to the shorter month and consumer bookings which increased in August due to the Labor day weekend.
Fed Members Take the Stage
A number of Fed members will be speaking over the course of the week. The speeches come as the markets try to find the pulse for the Fed. Expectations are high that the Fed will cut rates twice. But the general narrative from the bank has been mixed.
FOMC members Bullard (dove, voter), Bostic (neutral, non-voter), Daly (neutral, non-voter), Evans (dove, voter) will be speaking over the course of the week.
Will the Sterling React to Economic Reports?
The big news from the UK is the possibility that a Brexit deal could be reached. After months of delays and last-minute efforts, recent reports are optimistic. This comes as British PM met with his Irish counterpart and issued a joint statement.
With less than two weeks to go, the sterling might be muted to the economic data.
UK Inflation to Rise in September
Consumer prices in the United Kingdom were trending lower over the past two years. The Bank of England forecasts that inflation will remain weak into the fourth quarter of the year. This comes due to expectations of weaker domestic demand.
The consensus estimates are for headline CPI to rise 0.3% on the month. This brings the yearly inflation rate to 1.9%, up from 1.7% on the year in August. However, an uptick in inflation is unlikely to see any major shifts from the Bank of England.
UK’s Unemployment Rate to Rise
The monthly jobs report will be coming out on Tuesday, a day before the inflation data. The UK unemployment rate is forecast to rise to 3.9%, up from 3.8% previously. Overall, the UK’s job market has been faring better over the past months. At 3.8%, the unemployment rate is one of the lowest since the 1970s.
But signs of cooling employment is showing amid sluggish economic growth. Brexit uncertainty has hit businesses hard. This could potentially lead to a weaker pace of hiring.
UK average hourly earnings are forecast to rise by 3.9% excluding bonuses on the year. Meanwhile, wages including bonuses are forecast to fall to 3.7%.
Dollar weakening continues as FED says will start purchasing Treasury bulls
US stocks rebound broadened on Friday after president Trump said US reached a “substantial” phase one trade deal with China including Chinese promises to buy $40 – $50 billion more US agricultural products in exchange for eliminating a planned increase in tariffs that had been set to go into effect October 15. The S&P 500 gained 1.4% to 2952.01, rebounding 0.6% for the week. Dow Jones industrial advanced 1.2% to 26816.59. The Nasdaq rose 1.3% to 8057.04. The dollar weakening continued at steady pace as Federal Reserve revealed plans to purchase $60 billion of short-term Treasury debt each month: the live dollar index data show the ICE US Dollar index, a measure of the dollar’s strength against a basket of six rival currencies, fell 0.4% to 98.29 but is higher currently. Stock index futures point to lower openings today.
European indexes rally on Brexit deal hopes
European stocks gains accelerated on Friday on market sentiment boost as UK Prime Minister Boris Johnson and his Irish counterpart announced they had found a possible deal over Britain’s departure from the European Union. Both the EUR/USD and GBP/USD continued their climb Friday with both pairs lower currently. The Stoxx Europe 600 Index gained 2.3%. The DAX 30 rallied 2.9% Friday to 12511.65. France’s CAC 40 rose 1.7% and UK’s FTSE 100 advanced 0.8% to 7247.08.
Shanghai Composite leads Asian Indexes gains
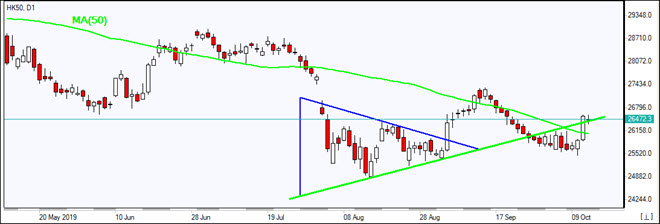
Asian stock indices are solidly higher today after the partial trade deal between the US and China Friday. Stock market in Japan is closed for a holiday with yen resuming its climb against the dollar. China’s markets are rising despite report China’s exports slipped again in September: the Shanghai Composite Index is up 1.2% while Hong Kong’s Hang Seng Index is 0.8% higher. Australia’s All Ordinaries Index added 0.5% as the Australian dollar paired its Friday gain against the greenback.
Brent futures prices are edging lower today. Prices rose on Friday despite Baker Hughes report the number of active US oil rigs rose by 2 to 712 last week: Brent for December settlement ended 2.4% higher at $60.51 a barrel Friday, posting 3.7% gain for the week.
Note: This overview has an informative and tutorial character and is published for free. All the data, included in the overview, are received from public sources, recognized as more or less reliable. Moreover, there is no guarantee that the indicated information is full and precise. Overviews are not updated. The whole information in each overview, including opinion, indicators, charts and anything else, is provided only for familiarization purposes and is not financial advice or а recommendation. The whole text and its any part, as well as the charts cannot be considered as an offer to make a deal with any asset. IFC Markets and its employees under any circumstances are not liable for any action taken by someone else during or after reading the overview.
Here are the latest links to our coverage of the Commitment of Traders data changes.
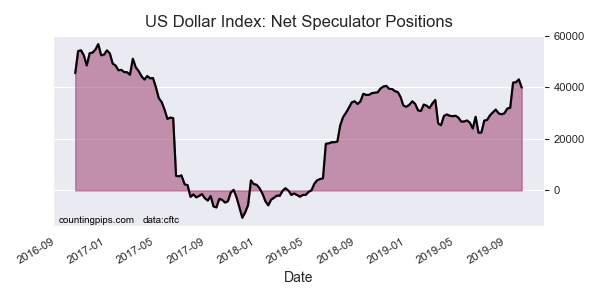
This week in the COT data, currency speculators reduced their US Dollar Index bullish bets for the first time in seven weeks and off of the 2-year highs. The USD has been on a strong run and even counting this week’s decline, the USD has gained in twelve out of the past fifteen weeks.
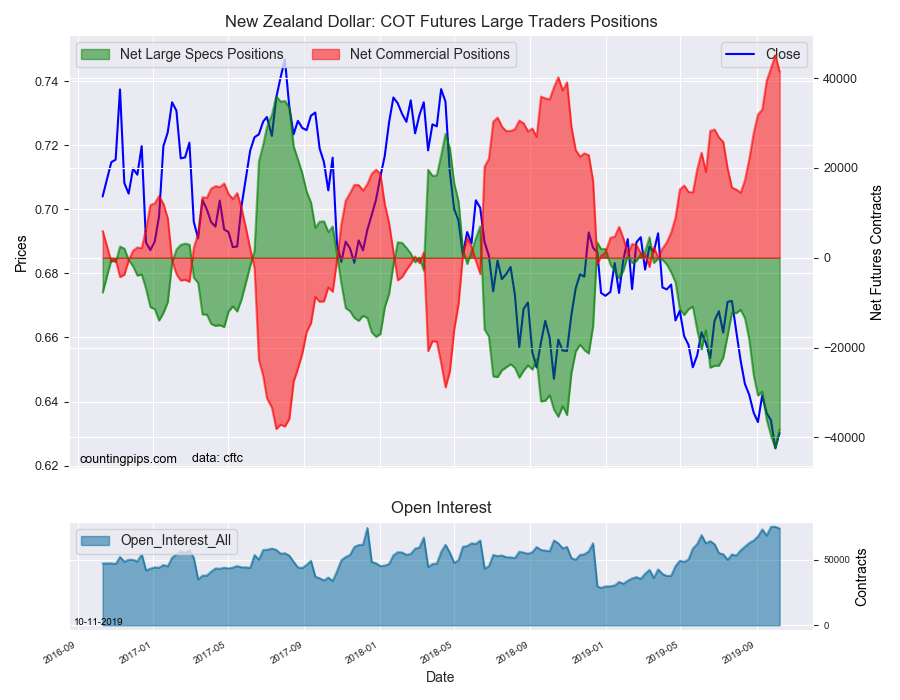
The New Zealand dollar positions also came off their record bearish positions (over -40,000 contracts) of last week as the large speculator position gained by about +4,000 contracts this week.
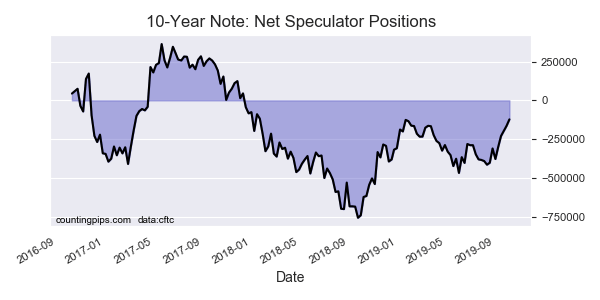
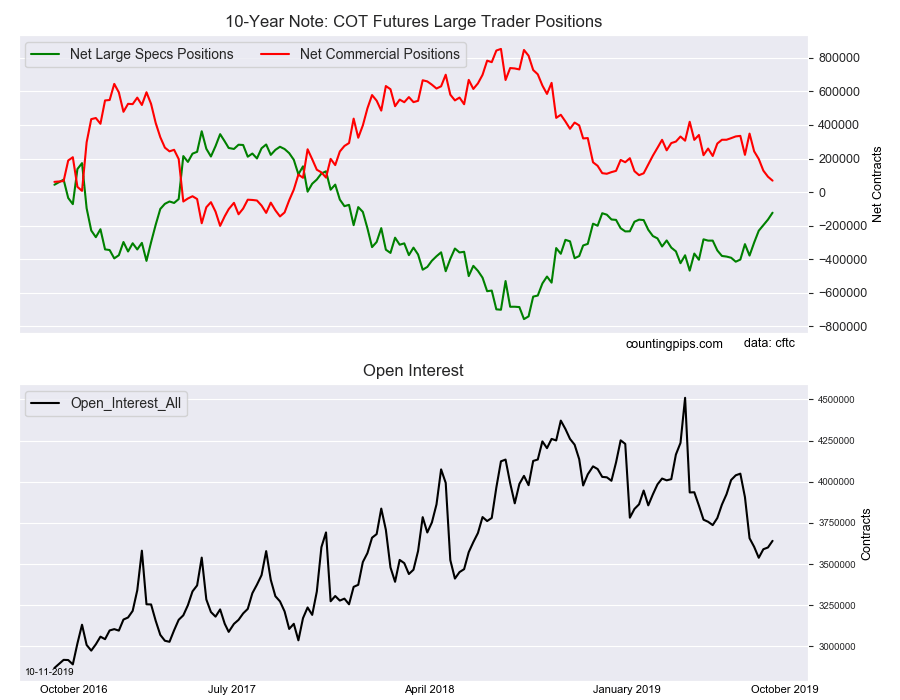
The 10-Year Bond speculators continued to reduce their bearish bets for the fifth straight week and pushed the net position to the least bearish level in 89 weeks. Specs have now cut their bearish bets by a total of 255,307 contracts in just the past five weeks.
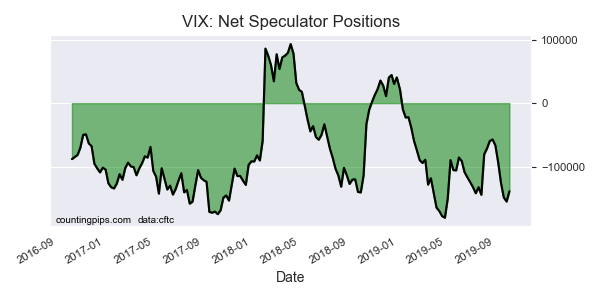
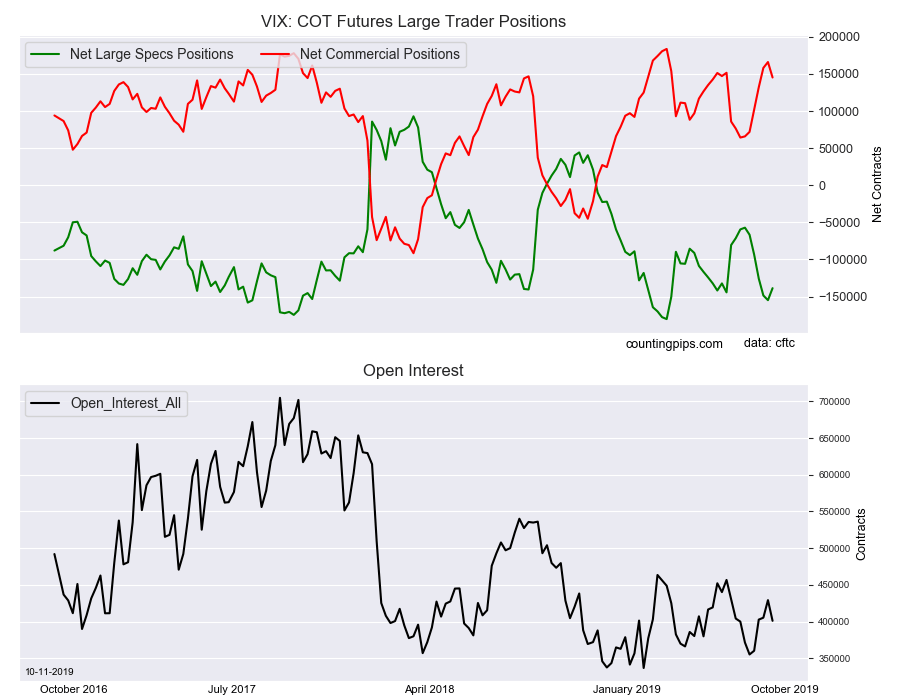
VIX speculators decreased their bearish positions for the first time in six weeks this week. Previously, the VIX spec bearish position had been sharply accelerating and rose to the most bearish level since the April 30th record high position.
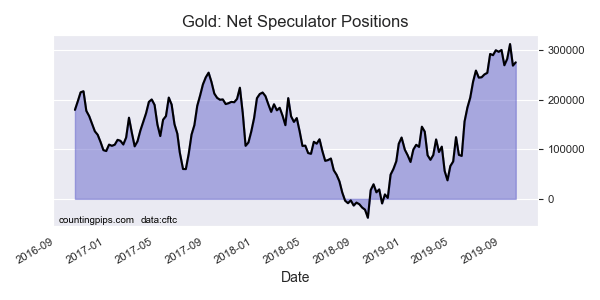
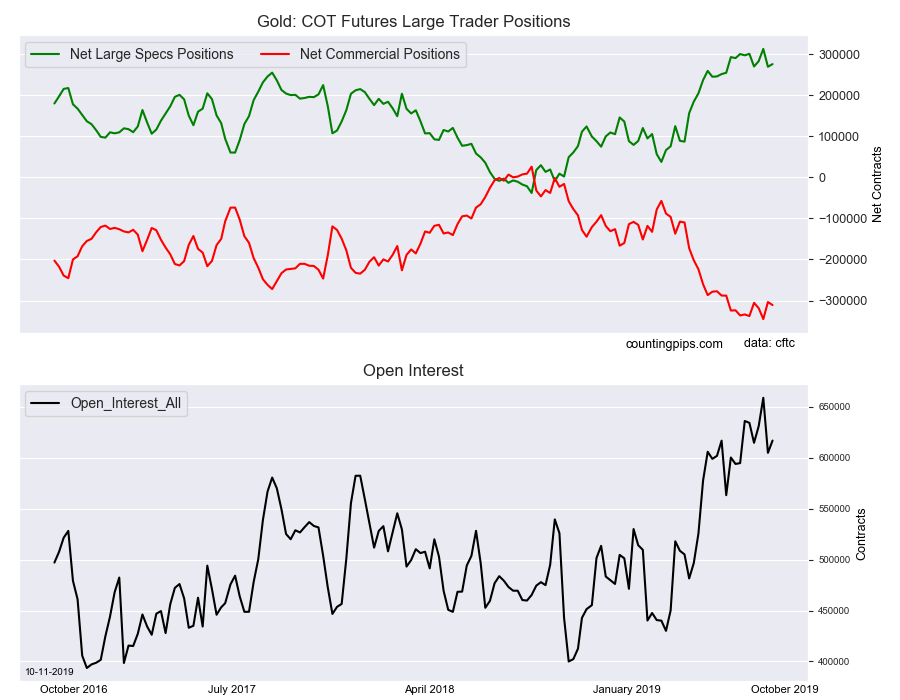
Precious metals speculators were back to adding to their Gold bullish positions this week after a sharp selloff last week by over -40,000 contracts.
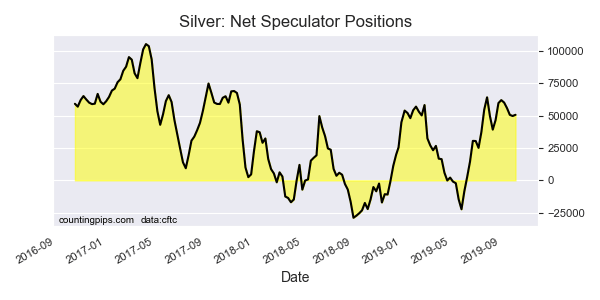
Silver speculator bets rebounded slightly this week after speculators had trimmed their bets for four straight weeks.
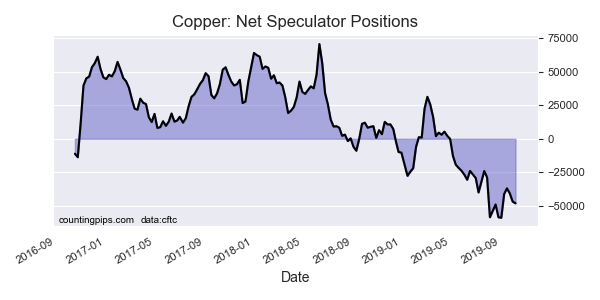
Copper speculators continued to add to their bearish positions for a third consecutive week with contracts rising to highest bearish level since the recent record bearish high on September 3rd at a total of -58,841 contracts.
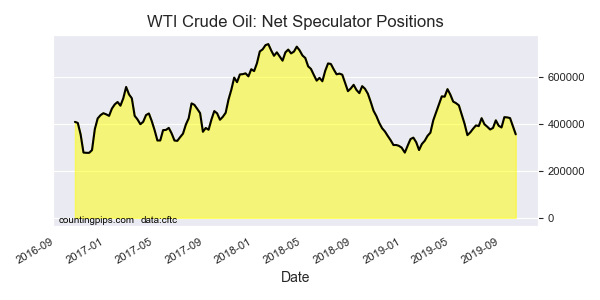
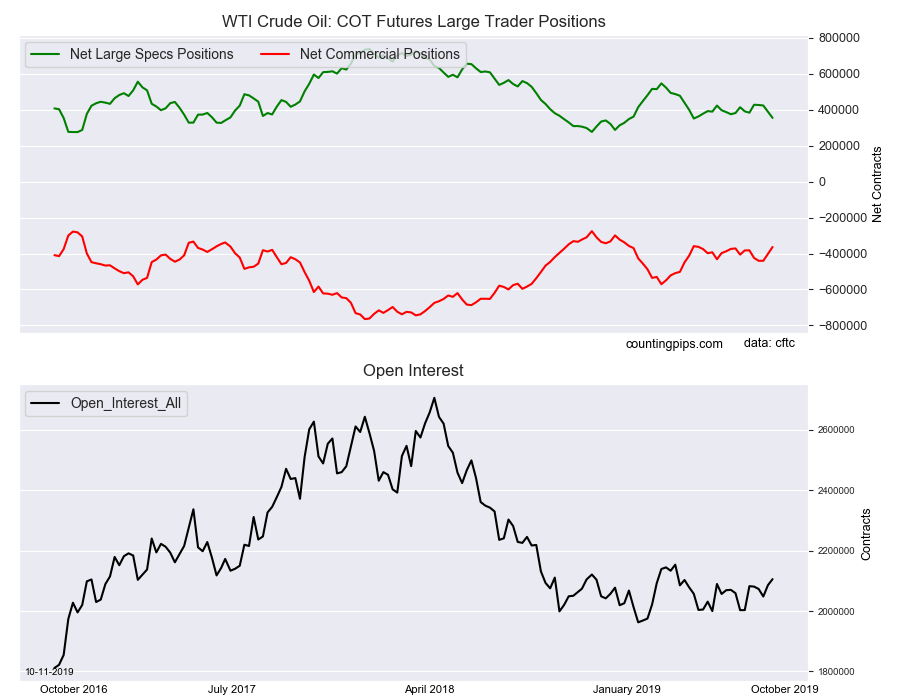
Lastly, the WTI Crude Oil speculators once again sharply cut back on their bullish bets by at least -34,000 contracts for a second straight week and overall, the net position has fallen for a fourth straight week. The overall net position is now at its lowest level since June 11th.
Large currency speculators reduced their net positions in the US Dollar Index futures markets this week, according to the latest Commitment of Traders (COT) data released by the Commodity Futures Trading Commission (CFTC) on Friday. See full article.
The large speculator contracts of WTI crude futures totaled a net position of 355,085 contracts, according to the latest data this week. This was a change of -34,234 contracts from the previous weekly total. See full article.
Large speculator contracts of the 10-Year Bond futures totaled a net position of -122,560 contracts, according to the latest data this week. This was a change of 41,050 contracts from the previous weekly total. See full article.
Large precious metals speculator contracts of the Gold futures totaled a net position of 275,563 contracts, according to the latest data this week. This was a change of 6,570 contracts from the previous weekly total. See full article.
Large stock market volatility speculator contracts of the VIX futures totaled a net position of -138,680 contracts, according to the latest data this week. This was a change of 16,175 contracts from the previous weekly total. See full article.
Large precious metals speculator contracts of the silver futures totaled a net position of 50,754 contracts, according to the latest data this week. This was a change of 939 contracts from the previous weekly total. See full article.
Metals speculator contracts of the copper futures totaled a net position of -48,093 contracts, according to the latest data this week. This was a change of -1,320 contracts from the previous weekly total. See full article.
*COT Report: The COT data, released weekly to the public each Friday, is updated through the most recent Tuesday (data is 3 days old) and shows a quick view of how large speculators or non-commercials (for-profit traders) were positioned in the futures markets.
The CFTC categorizes trader positions according to commercial hedgers (traders who use futures contracts for hedging as part of the business), non-commercials (large traders who speculate to realize trading profits) and nonreportable traders (usually small traders/speculators).
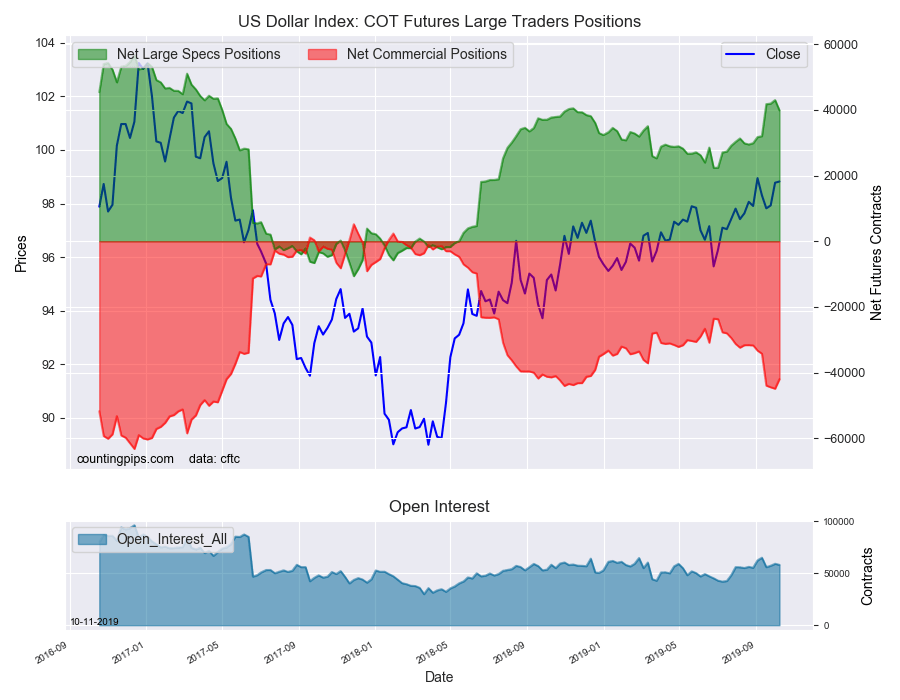
Large currency speculators lowered their net positions in the US Dollar Index futures markets this week following a strong run, according to the latest Commitment of Traders (COT) data released by the Commodity Futures Trading Commission (CFTC) on Friday.
The non-commercial futures contracts of US Dollar Index futures, traded by large speculators and hedge funds, totaled a net position of 39,859 contracts in the data reported through Tuesday October 8th. This was a weekly fall of -3,169 contracts from the previous week which had a total of 43,028 net contracts.
This week’s net position was the result of the gross bullish position (longs) tumbling by -3,591 contracts (to a weekly total of 48,977 contracts) compared to the gross bearish position (shorts) which saw a decrease by -422 contracts on the week (to a total of 9,118 contracts).
US Dollar Index speculators pulled back on their bullish bets for the first time in the past seven weeks. Last week, the spec positions had risen to the most bullish level (+43,028 net contracts) since April 25th of 2017, a span of 127 weeks. The dollar bullish standing has now been above the +30,000 net contract level for six straight weeks and despite the pullback this week, bullish bets have risen in twelve out of the past fifteen weeks.
Individual Currencies Data this week:
In the individual currency contracts data, the major currencies that saw improving speculator positions this week were the British pound sterling (3,873 weekly change in contracts), Swiss franc (488 contracts), Australian dollar (5,358 contracts) and the New Zealand dollar (4,257 contracts).
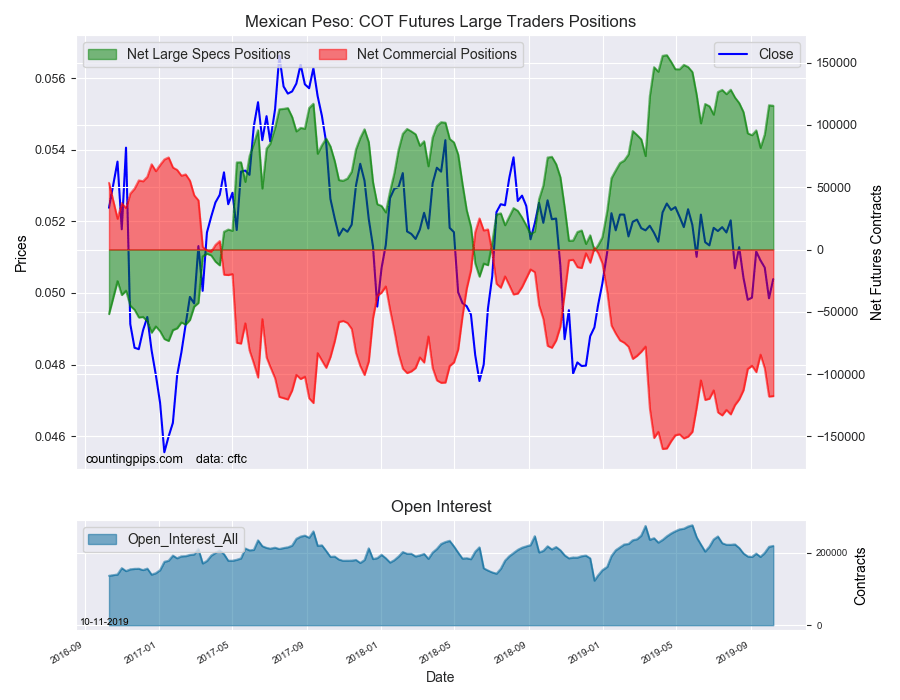
The currencies whose speculative bets declined this week were the US dollar index (-3,169 weekly change in contracts), euro (-9,435 contracts), Japanese yen (-2,905 contracts), Canadian dollar (-1,014 contracts) and the Mexican peso (-416 contracts).
FX Notables:
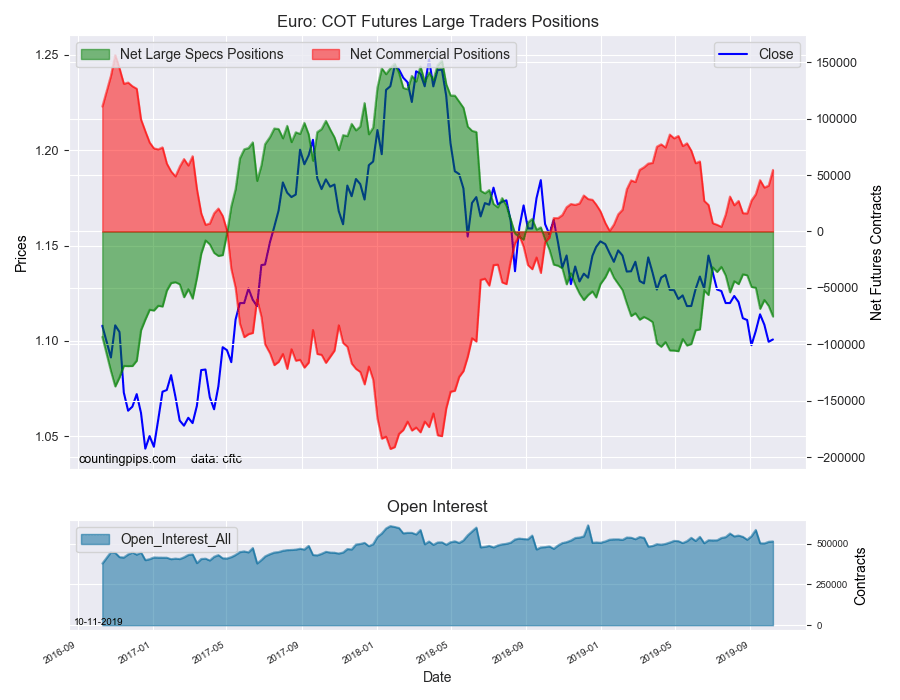
Euro speculator positions continued to see more bearishness this week for a second straight week and for the sixth time out of the past seven weeks. Euro bets are now at the most bearish level since June 18th, a span of 17 weeks. Overall, the euro position has been in bearish territory for 54 consecutive weeks dating back to September 25th of 2018.
New Zealand dollar speculator bets improved this week after dropping to all-time record bearish levels in the previous two straight weeks. The decrease in the bearish positions this week brings the overall speculative position back under the -40,000 contract level after reaching that level last week for the first time in history. The NZD position has now been in bearish territory for thirty straight weeks after falling over from a total long position to a short on March 19th.
See FX position table and the individual currency charts below.
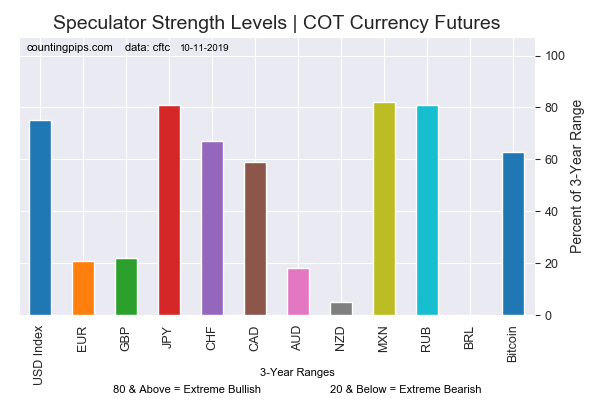
Chart: Current Strength of Each Currency compared to their 3-Year Range
Table of Large Speculator Levels & Weekly Changes:
Currency
Net Speculator Position
Specs Weekly Change
USD Index
39,859
-3,169
EuroFx
-75,413
-9,435
GBP
-73,219
3,873
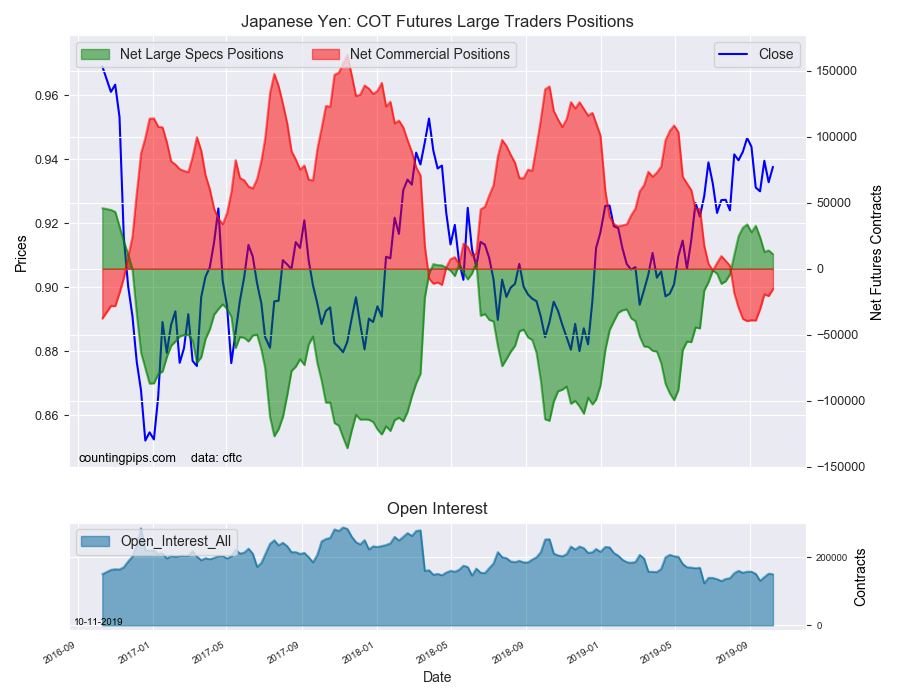
JPY
11,012
-2,905
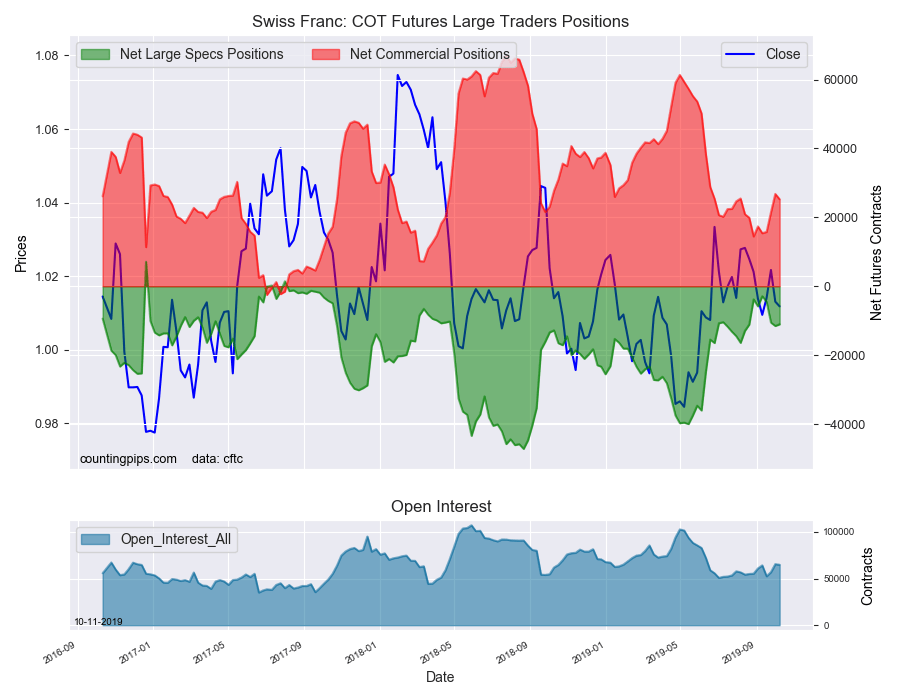
CHF
-11,047
488
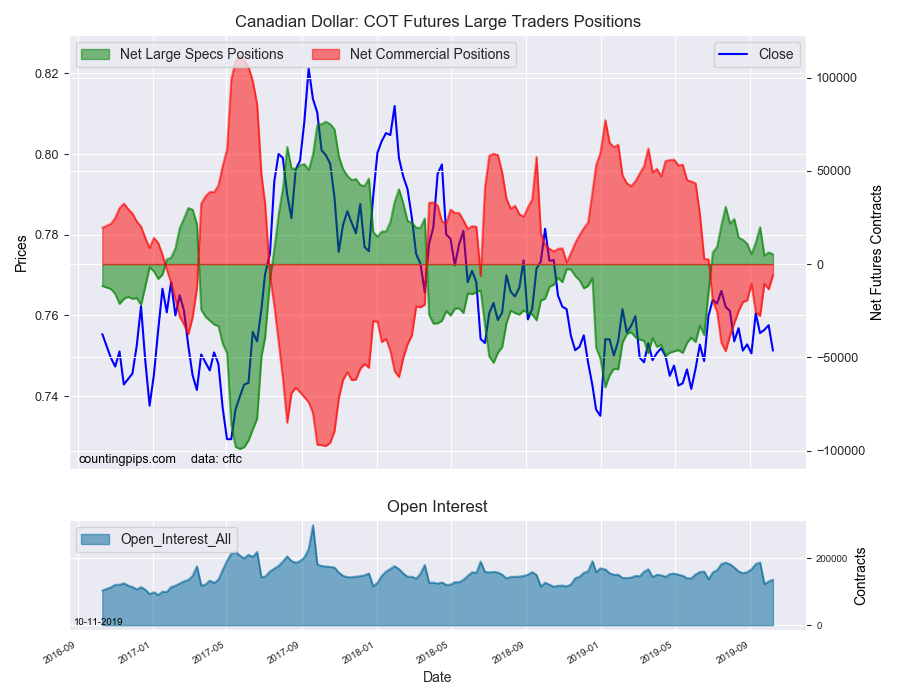
CAD
5,313
-1,014
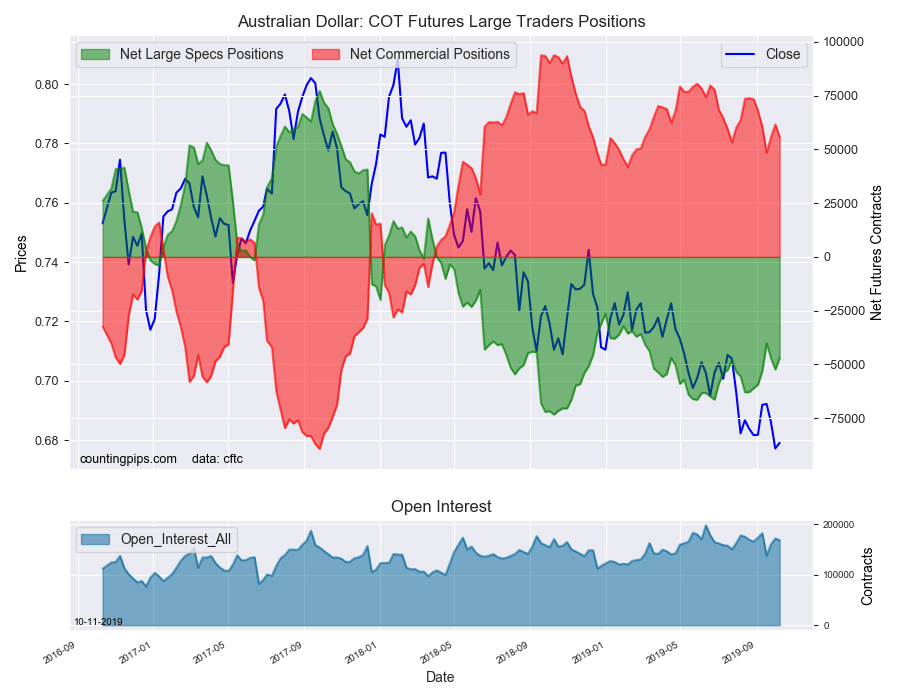
AUD
-46,944
5,358
NZD
-38,217
4,257
MXN
115,396
-416
This latest COT data is through Tuesday and shows a quick view of how large speculators or non-commercials (for-profit traders) were positioned in the futures markets. All currency positions are in direct relation to the US dollar where, for example, a bet for the euro is a bet that the euro will rise versus the dollar while a bet against the euro will be a bet that the dollar will gain versus the euro.
Weekly Charts: Large Trader Weekly Positions vs Price
EuroFX:
The Euro large speculator standing this week equaled a net position of -75,413 contracts in the data reported through Tuesday. This was a weekly fall of -9,435 contracts from the previous week which had a total of -65,978 net contracts.
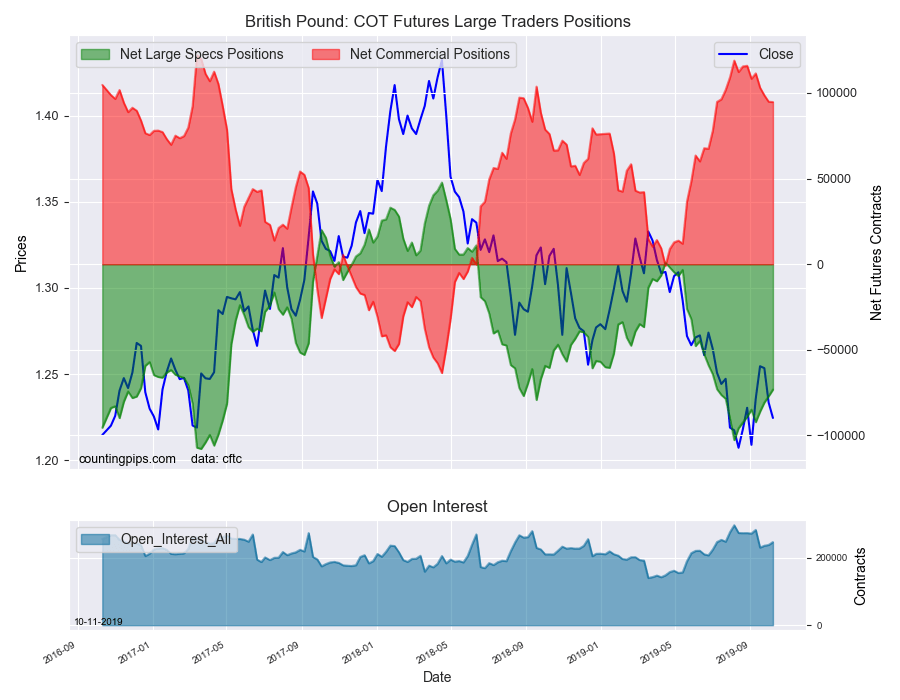
British Pound Sterling:
The large British pound sterling speculator level recorded a net position of -73,219 contracts in the data reported this week. This was a weekly advance of 3,873 contracts from the previous week which had a total of -77,092 net contracts.
Japanese Yen:
Large Japanese yen speculators totaled a net position of 11,012 contracts in this week’s data. This was a weekly lowering of -2,905 contracts from the previous week which had a total of 13,917 net contracts.
Swiss Franc:
The Swiss franc speculator standing this week came in at a net position of -11,047 contracts in the data through Tuesday. This was a weekly rise of 488 contracts from the previous week which had a total of -11,535 net contracts.
Canadian Dollar:
Canadian dollar speculators was a net position of 5,313 contracts this week. This was a reduction of -1,014 contracts from the previous week which had a total of 6,327 net contracts.
Australian Dollar:
The large speculator positions in Australian dollar futures recorded a net position of -46,944 contracts this week in the data ending Tuesday. This was a weekly gain of 5,358 contracts from the previous week which had a total of -52,302 net contracts.
New Zealand Dollar:
The New Zealand dollar speculative standing resulted in a net position of -38,217 contracts this week in the latest COT data. This was a weekly rise of 4,257 contracts from the previous week which had a total of -42,474 net contracts.
Mexican Peso:
Mexican peso speculators equaled a net position of 115,396 contracts this week. This was a weekly decline of -416 contracts from the previous week which had a total of 115,812 net contracts.
*COT Report: The COT data, released weekly to the public each Friday, is updated through the most recent Tuesday (data is 3 days old) and shows a quick view of how large speculators or non-commercials (for-profit traders) were positioned in the futures markets.
The CFTC categorizes trader positions according to commercial hedgers (traders who use futures contracts for hedging as part of the business), non-commercials (large traders who speculate to realize trading profits) and nonreportable traders (usually small traders/speculators).
Large energy speculators continued to reduce their bullish net positions in the WTI Crude Oil futures markets this week, according to the latest Commitment of Traders (COT) data released by the Commodity Futures Trading Commission (CFTC) on Friday.
The non-commercial futures contracts of WTI Crude Oil futures, traded by large speculators and hedge funds, totaled a net position of 355,085 contracts in the data reported through Tuesday October 8th. This was a weekly fall of -34,234 net contracts from the previous week which had a total of 389,319 net contracts.
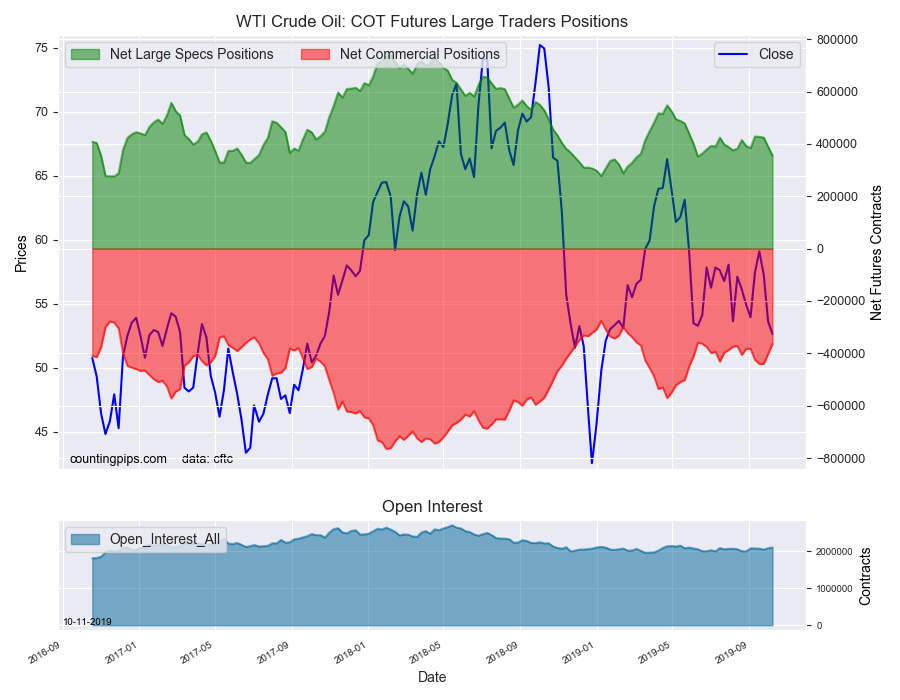
The week’s net position was the result of the gross bullish position (longs) advancing by 5,454 contracts (to a weekly total of 520,283 contracts) while the gross bearish position (shorts) gained by a larger amount of 39,688 contracts for the week (to a total of 165,198 contracts).
Speculators dropped their bullish bets this week for the fourth straight week while in each of the last two weeks, positions have fallen by over -34,000 contracts, respectively. The crude speculative position has now fallen in six out of the past seven weeks to bring the overall net position to its lowest level since June 11th when net bullish bets totaled +351,655 contracts.
WTI Crude Oil Commercial Positions:
The commercial traders position, hedgers or traders engaged in buying and selling for business purposes, totaled a net position of -363,509 contracts on the week. This was a weekly boost of 38,468 contracts from the total net of -401,977 contracts reported the previous week.
WTI Crude Oil Futures:
Over the same weekly reporting time-frame, from Tuesday to Tuesday, the WTI Crude Oil Futures (Front Month) closed at approximately $52.63 which was a drop of $-0.99 from the previous close of $53.62, according to unofficial market data.
*COT Report: The COT data, released weekly to the public each Friday, is updated through the most recent Tuesday (data is 3 days old) and shows a quick view of how large speculators or non-commercials (for-profit traders) as well as the commercial traders (hedgers & traders for business purposes) were positioned in the futures markets.
The CFTC categorizes trader positions according to commercial hedgers (traders who use futures contracts for hedging as part of the business), non-commercials (large traders who speculate to realize trading profits) and nonreportable traders (usually small traders/speculators).
Large bond speculators once again cut back on their bearish net positions in the 10-Year Note futures markets this week, according to the latest Commitment of Traders (COT) data released by the Commodity Futures Trading Commission (CFTC) on Friday.
The non-commercial futures contracts of 10-Year Note futures, traded by large speculators and hedge funds, totaled a net position of -122,560 contracts in the data reported through Tuesday October 8th. This was a weekly change of 41,050 net contracts from the previous week which had a total of -163,610 net contracts.
The week’s net position was the result of the gross bullish position (longs) decreasing by -36,217 contracts (to a weekly total of 604,788 contracts) while the gross bearish position (shorts) dropped by a larger amount of -77,267 contracts for the week (to a total of 727,348 contracts).
Large 10-year speculators continued to decrease their bearish positions this week for the fifth consecutive week. Overall, the spec position have now sliced off a total of 255,307 contracts from the bearish standing in these past five weeks.
The current net standing is now at the least bearish level since January 23rd of 2018, which is a span of eighty-nine weeks.
10-Year Note Commercial Positions:
The commercial traders position, hedgers or traders engaged in buying and selling for business purposes, totaled a net position of 68,361 contracts on the week. This was a weekly decrease of -23,360 contracts from the total net of 91,721 contracts reported the previous week.
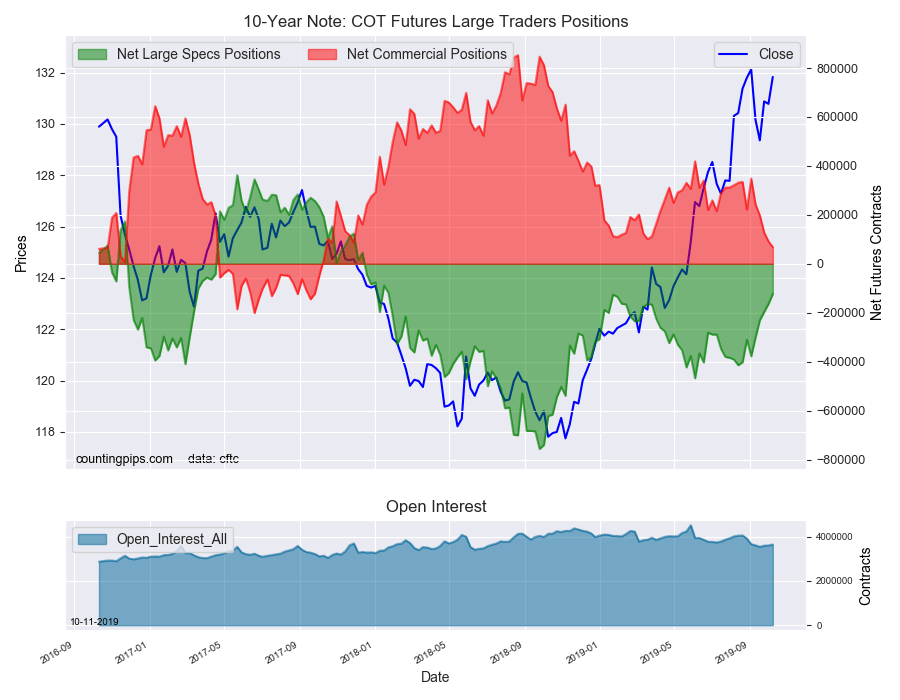
10-Year Note Futures:
Over the same weekly reporting time-frame, from Tuesday to Tuesday, the 10-Year Note Futures (Front Month) closed at approximately $131.82 which was an advance of $1.04 from the previous close of $130.78, according to unofficial market data.
*COT Report: The COT data, released weekly to the public each Friday, is updated through the most recent Tuesday (data is 3 days old) and shows a quick view of how large speculators or non-commercials (for-profit traders) as well as the commercial traders (hedgers & traders for business purposes) were positioned in the futures markets.
The CFTC categorizes trader positions according to commercial hedgers (traders who use futures contracts for hedging as part of the business), non-commercials (large traders who speculate to realize trading profits) and nonreportable traders (usually small traders/speculators).
Large precious metals speculators added to their bullish net positions in the Gold futures markets this week, according to the latest Commitment of Traders (COT) data released by the Commodity Futures Trading Commission (CFTC) on Friday.
The non-commercial futures contracts of Gold futures, traded by large speculators and hedge funds, totaled a net position of 275,563 contracts in the data reported through Tuesday October 8th. This was a weekly change of 6,570 net contracts from the previous week which had a total of 268,993 net contracts.
The week’s net position was the result of the gross bullish position (longs) going up by 11,583 contracts (to a weekly total of 334,383 contracts) while the gross bearish position (shorts) rose by a lesser amount of 5,013 contracts for the week (to a total of 58,820 contracts).
Gold speculators advanced their bullish bets this week following a sharp selloff last week that decreased the bullish position by over -40,000 net contracts. The small rebound this week is the third time bets have gained in the past four weeks.
Overall, the gold position has now risen in fourteen out of the past nineteen weeks, going from a total of +86,688 contracts in late May to a total of +275,563 contracts this week.
Gold Commercial Positions:
The commercial traders position, hedgers or traders engaged in buying and selling for business purposes, totaled a net position of -310,942 contracts on the week. This was a weekly decline of -7,254 contracts from the total net of -303,688 contracts reported the previous week.
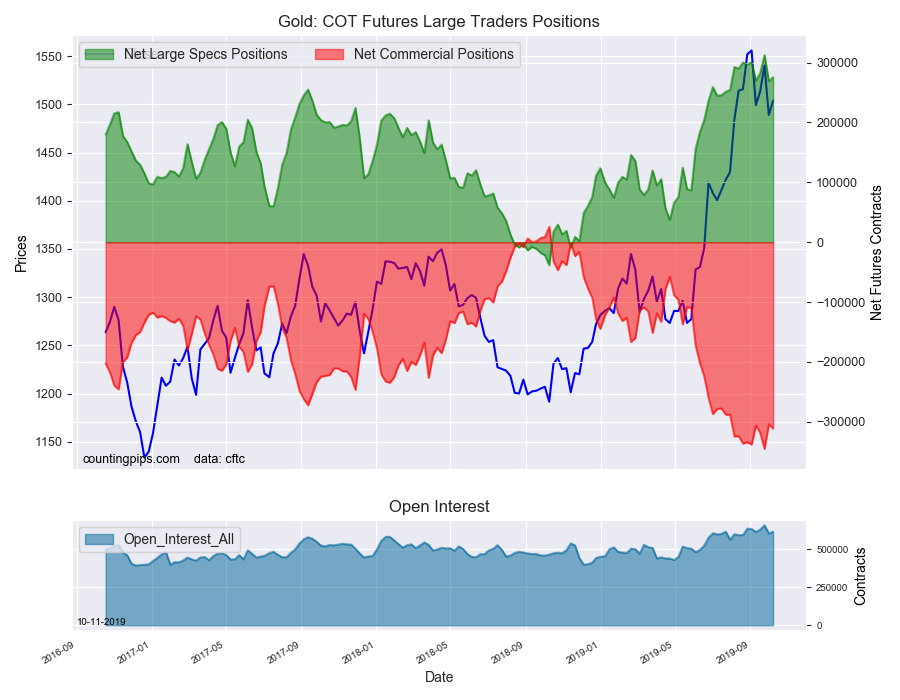
Gold Futures:
Over the same weekly reporting time-frame, from Tuesday to Tuesday, the Gold Futures (Front Month) closed at approximately $1503.90 which was an increase of $14.90 from the previous close of $1489.00, according to unofficial market data.
*COT Report: The COT data, released weekly to the public each Friday, is updated through the most recent Tuesday (data is 3 days old) and shows a quick view of how large speculators or non-commercials (for-profit traders) as well as the commercial traders (hedgers & traders for business purposes) were positioned in the futures markets.
The CFTC categorizes trader positions according to commercial hedgers (traders who use futures contracts for hedging as part of the business), non-commercials (large traders who speculate to realize trading profits) and nonreportable traders (usually small traders/speculators).
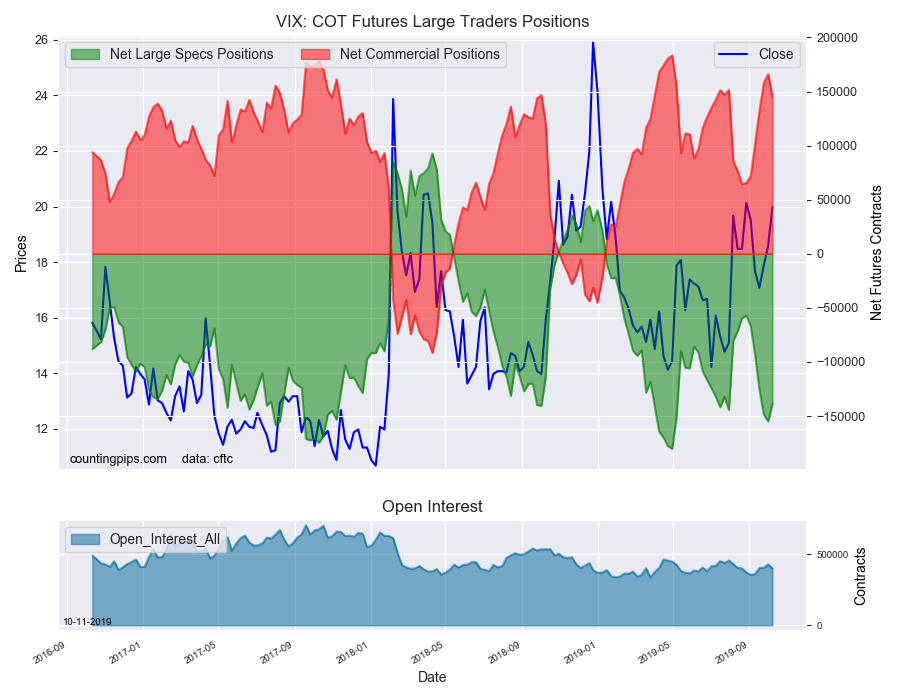
Large volatility speculators reduced their bearish net positions in the VIX futures markets this week, according to the latest Commitment of Traders (COT) data released by the Commodity Futures Trading Commission (CFTC) on Friday.
The non-commercial futures contracts of VIX futures, traded by large speculators and hedge funds, totaled a net position of -138,680 contracts in the data reported through Tuesday October 8th. This was a weekly change of 16,175 net contracts from the previous week which had a total of -154,855 net contracts.
The week’s net position was the result of the gross bullish position (longs) falling by -8,604 contracts (to a weekly total of 76,209 contracts) while the gross bearish position (shorts) dropped by larger amount of -24,779 contracts for the week (to a total of 214,889 contracts).
VIX speculators decreased their bearish bets this week for the first time in the past six weeks. Speculators had been sharply boosting their bearish bets over the previous five weeks and added a total of -97,702 contracts to the overall position in just that time-frame.
The speculators remain strongly bearish with the net position above the -125,000 contract level for a fourth straight week.
VIX Commercial Positions:
The commercial traders position, hedgers or traders engaged in buying and selling for business purposes, totaled a net position of 145,239 contracts on the week. This was a weekly decline of -20,818 contracts from the total net of 166,057 contracts reported the previous week.
VIX Futures:
Over the same weekly reporting time-frame, from Tuesday to Tuesday, the VIX Futures (Front Month) closed at approximately $19.97 which was an uptick of $1.40 from the previous close of $18.57, according to unofficial market data.
*COT Report: The COT data, released weekly to the public each Friday, is updated through the most recent Tuesday (data is 3 days old) and shows a quick view of how large speculators or non-commercials (for-profit traders) as well as the commercial traders (hedgers & traders for business purposes) were positioned in the futures markets.
The CFTC categorizes trader positions according to commercial hedgers (traders who use futures contracts for hedging as part of the business), non-commercials (large traders who speculate to realize trading profits) and nonreportable traders (usually small traders/speculators).