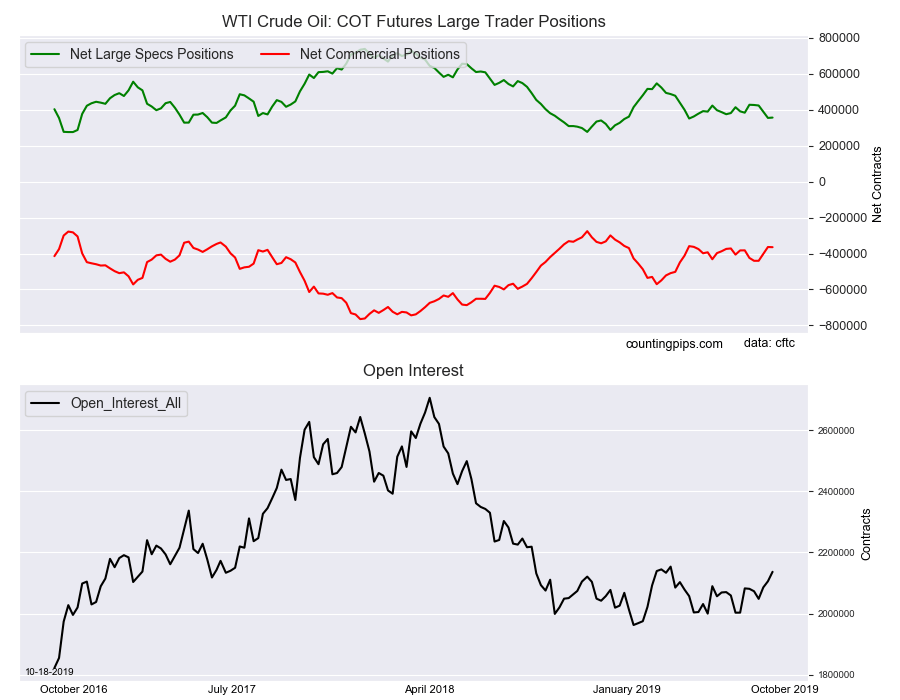
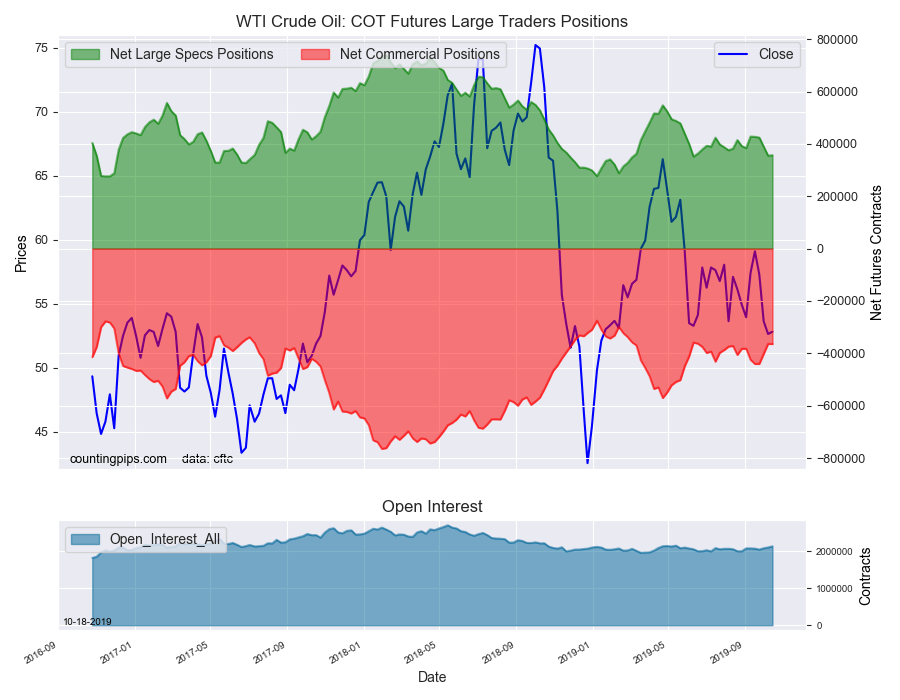
Large energy speculators slightly bumped up their bullish net positions in the WTI Crude Oil futures markets this week, according to the latest Commitment of Traders (COT) data released by the Commodity Futures Trading Commission (CFTC) on Friday.
The non-commercial futures contracts of WTI Crude Oil futures, traded by large speculators and hedge funds, totaled a net position of 356,884 contracts in the data reported through Tuesday October 15th. This was a weekly change of 1,799 net contracts from the previous week which had a total of 355,085 net contracts.
The week’s net position was the result of the gross bullish position (longs) going up by 16,123 contracts (to a weekly total of 536,406 contracts) while the gross bearish position (shorts) that also rose but by a lesser amount of 14,324 contracts for the week (to a total of 179,522 contracts).
Crude oil speculators edged their bullish bets slightly higher this week following four weeks of declining positions. The bullish position had decreased by a total of -73,120 contracts in the previous four weeks and fell to the lowest level since June 11th when net bullish bets totaled +351,655 contracts. The current bullish level has now been under the +400,000 net contract level for three straight weeks.
WTI Crude Oil Commercial Positions:
The commercial traders position, hedgers or traders engaged in buying and selling for business purposes, totaled a net position of -364,457 contracts on the week. This was a weekly decrease of -948 contracts from the total net of -363,509 contracts reported the previous week.
WTI Crude Oil Futures:
Over the same weekly reporting time-frame, from Tuesday to Tuesday, the WTI Crude Oil Futures (Front Month) closed at approximately $52.81 which was an uptick of $0.18 from the previous close of $52.63, according to unofficial market data.
*COT Report: The COT data, released weekly to the public each Friday, is updated through the most recent Tuesday (data is 3 days old) and shows a quick view of how large speculators or non-commercials (for-profit traders) as well as the commercial traders (hedgers & traders for business purposes) were positioned in the futures markets.
The CFTC categorizes trader positions according to commercial hedgers (traders who use futures contracts for hedging as part of the business), non-commercials (large traders who speculate to realize trading profits) and nonreportable traders (usually small traders/speculators).
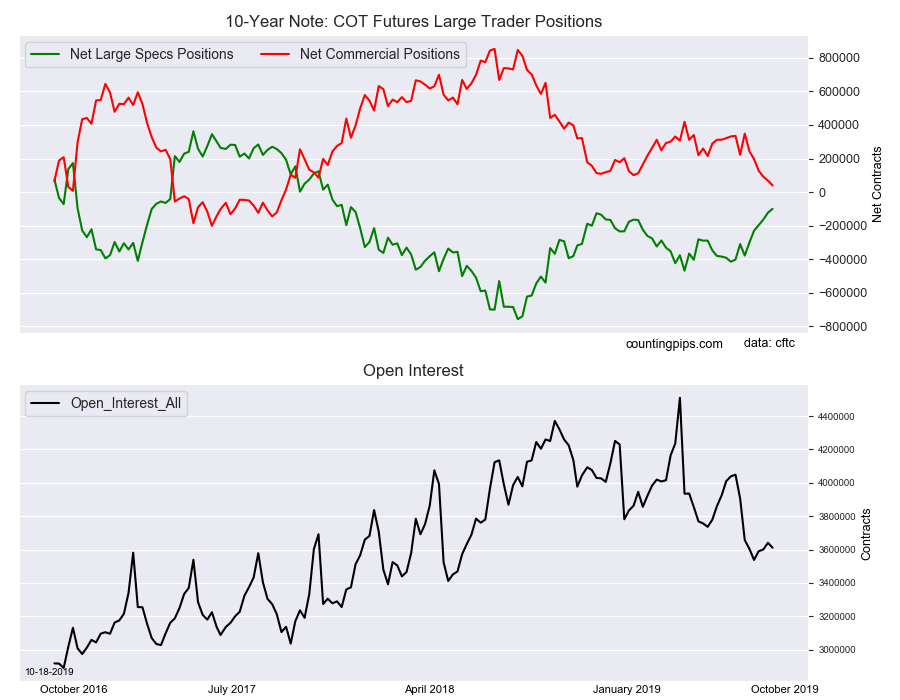
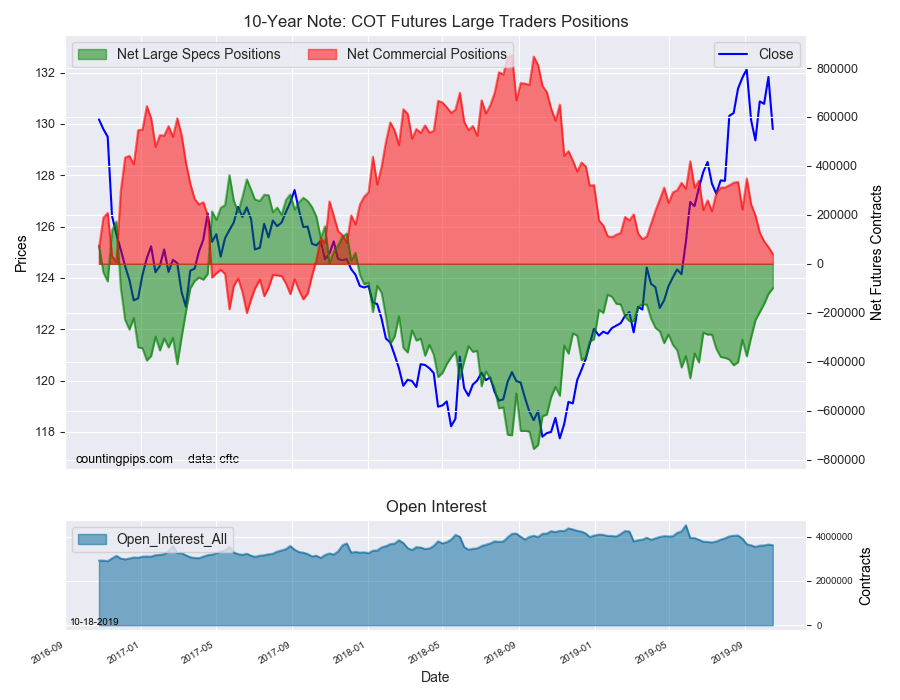
Large bond speculators continued to decrease their bearish net positions in the 10-Year Note futures markets this week, according to the latest Commitment of Traders (COT) data released by the Commodity Futures Trading Commission (CFTC) on Friday.
The non-commercial futures contracts of 10-Year Note futures, traded by large speculators and hedge funds, totaled a net position of -99,692 contracts in the data reported through Tuesday October 15th. This was a weekly change of 22,868 net contracts from the previous week which had a total of -122,560 net contracts.
The week’s net position was the result of the gross bullish position (longs) gaining by 56,551 contracts (to a weekly total of 661,339 contracts) while the gross bearish position (shorts) also rose by 33,683 contracts for the week (to a total of 761,031 contracts).
10-Year speculators cut back on their bearish positions for the sixth consecutive week this week. Speculators have now reduced their bearish bets by a total of 278,175 contracts over that six-week period. The speculative standing is now at the least bearish level since January 16th of 2018 which is a span of ninety-one straight weeks.
10-Year Note Commercial Positions:
The commercial traders position, hedgers or traders engaged in buying and selling for business purposes, totaled a net position of 39,989 contracts on the week. This was a weekly decline of -28,372 contracts from the total net of 68,361 contracts reported the previous week.
10-Year Note Futures:
Over the same weekly reporting time-frame, from Tuesday to Tuesday, the 10-Year Note Futures (Front Month) closed at approximately $129.79 which was a decline of $-2.03 from the previous close of $131.82, according to unofficial market data.
*COT Report: The COT data, released weekly to the public each Friday, is updated through the most recent Tuesday (data is 3 days old) and shows a quick view of how large speculators or non-commercials (for-profit traders) as well as the commercial traders (hedgers & traders for business purposes) were positioned in the futures markets.
The CFTC categorizes trader positions according to commercial hedgers (traders who use futures contracts for hedging as part of the business), non-commercials (large traders who speculate to realize trading profits) and nonreportable traders (usually small traders/speculators).
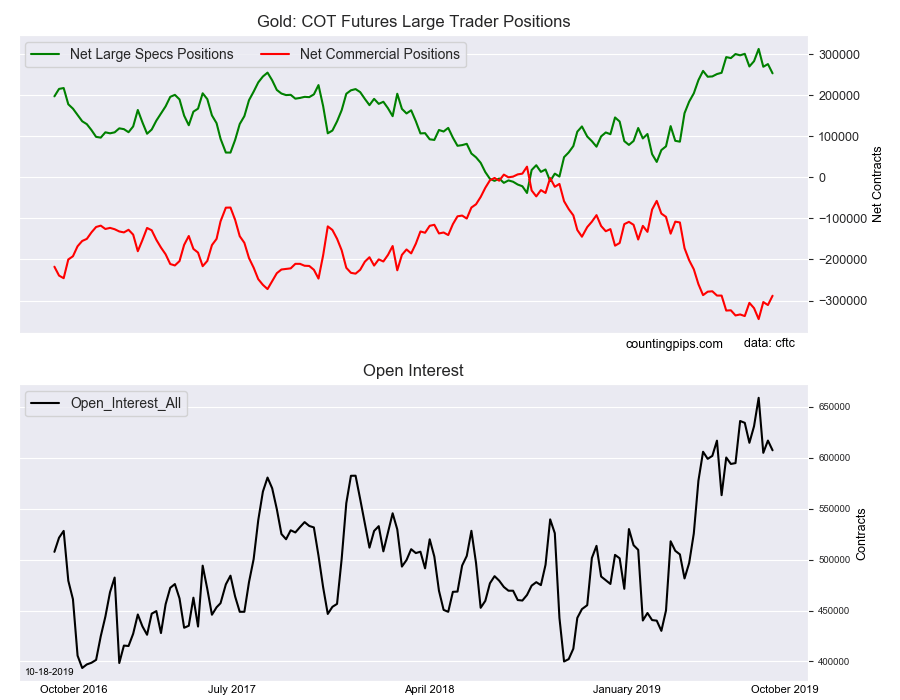
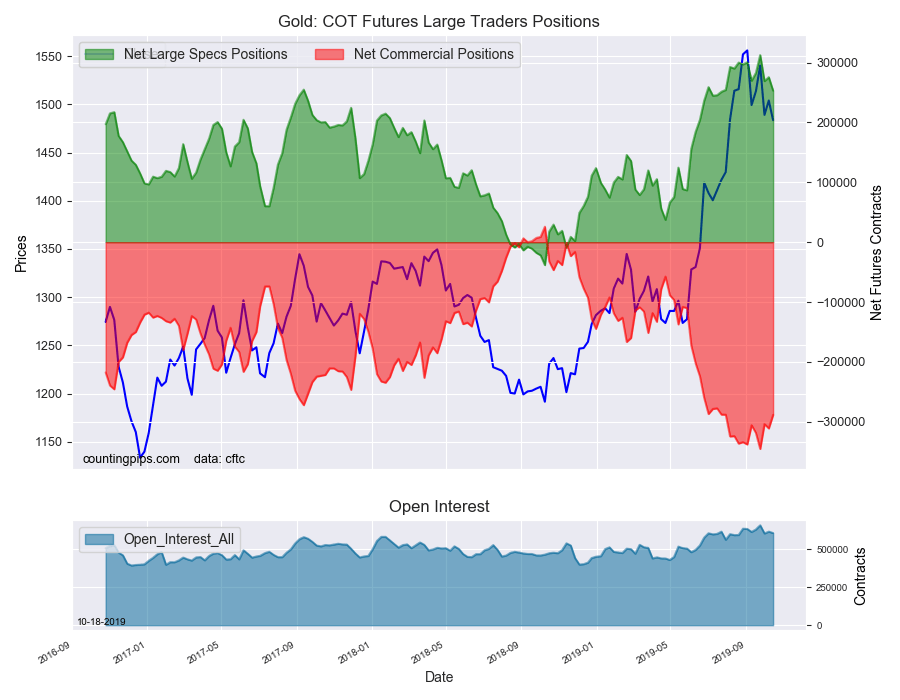
Large precious metals speculators strongly cut back on their bullish net positions in the Gold futures markets this week, according to the latest Commitment of Traders (COT) data released by the Commodity Futures Trading Commission (CFTC) on Friday.
The non-commercial futures contracts of Gold futures, traded by large speculators and hedge funds, totaled a net position of 253,027 contracts in the data reported through Tuesday October 15th. This was a weekly decline of -22,536 net contracts from the previous week which had a total of 275,563 net contracts.
The week’s net position was the result of the gross bullish position (longs) decreasing by -15,013 contracts (to a weekly total of 319,370 contracts) while the gross bearish position (shorts) increased by 7,523 contracts for the week (to a total of 66,343 contracts).
Gold speculators sharply reduced their bullish bets for the second time out of the past three weeks and have now trimmed off a total of -59,417 contracts in that time-frame. Previously, gold speculators had been steadily raising their bullish positions which culminated with a jump to a three-year high on September 24th at over +312,000 contracts. Currently, the overall bullish standing has now dipped to the lowest level since July 23rd, a span of twelve weeks.
Gold Commercial Positions:
The commercial traders position, hedgers or traders engaged in buying and selling for business purposes, totaled a net position of -288,275 contracts on the week. This was a weekly boost of 22,667 contracts from the total net of -310,942 contracts reported the previous week.
Gold Futures:
Over the same weekly reporting time-frame, from Tuesday to Tuesday, the Gold Futures (Front Month) closed at approximately $1483.50 which was a decline of $-20.40 from the previous close of $1503.90, according to unofficial market data.
*COT Report: The COT data, released weekly to the public each Friday, is updated through the most recent Tuesday (data is 3 days old) and shows a quick view of how large speculators or non-commercials (for-profit traders) as well as the commercial traders (hedgers & traders for business purposes) were positioned in the futures markets.
The CFTC categorizes trader positions according to commercial hedgers (traders who use futures contracts for hedging as part of the business), non-commercials (large traders who speculate to realize trading profits) and nonreportable traders (usually small traders/speculators).
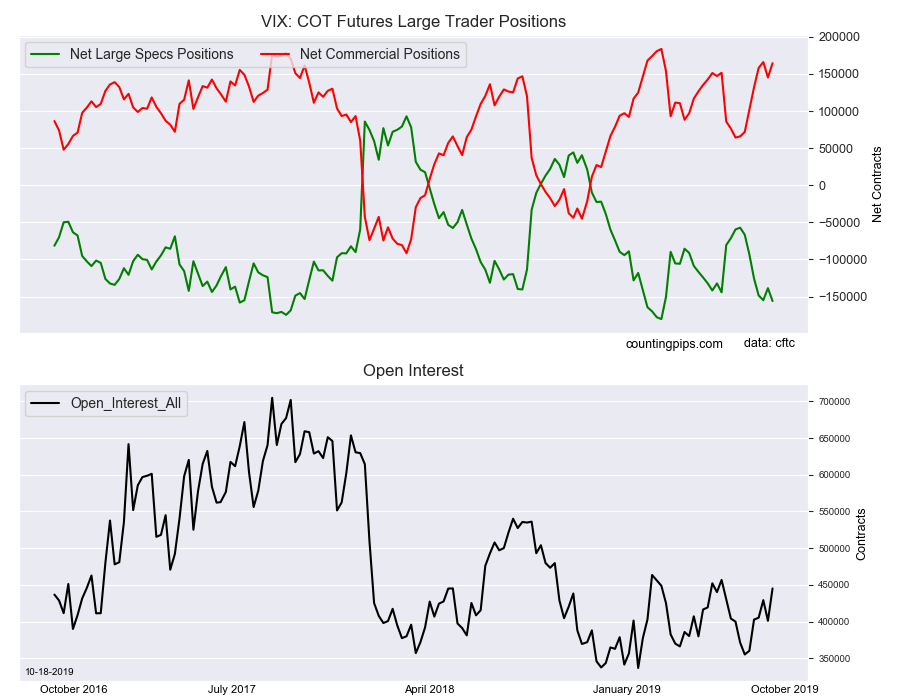
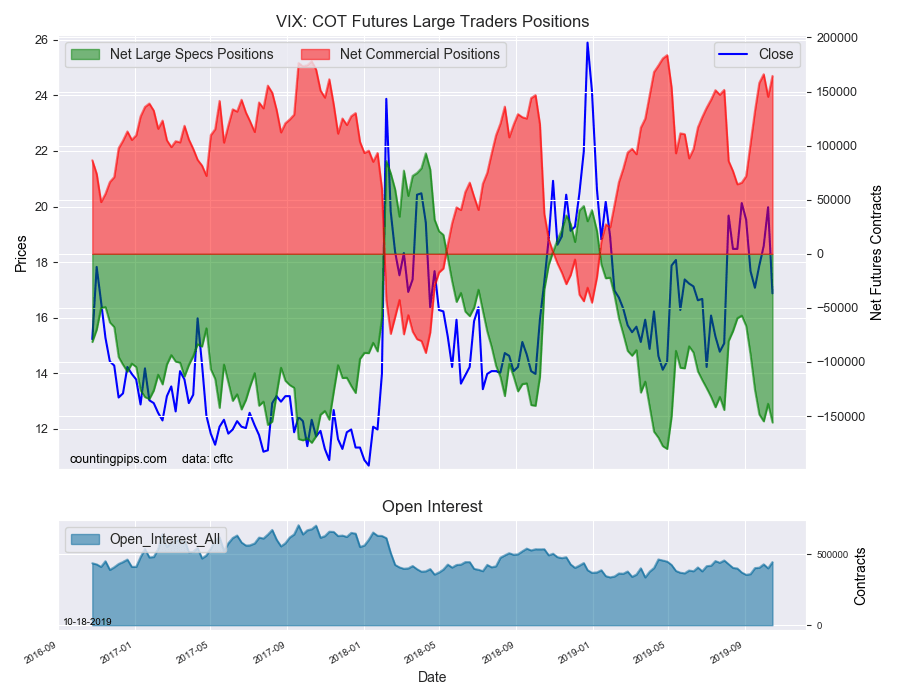
Large volatility speculators boosted their bearish net positions in the VIX futures markets this week, according to the latest Commitment of Traders (COT) data released by the Commodity Futures Trading Commission (CFTC) on Friday.
The non-commercial futures contracts of VIX futures, traded by large speculators and hedge funds, totaled a net position of -155,980 contracts in the data reported through Tuesday October 15th. This was a weekly change of -17,300 net contracts from the previous week which had a total of -138,680 net contracts.
The week’s net position was the result of the gross bullish position (longs) going up by 4,316 contracts (to a weekly total of 80,525 contracts) while the gross bearish position (shorts) rose by a greater amount of 21,616 contracts for the week (to a total of 236,505 contracts).
VIX speculators have now raised their bearish bets for the sixth time out of the past seven weeks as traders continue to bet on lower volatility. The past seven weeks have seen a total of -98,827 contracts added to the existing bearish position. This week’s standing is now the most bearish level for the VIX speculators since April 30th when bets hit a record bearish level of -180,359 contracts.
VIX Commercial Positions:
The commercial traders position, hedgers or traders engaged in buying and selling for business purposes, totaled a net position of 164,490 contracts on the week. This was a weekly uptick of 19,251 contracts from the total net of 145,239 contracts reported the previous week.
VIX Futures:
Over the same weekly reporting time-frame, from Tuesday to Tuesday, the VIX Futures (Front Month) closed at approximately $16.87 which was a shortfall of $-3.10 from the previous close of $19.97, according to unofficial market data.
*COT Report: The COT data, released weekly to the public each Friday, is updated through the most recent Tuesday (data is 3 days old) and shows a quick view of how large speculators or non-commercials (for-profit traders) as well as the commercial traders (hedgers & traders for business purposes) were positioned in the futures markets.
The CFTC categorizes trader positions according to commercial hedgers (traders who use futures contracts for hedging as part of the business), non-commercials (large traders who speculate to realize trading profits) and nonreportable traders (usually small traders/speculators).
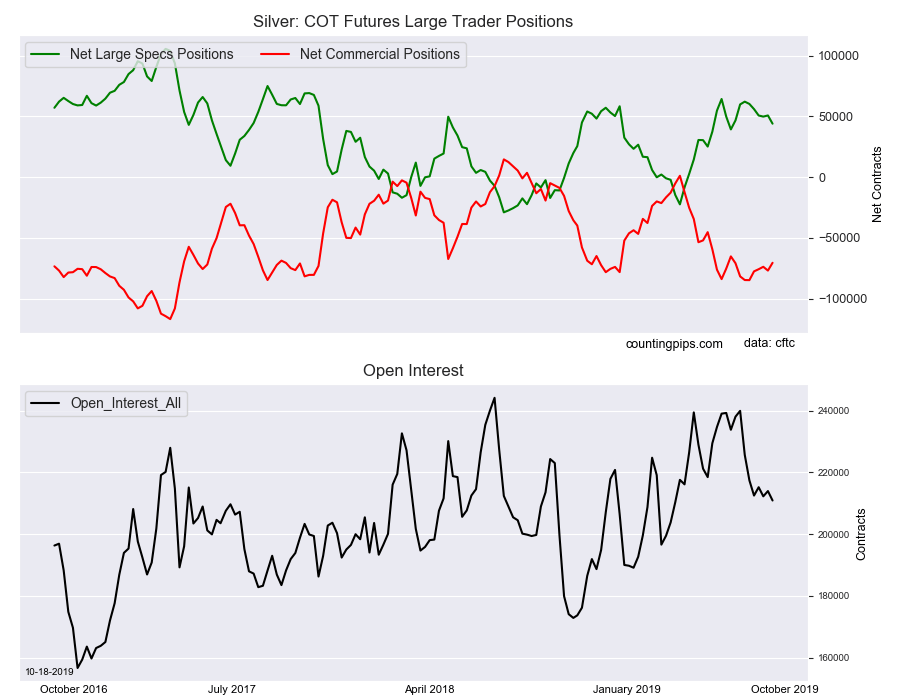
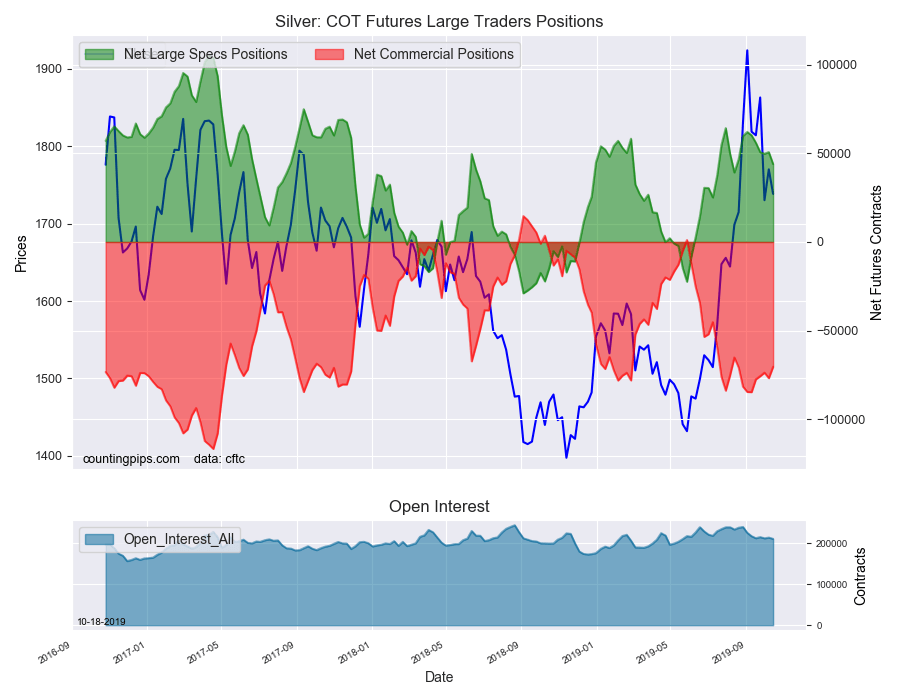
Large precious metals speculators once again decreased their bullish net positions in the Silver futures markets this week, according to the latest Commitment of Traders (COT) data released by the Commodity Futures Trading Commission (CFTC) on Friday.
The non-commercial futures contracts of Silver futures, traded by large speculators and hedge funds, totaled a net position of 43,989 contracts in the data reported through Tuesday October 15th. This was a weekly decline of -6,765 net contracts from the previous week which had a total of 50,754 net contracts.
The week’s net position was the result of the gross bullish position (longs) tumbling by -5,004 contracts (to a weekly total of 85,088 contracts) while the gross bearish position (shorts) gained by 1,761 contracts for the week (to a total of 41,099 contracts).
Silver speculators reduced their bullish bets for the fifth time out of the past six weeks. This recent drop in sentiment follows the strong run over the summer that had seen bullish positions rise in ten out of the previous fourteen weeks. The overall bullish standing is now at the lowest level of the past nine weeks, dating back to August 13th.
Silver Commercial Positions:
The commercial traders position, hedgers or traders engaged in buying and selling for business purposes, totaled a net position of -70,487 contracts on the week. This was a weekly boost of 6,419 contracts from the total net of -76,906 contracts reported the previous week.
Silver Futures:
Over the same weekly reporting time-frame, from Tuesday to Tuesday, the Silver Futures (Front Month) closed at approximately $1738.40 which was a fall of $-31.60 from the previous close of $1770.00, according to unofficial market data.
*COT Report: The COT data, released weekly to the public each Friday, is updated through the most recent Tuesday (data is 3 days old) and shows a quick view of how large speculators or non-commercials (for-profit traders) as well as the commercial traders (hedgers & traders for business purposes) were positioned in the futures markets.
The CFTC categorizes trader positions according to commercial hedgers (traders who use futures contracts for hedging as part of the business), non-commercials (large traders who speculate to realize trading profits) and nonreportable traders (usually small traders/speculators).
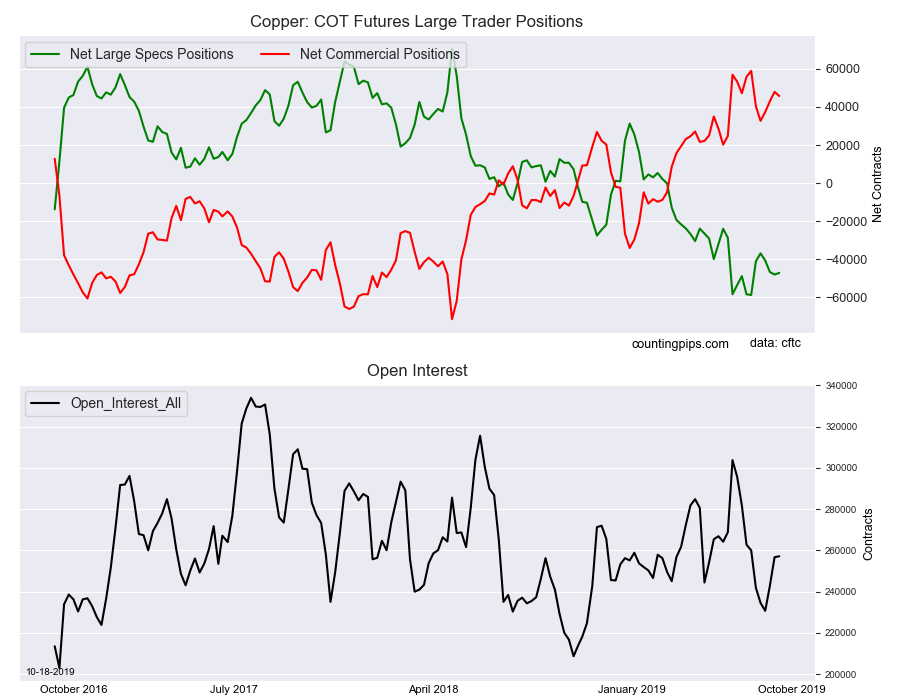
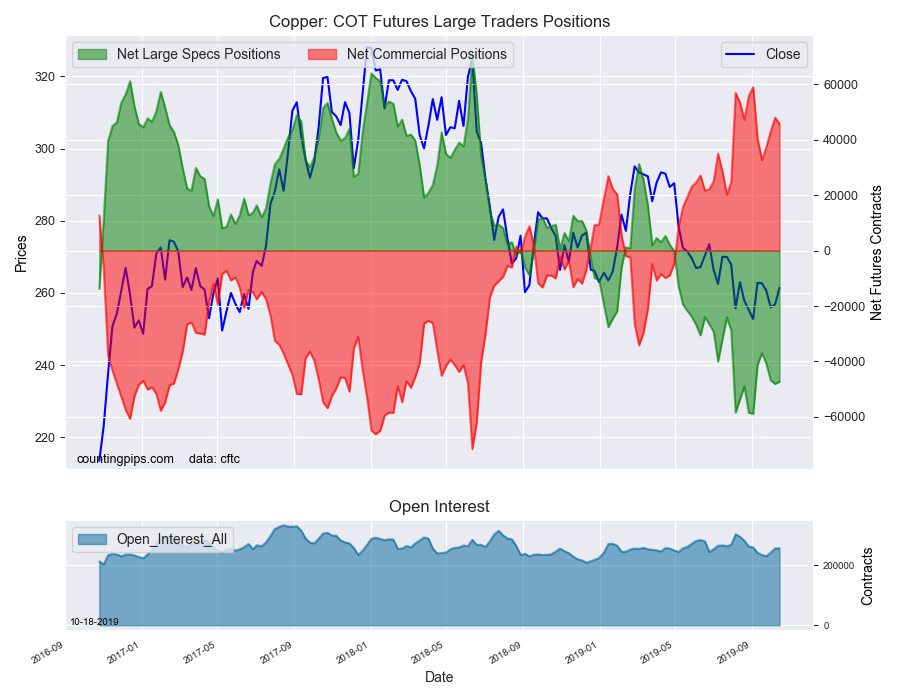
Large precious metals speculators slightly trimmed their bearish net positions lower in the Copper futures markets this week, according to the latest Commitment of Traders (COT) data released by the Commodity Futures Trading Commission (CFTC) on Friday.
The non-commercial futures contracts of Copper futures, traded by large speculators and hedge funds, totaled a net position of -47,255 contracts in the data reported through Tuesday October 15th. This was a weekly change of 838 net contracts from the previous week which had a total of -48,093 net contracts.
The week’s net position was the result of the gross bullish position (longs) lowering by -2,501 contracts (to a weekly total of 67,383 contracts) while the gross bearish position (shorts) fell by -3,339 contracts for the week (to a total of 114,638 contracts).
Copper speculators slightly pared their bearish bets this week following three straight weeks of gaining bearish positions. The copper speculative position has continued to be highly bearish and recently reached a record high bearish level on September 3rd at a total of -58,841 contracts. Overall, copper bets have now been in bearish territory for twenty-five straight weeks.
Copper Commercial Positions:
The commercial traders position, hedgers or traders engaged in buying and selling for business purposes, totaled a net position of 45,778 contracts on the week. This was a weekly drop of -2,203 contracts from the total net of 47,981 contracts reported the previous week.
Copper Futures:
Over the same weekly reporting time-frame, from Tuesday to Tuesday, the Copper Futures (Front Month) closed at approximately $261.4 which was an increase of $4.55 from the previous close of $256.85, according to unofficial market data.
*COT Report: The COT data, released weekly to the public each Friday, is updated through the most recent Tuesday (data is 3 days old) and shows a quick view of how large speculators or non-commercials (for-profit traders) as well as the commercial traders (hedgers & traders for business purposes) were positioned in the futures markets.
The CFTC categorizes trader positions according to commercial hedgers (traders who use futures contracts for hedging as part of the business), non-commercials (large traders who speculate to realize trading profits) and nonreportable traders (usually small traders/speculators).
A glance at the deal is provided in a Pareto Securities report.
In an Oct. 15 research report, Pareto Securities analyst Tom Erik Kristiansen reported that this morning, Seplat Petroleum Development Co. Plc (SEPL:LSE) offered to acquire Eland Oil & Gas Plc (ELA:LSE) for GBp166 per share. “We view it as fair,” he added, noting the amount was just above Pareto’s target price of GBp160 per share.
The offer, recommended by Eland’s board and accepted by holders of 59.9% of the outstanding shares, represents a premium of 28% to yesterday’s closing price.
“With the high preacceptance, this will likely be the end of the Eland story as an independent company,” commented Kristiansen.
Disclosure: 1) Doresa Banning compiled this article for Streetwise Reports LLC and provides services to Streetwise Reports as an independent contractor. She or members of her household own securities of the following companies mentioned in the article: None. She or members of her household are paid by the following companies mentioned in this article: None. 2) The following companies mentioned in this article are billboard sponsors of Streetwise Reports: None. Click here for important disclosures about sponsor fees. 3) Comments and opinions expressed are those of the specific experts and not of Streetwise Reports or its officers. The information provided above is for informational purposes only and is not a recommendation to buy or sell any security. 4) The article does not constitute investment advice. Each reader is encouraged to consult with his or her individual financial professional and any action a reader takes as a result of information presented here is his or her own responsibility. By opening this page, each reader accepts and agrees to Streetwise Reports’ terms of use and full legal disclaimer. This article is not a solicitation for investment. Streetwise Reports does not render general or specific investment advice and the information on Streetwise Reports should not be considered a recommendation to buy or sell any security. Streetwise Reports does not endorse or recommend the business, products, services or securities of any company mentioned on Streetwise Reports. 5) From time to time, Streetwise Reports LLC and its directors, officers, employees or members of their families, as well as persons interviewed for articles and interviews on the site, may have a long or short position in securities mentioned. Directors, officers, employees or members of their immediate families are prohibited from making purchases and/or sales of those securities in the open market or otherwise from the time of the interview or the decision to write an article until three business days after the publication of the interview or article. The foregoing prohibition does not apply to articles that in substance only restate previously published company releases.
Disclosures from Pareto Securities AS, Eland Oil and Gas, October 15, 2019
This publication or report has been prepared solely by Pareto Securities Research.
Opinions or suggestions from Pareto Securities Research may deviate from recommendations or opinions presented by other departments or companies in the Pareto Securities Group. The reason may typically be the result of differing time horizons, methodologies, contexts or other factors.
Analysts Certification The research analyst(s) whose name(s) appear on research reports prepared by Pareto Securities Research certify that: (i) all of the views expressed in the research report accurately reflect their personal views about the subject security or issuer, and (ii) no part of the research analysts compensation was, is, or will be directly or indirectly related to the specific recommendations or views expressed by the research analysts in research reports that are prepared by Pareto Securities Research.
The research analysts whose names appears on research reports prepared by Pareto Securities Research received compensation that is based upon various factors including Pareto Securities total revenues, a portion of which are generated by Pareto Securities investment banking activities.
Conflicts of interest
Companies in the Pareto Securities Group, affiliates or staff of companies in the Pareto Securities Group, may perform services for, solicit business from, make a market in, hold long or short positions in, or otherwise be interested in the investments (including derivatives) of any company mentioned in the publication or report.
In addition Pareto Securities Group, or affiliates, may from time to time have a broking, advisory or other relationship with a company which is the subject of or referred to in the relevant Research, including acting as that companys official or sponsoring broker and providing corporate finance or other financial services. It is the policy of Pareto to seek to act as corporate adviser or broker to some of the companies which are covered by Pareto Securities Research. Accordingly companies covered in any Research may be the subject of marketing initiatives by the Corporate Finance Department.
To limit possible conflicts of interest and counter the abuse of inside knowledge, the analysts of Pareto Securities Research are subject to internal rules on sound ethical conduct, the management of inside information, handling of unpublished research material, contact with other units of the Group Companies and personal account dealing. The internal rules have been prepared in accordance with applicable legislation and relevant industry standards. The object of the internal rules is for example to ensure that no analyst will abuse or cause others to abuse confidential information. It is the policy of Pareto Securities Research that no link exists between revenues from capital markets activities and individual analyst remuneration. The Group Companies are members of national stockbrokers associations in each of the countries in which the Group Companies have their head offices. Internal rules have been developed in accordance with recommendations issued by the stockbrokers associations.
This material has been prepared following the Pareto Securities Conflict of Interest Policy. The guidelines in the policy include rules and measures aimed at achieving a sufficient degree of independence between various departments, business areas and sub-business areas within the Pareto Securities Group in order to, as far as possible, avoid conflicts of interest from arising between such departments, business areas and sub-business areas as well as their customers. One purpose of such measures is to restrict the flow of information between certain business areas and sub-business areas within the Pareto Securities Group, where conflicts of interest may arise and to safeguard the impartialness of the employees. For example, the Corporate Finance departments and certain other departments included in the Pareto Securities Group are surrounded by arrangements, so-called Chinese Walls, to restrict the flows of sensitive information from such departments. The internal guidelines also include, without limitation, rules aimed at securing the impartialness of, e.g., analysts working in the Pareto Securities Research departments, restrictions with regard to the remuneration paid to such analysts, requirements with respect to the independence of analysts from other departments within the Pareto Securities Group rules concerning contacts with covered companies and rules concerning personal account trading carried out by analysts.
Shares of Protalix Biotherapeutics skyrocketed today on much higher than average volume as the firm announced positive 12-month interim data from its BRIDGE Phase 3 open label switch-over study of pegunigalsidase alfa (PRX-102) for the treatment of Fabry disease.
Earlier today, Israel-based biopharmaceutical company Protalix Biotherapeutics Inc. (PLX:NYSE), which focuses on the development, production and commercialization of recombinant therapeutic proteins produced by its proprietary ProCellEx plant cell-based protein expression system, announced positive 12-month on-treatment data from the first 16 adult patients enrolled in its BRIDGE Phase 3 study.
The firm advised in the release “the BRIDGE study is an open label switch-over study evaluating the safety and efficacy of pegunigalsidase alfa (PRX-102), 1 mg/kg infused every two weeks, in up to 22 Fabry patients currently treated with agalsidase alfa (Replagal) for at least two years and on a stable dose for at least six months.” The firm noted that in both male and female patients, the 12-month interim data from the first 16 of 22 adult patients enrolled demonstrate a mean improvement in kidney function when switched from agalsidase alfa to pegunigalsidase alfa.
Raul Chertkoff, M.D., Protalix’s vice president of medical affairs, commented, “We previously announced positive preliminary results from 16 patients after six months in the BRIDGE study in September 2018, and these new results, after 12 months of treatment, further suggest the strong potential benefit of pegunigalsidase alfa on renal function for Fabry patients.”
According to the clinical trial results, 100% of the progressing patients achieved the proposed therapeutic goals after switching to pegunigalsidase alfa, with the majority of the patients who completed the study rolling over into a long-term extension study, continuing their treatment with pegunigalsidase alfa. The company added that “pegunigalsidase alfa was found to be well tolerated in the study, with all adverse events being transient in nature without sequelae, and that most of the patients who were eligible for home care therapy per country regulation were treated under a home care arrangement in which certain of the scheduled infusions were performed at the patients’ home.”
The firm explains that Fabry disease, which occurs in one of every 40,000 people, is an “X-linked inherited disease that results from deficient activity of the lysosomal enzyme alpha galactosidase A resulting in progressive accumulation of abnormal deposits of a fatty substance called globotriaosylceramide (Gb3) in blood vessel walls throughout a person’s body.”
Protalix Biotherapeutics focuses on the development and commercialization of recombinant therapeutic proteins expressed through its proprietary plant cell-based expression system, ProCellEx. Protalix notes that it was the first company to “gain FDA approval of a protein produced through plant cell-based in suspension expression system.” The company’s development pipeline includes the following product candidates: pegunigalsidase alfa, OPRX‑106, an orally delivered anti-inflammatory treatment, and alidornase alfa for the treatment of Cystic Fibrosis alfa.
Protalix Biotherapeutics started off today with a market capitalization of about $26.9 million with approximately 148.4 million shares outstanding. PLX shares opened more than 70% higher today on the news at $0.31 (+$0.129, +71.27%) compared to the prior day’s $0.181 closing price. The stock usually trades less than 300,000 shares per day, but today has already traded more than 26 million shares between $0.2863 and $0.47 per share and is presently trading at $0.3151 (+$0.1341, +74.09%).
Disclosure: 1) Stephen Hytha compiled this article for Streetwise Reports LLC and provides services to Streetwise Reports as an independent contractor. He or members of his household own securities of the following companies mentioned in the article: None. He or members of his household are paid by the following companies mentioned in this article: None. 2) The following companies mentioned in this article are billboard sponsors of Streetwise Reports: None. Click here for important disclosures about sponsor fees. 3) Comments and opinions expressed are those of the specific experts and not of Streetwise Reports or its officers. The information provided above is for informational purposes only and is not a recommendation to buy or sell any security. 4) The article does not constitute investment advice. Each reader is encouraged to consult with his or her individual financial professional and any action a reader takes as a result of information presented here is his or her own responsibility. By opening this page, each reader accepts and agrees to Streetwise Reports’ terms of use and full legal disclaimer. This article is not a solicitation for investment. Streetwise Reports does not render general or specific investment advice and the information on Streetwise Reports should not be considered a recommendation to buy or sell any security. Streetwise Reports does not endorse or recommend the business, products, services or securities of any company mentioned on Streetwise Reports. 5) From time to time, Streetwise Reports LLC and its directors, officers, employees or members of their families, as well as persons interviewed for articles and interviews on the site, may have a long or short position in securities mentioned. Directors, officers, employees or members of their immediate families are prohibited from making purchases and/or sales of those securities in the open market or otherwise from the time of the interview or the decision to write an article until three business days after the publication of the interview or article. The foregoing prohibition does not apply to articles that in substance only restate previously published company releases. 6) This article does not constitute medical advice. Officers, employees and contributors to Streetwise Reports are not licensed medical professionals. Readers should always contact their healthcare professionals for medical advice.
Good news is piling up for this healthcare stock engaged in the treatment of hepatitis B as it trades at 5X its average volume with a 30% stock price gain over previous close.
Assembly Biosciences Inc (ASMB:NASDAQ) announced in a press release on October 16, 2019, “Phase 2a studies of ABI-H0731 + nucleos(t)ide analogs (Nrtl) in HBeAg+ patients show faster and deeper declines in HBV DNA and RNA with combination than Nrtl alone, as well as subsequent declines in the surrogate markers of cccDNA with long-term treatment.”
It’s good news for the company, which seeks to improve cure rates for individuals with chronic hepatitis B (HBV).
The announcement also highlights that data from the company’s two lead core inhibitor programs will be featured at the AASLD (American Association for the Study of Liver Diseases) Annual Meeting, considered to be the premier conference in the U.S. for hepatitis B and other liver diseases.
Investors liked what they heard this morning, as they rewarded Assembly Biosciences with a 30% increase in its share price on trading volume reaching nearly 500% of average. Shares closed the previous day at $9.30 and have reached as high as $12.45 today.
How much room does this hot biotech stock have left to run? According to Mizuho Securities analyst Salim Syed, perhaps quite a bit more. The analyst initiated coverage today with a Buy rating and a price target of $20. The target may not be as aggressive as it appears at first glance, considering ASMB is still far from its all-time high of $100.80 in 2011, as well as its more recent high of $58.43 in 2018.
Disclosure: 1) Kevin Jaillet compiled this article for Streetwise Reports LLC and is an employee of Streetwise Reports. He or members of his household own securities of the following companies mentioned in the article: None. He or members of his household are paid by the following companies mentioned in this article: None. 2) The following companies mentioned in this article are billboard sponsors of Streetwise Reports: None. Click here for important disclosures about sponsor fees. The information provided above is for informational purposes only and is not a recommendation to buy or sell any security. 3) Comments and opinions expressed are those of the specific experts and not of Streetwise Reports or its officers. 4) The article does not constitute investment advice. Each reader is encouraged to consult with his or her individual financial professional and any action a reader takes as a result of information presented here is his or her own responsibility. By opening this page, each reader accepts and agrees to Streetwise Reports’ terms of use and full legal disclaimer. This article is not a solicitation for investment. Streetwise Reports does not render general or specific investment advice and the information on Streetwise Reports should not be considered a recommendation to buy or sell any security. Streetwise Reports does not endorse or recommend the business, products, services or securities of any company mentioned on Streetwise Reports. 5) From time to time, Streetwise Reports LLC and its directors, officers, employees or members of their families, as well as persons interviewed for articles and interviews on the site, may have a long or short position in securities mentioned. Directors, officers, employees or members of their immediate families are prohibited from making purchases and/or sales of those securities in the open market or otherwise from the time of the interview or the decision to write an article until three business days after the publication of the interview or article. The foregoing prohibition does not apply to articles that in substance only restate previously published company releases. 6) This article does not constitute medical advice. Officers, employees and contributors to Streetwise Reports are not licensed medical professionals. Readers should always contact their healthcare professional for medical advice.
The transaction details are relayed in a CIBC report.
In an Oct. 10 research note, CIBC analyst Dave Popowich reported that Tourmaline Oil Corp. (TOU:TSX) intends to spin out, into a new private royalty and infrastructure company called Topaz Energy, a gross over-riding royalty interest across its properties plus a nonoperated 45% working interest in two of its gas plants.
In exchange, Tourmaline will receive CA$135185 million in cash and retain a 7581% equity share of Topaz. Existing Tourmaline staff members will manage the new entity under a contract. “Topaz expects to seek a public liquidity event in H1/20,” Popowich indicated. “The company will initially pay out about 75% of its expected $90 million of annual revenue.”
Popowich commented that the “transaction allows Tourmaline to monetize a fairly low-risk portion of its cash flow base while retaining some upside in an investment vehicle that should value it at a higher multiple in the public market.” Previously, management indicated several times that its infrastructure has consistently been undervalued in the past.
The expected changes to CIBC’s estimates on Tourmaline as a result of the transaction are minimal, Popowich noted, and no major impacts to the investment thesis are predicted in the short term. However, that could change, he added, were Tourmaline “able to use Topaz as a platform to roll up additional royalty and/or facility interests in a basin that is clearly ripe for consolidation.”
Looking to this winter, AECO and/or NYMEX prices should improve, thus benefitting this Canadian gas-weighted energy firm, the analyst wrote.
CIBC has an Outperformer rating and a CA$25 per share target price on Tourmaline, whose stock is currently trading at around CA$12.06 per share.
Disclosure: 1) Doresa Banning compiled this article for Streetwise Reports LLC and provides services to Streetwise Reports as an independent contractor. She or members of her household own securities of the following companies mentioned in the article: None. She or members of her household are paid by the following companies mentioned in this article: None. 2) The following companies mentioned in this article are billboard sponsors of Streetwise Reports: None. Click here for important disclosures about sponsor fees. 3) Comments and opinions expressed are those of the specific experts and not of Streetwise Reports or its officers. The information provided above is for informational purposes only and is not a recommendation to buy or sell any security. 4) The article does not constitute investment advice. Each reader is encouraged to consult with his or her individual financial professional and any action a reader takes as a result of information presented here is his or her own responsibility. By opening this page, each reader accepts and agrees to Streetwise Reports’ terms of use and full legal disclaimer. This article is not a solicitation for investment. Streetwise Reports does not render general or specific investment advice and the information on Streetwise Reports should not be considered a recommendation to buy or sell any security. Streetwise Reports does not endorse or recommend the business, products, services or securities of any company mentioned on Streetwise Reports. 5) From time to time, Streetwise Reports LLC and its directors, officers, employees or members of their families, as well as persons interviewed for articles and interviews on the site, may have a long or short position in securities mentioned. Directors, officers, employees or members of their immediate families are prohibited from making purchases and/or sales of those securities in the open market or otherwise from the time of the interview or the decision to write an article until three business days after the publication of the interview or article. The foregoing prohibition does not apply to articles that in substance only restate previously published company releases.
Disclosures from CIBC, Tourmaline Oil Corp., October 10, 2019
Analyst Certification: Each CIBC World Markets Corp./Inc. research analyst named on the front page of this research report, or at the beginning of any subsection hereof, hereby certifies that (i) the recommendations and opinions expressed herein accurately reflect such research analyst’s personal views about the company and securities that are the subject of this report and all other companies and securities mentioned in this report that are covered by such research analyst and (ii) no part of the research analyst’s compensation was, is, or will be, directly or indirectly, related to the specific recommendations or views expressed by such research analyst in this report.
Analysts employed outside the U.S. are not registered as research analysts with FINRA. These analysts may not be associated persons of CIBC World Markets Corp. and therefore may not be subject to FINRA Rule 2241 restrictions on communications with a subject company, public appearances and trading securities held by a research analyst account.
Potential Conflicts of Interest: Equity research analysts employed by CIBC World Markets Corp./Inc. are compensated from revenues generated by various CIBC World Markets Corp./Inc. businesses, including the CIBC World Markets Investment Banking Department. Research analysts do not receive compensation based upon revenues from specific investment banking transactions. CIBC World Markets Corp./Inc. generally prohibits any research analyst and any member of his or her household from executing trades in the securities of a company that such research analyst covers. Additionally, CIBC World Markets Corp./Inc. generally prohibits any research analyst from serving as an officer, director or advisory board member of a company that such analyst covers.
In addition to 1% ownership positions in covered companies that are required to be specifically disclosed in this report, CIBC World Markets Corp./Inc. may have a long position of less than 1% or a short position or deal as principal in the securities discussed herein, related securities or in options, futures or other derivative instruments based thereon.
Recipients of this report are advised that any or all of the foregoing arrangements, as well as more specific disclosures set forth below, may at times give rise to potential conflicts of interest.
Important Disclosure Footnotes for Tourmaline Oil Corp. (TOU)
· CIBC World Markets Inc. expects to receive or intends to seek compensation for investment banking services from Tourmaline Oil Corp. in the next 3 months.