China’s central bank left its new benchmark interest rate, the Loan Prime Rate (LPR), steady at 4.20 percent from September and the 5-year rate unchanged at 4.85 percent.
In August the People’s Bank of China (PBOC) reformed its method for setting LPR to improve the transmission of its monetary policy and lower the cost of financing, making LPR the pricing benchmark for all types of loans by commercial lenders instead of its lending rate.
LPR, which is linked to PBOC’s medium-term lending facility (MLF), is the average of prices submitted by 18 banks, and currently comprises two varieties, a 1 year and a 5 year.
LPR is published on the 20th of each month, and if this falls on a weekend or holiday, LPR is published the following day.
On Aug. 20 LPR was published for the first time since the reform and set at 4.25 percent, 6 basis points below the 4.31 percent it had been since it was first introduced in October 2013, and 10 points below the lending rate of 4.35 percent. The 5-year LPR was set at 4.85 percent.
On Sept. 19 LPR was published for the second time at 4.20 percent for a decline of 5 basis points.
Earlier today Yi Gang, PBOC governor, said in Washington DC that China would continue to pursue a prudent monetary policy and recent policy measures, such as three cuts to the reserve requirements for banks and the market-based reform on interest rates, had achieved desired results.
This includes stable growth of money supply and credit and low market interest rates, and the transmission mechanism for monetary policy will be improved further to reduce firms’ funding cost and promote high-quality economic growth.
US stocks upward momentum faltered on Friday despite positive earnings. The S&P 500 slid 0.4% to 2986.20, extending gains 0.6% for the week. Dow Jones industrial fell 1% to 26770.20 dragged by 6.8% drop in Boeing. The Nasdaq lost 0.8% to 8089.54. The dollar weakening continued at slower pace as Federal Reserve Vice Chairman Richard Clarida said the economy faced “evident” risks, while inflation remained muted: the live dollar index data show the ICE US Dollar index, a measure of the dollar’s strength against a basket of six rival currencies, fell 0.3% to 97.26 and is lower currently. Stock index futures point to mixed openings today.
CAC 40 led European indexes retreat
European stocks reversed courses on Friday on disappointing Chinese GDP report and warning by Ferench auto major Renault. Both the EUR/USD and GBP/USD continued their climb Friday with both pairs higher currently. The Stoxx Europe 600 Index lost 1.2% led by auto shares. The DAX 30 slipped 0.2% Friday to 12633.60. France’s CAC 40 fell 0.7% and UK’s FTSE 100 lost 0.4% to 7150.57 ahead of UK Parliament vote on Saturday on a new Brexit deal which was unanimously backed by European Union leaders on Thursday.
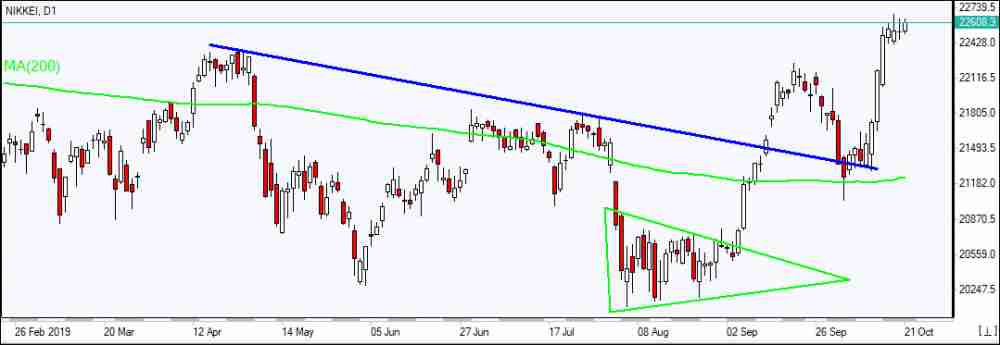
Nikkei leads Asian Indexes gains
Asian stock indices are mostly higher today. Nikkei ended 0.3% higher at 22548.90 as yen resumed its slide against the dollar following a report Japan’s exports fell 5.2% from a year earlier in September. China’s markets are rising: the Shanghai Composite Index is up 0.05% and Hong Kong’s Hang Seng Index is 0.1% higher. Australia’s All Ordinaries Index added 0.04% as the Australian dollar extended gains against the greenback.
Brent futures prices are edging higher today. Prices retreated on Friday: Brent for December settlement ended 0.8% lower at $59.42 a barrel Friday, posting 1.8% loss for the week.
Note: This overview has an informative and tutorial character and is published for free. All the data, included in the overview, are received from public sources, recognized as more or less reliable. Moreover, there is no guarantee that the indicated information is full and precise. Overviews are not updated. The whole information in each overview, including opinion, indicators, charts and anything else, is provided only for familiarization purposes and is not financial advice or а recommendation. The whole text and its any part, as well as the charts cannot be considered as an offer to make a deal with any asset. IFC Markets and its employees under any circumstances are not liable for any action taken by someone else during or after reading the overview.
Dermira shares traded higher today after the firm released positive data from its phase 2b study of lebrikizumab in patients with atopic dermatitis at the Las Vegas Fall Clinical Dermatology Conference.
Yesterday afternoon, Dermira Inc. (DERM:NASDAQ), a biopharmaceutical company that states it is “dedicated to bringing biotech ingenuity to medical dermatology by delivering differentiated, new therapies to the millions of patients living with chronic skin conditions,” announced that detailed primary results from its Phase 2b dose-ranging study of lebrikizumab are being presented during the 39th Annual Fall Clinical Dermatology Conference in Las Vegas. The company previously advised that lebrikizumab is now also being evaluated in a Phase 3 program in adult and adolescent patients with moderate-to-severe atopic dermatitis.
The company notes that the lebrikizumab Phase 2b study was “designed to evaluate the safety and efficacy of lebrikizumab as monotherapy compared with placebo and establish a dosing regimen for the Phase 3 program in patients with moderate-to-severe atopic dermatitis.” The study enrolled 280 patients ages 18 years and older in the U.S with moderate-to-severe atopic dermatitis. Three different lebrikizumab treatment dosing arms were evaluated, compared to a placebo arm. Initial topline findings from the Phase 2b study were previously reported, showing across “all doses evaluated, lebrikizumab demonstrated dose-dependent and statistically significant improvements in the primary endpoint.”
April W. Armstrong, M.D., MPH, professor of dermatology and associate dean of clinical research at the University of Southern California Keck School of Medicine and an investigator in the lebrikizumab study, commented, “These results are encouraging and suggest that lebrikizumab has the potential to advance the standard of care for patients with moderate-to-severe atopic dermatitis by delivering improvements in efficacy, tolerability and convenience relative to available therapies…In this study, lebrikizumab administered once every two or four weeks demonstrated robust, broad efficacy with a safety profile consistent with the substantial prior experience with this and other biologics targeting the IL-4/-13 pathway. Among these encouraging results, I am particularly excited about the impact of lebrikizumab on itch, which is one of the most burdensome symptoms for many atopic dermatitis patients.”
Dermira’s chief medical officer, dermatologist Eugene A. Bauer, M.D., added, “Our goal with lebrikizumab is to develop a best-in-disease therapy for patients with moderate-to-severe atopic dermatitis that not only improves the severity of disease, but that is also safe and convenient…These results support our belief that specifically targeting IL-13 with lebrikizumab has the potential to deliver on all of these objectives and thus help address the substantial unmet medical need in this prevalent, debilitating condition.”
Dermira is a biopharmaceutical company headquartered in Menlo Park, Calif., that focuses on delivering new therapies to millions of patients living with chronic skin conditions. The company’s approved treatment, QBREXZA (glycopyrronium) cloth, is indicated for pediatric and adult patients with primary axillary hyperhidrosis (excessive underarm sweating). The firm is currently evaluating lebrikizumab in a phase 3 clinical development program for the treatment of moderate-to-severe atopic dermatitis, which is the most common and severe form of eczema, a chronic inflammatory condition that can present as early as childhood and continue into adulthood.
Dermira has a market capitalization of about $309.5 million with 54.4 million shares outstanding, and as of yesterday, the company had a short interest of around 10%. The stock has a 52-week price range of $5.2515.48. This morning, DERM shares opened at $5.80 (+$0.11, +1.93%) over yesterday’s $5.69 closing price. The stock has traded today between $5.80 and $8.52/share and is currently trading at $7.22 (+$1.51, +26.71%).
Disclosure: 1) Stephen Hytha compiled this article for Streetwise Reports LLC and provides services to Streetwise Reports as an independent contractor. He or members of his household own securities of the following companies mentioned in the article: None. He or members of his household are paid by the following companies mentioned in this article: None. 2) The following companies mentioned in this article are billboard sponsors of Streetwise Reports: None. Click here for important disclosures about sponsor fees. 3) Comments and opinions expressed are those of the specific experts and not of Streetwise Reports or its officers. The information provided above is for informational purposes only and is not a recommendation to buy or sell any security. 4) The article does not constitute investment advice. Each reader is encouraged to consult with his or her individual financial professional and any action a reader takes as a result of information presented here is his or her own responsibility. By opening this page, each reader accepts and agrees to Streetwise Reports’ terms of use and full legal disclaimer. This article is not a solicitation for investment. Streetwise Reports does not render general or specific investment advice and the information on Streetwise Reports should not be considered a recommendation to buy or sell any security. Streetwise Reports does not endorse or recommend the business, products, services or securities of any company mentioned on Streetwise Reports. 5) From time to time, Streetwise Reports LLC and its directors, officers, employees or members of their families, as well as persons interviewed for articles and interviews on the site, may have a long or short position in securities mentioned. Directors, officers, employees or members of their immediate families are prohibited from making purchases and/or sales of those securities in the open market or otherwise from the time of the interview or the decision to write an article until three business days after the publication of the interview or article. The foregoing prohibition does not apply to articles that in substance only restate previously published company releases. 6) This article does not constitute medical advice. Officers, employees and contributors to Streetwise Reports are not licensed medical professionals. Readers should always contact their healthcare professionals for medical advice.
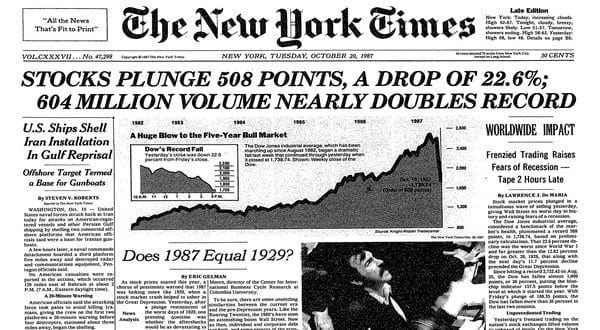
Back in the day, for those of you that are old enough to remember and have experienced one of the most incredible trader psychology driven stock market decline in recent history.
The difference between “Black Monday” and most of the other recent stock market declines is that October 19, 1987, was driven by a true psychological panic, what we consider true price exploration, after an incredible price rally.
It is different than the DOT COM (2001) decline and vastly different than the Credit Market Crisis (2008-09) because both of those events were related to true fundamental and technical evaluations. In both of those instances, prices have been rising for quite some time, but the underlying fundamentals of the economics of the markets collapsed and the markets collapsed with future expectations. Before we get too deep, be sure to opt-in to our free market trend signals newsletter.
Our researchers believe the setup prior to the Black Monday collapse is strangely similar to the current setup across the global markets. In 1982, Ronald Reagan was elected into his second term as the US President. Since his election in 1980, the US stock market has risen over 300% by August 1987.
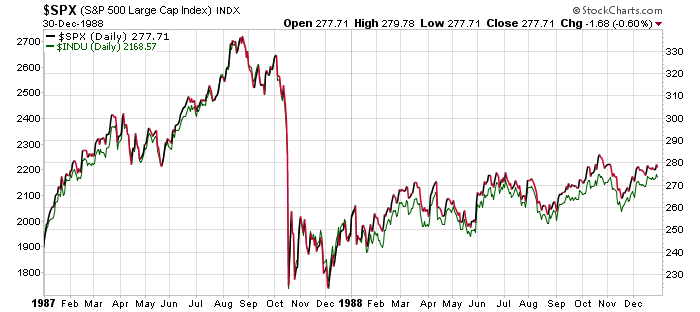
Reagan, much like President Trump, was elected after a long period of US economic malaise and ushered in an economic boom-cycle that really began to accelerate near August 1983 – near the end of his first term. The expansion from the lows of 1982, near 102.20, to the highs of 1987, near 337.90, in the S&P 500 prompted an incredible rally in the US markets for all global investors.
This is very similar to what has happened since 2015/16 in the markets and particularly after the November 2016 elections when the S&P500 bottomed near 1807.5 and has recently set hew highs near 3026.20 – a 67.4% price rally in just over 3 years.
One can simply make the assumption that global investors poured capital in the US markets in 1983 to 1986 as the US markets entered a rally mode just like we suspect global investors have poured capital into the US markets after the 2016 US elections and have continued to seek value, safety, and returns in the US markets since. These incredible price rallies setup a very real potential for “true price exploration” when investors suddenly realize valuations may be out of control.
So, what actually happened on October 19th, 1987 that was different than the last few market collapse events and why is it so similar to what is happening today?
On October 19, 1987, a different set of circumstances took place. This was almost a perfect storm of sorts for the markets. The US markets had risen nearly 44% by August 1987 from the previous yearly close – a huge rally had taken place. Computer trading, which some people suspected may have been a reason for the price decline on October 19, was largely in its infancy.
Floor traders were running the show in New York and Chicago. The London markets closed early the Friday, October 16, because of a weather event that was taking place. The “setup” of these events may have played a roll in the liquidity issues that became evident on Black Monday and pushed the US markets down 22.61% by the end of trading.
The US markets had set up a top near 2,722 in early August 1987 after rising nearly 44% from the 1986 end of year closing price level of 1,895. The SPX rotated lower from this peak to set up a sideways price channel near 315 throughout the end of August and through most of September. On October 5, 1987, the SPX started a downward price move that attempted to test the lower support channel near 312. On October 12, one week later, the SPX broke below this support channel and closed at 298.10 (below the psychological 300 level). The very next weekend was October 17 & 18 – the weekend before Black Monday.
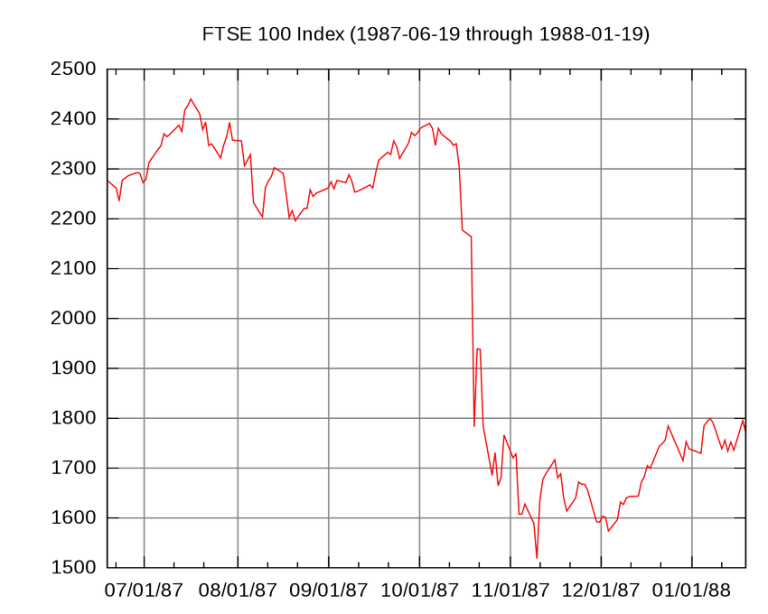
Sunday night, October 18, in the US, the Asian markets opened for trading and a price sell-off began taking place in Hong Kong. Because the London markets has closed early on the 16th due to the storm, by the time they opened the UK markets began tanking almost immediately. Early in the day on Monday, October 19, the FTSE100 had collapsed over 136 points.
Our researchers believe the declines in the US markets in early October 1987 set up a breakdown event that, once support was broken, prompted a collapse event where liquidity issues accelerated the price decline volatility – much like the “flash crash”. Global investors were unprepared for the scale and scope of the price decline event and panicked at the speed of the price collapse.
In fact, at the height of the 1987 crash, systemic problems (mostly solvency and brokerage house operations) continued to threaten a much larger financial market collapse. Within days of Black Monday, it became evident that margin accounts and solvency issues related to operating capital, large scale risks and continued fear that the markets may continue to collapse presented a very real problem for the US and for the world. Have we reentered another Black Monday type of setup across the global markets?
As new economic data continues to suggest the global markets are economically contracting and stagnating, the US Federal Reserve has started buying assets again while the foreign central banks continue to push negative interest rates while attempting to spark any signs of real economic growth. The US stock market has continued to push higher – almost attempting new all-time highs again just recently. The US stock market is up nearly 68% over the past 3.5 years since Trump was elected and as of Friday, October 18, 2019, the US stock markets fell nearly 0.75% on economic fears.
In Part II of this article, we’ll explore the potential of another Black Monday type of setup that may be playing out before our very eyes right now in the US stock market.
As a technical analysis and trader since 1997, I have been through a few bull/bear market cycles. I believe I have a good pulse on the market and timing key turning points for both short-term swing trading and long-term investment capital. The opportunities are massive/life-changing if handled properly.
I urge you visit my ETF Wealth Building Newsletter and if you like what I offer, join me with the 1-year subscription to lock in the lowest rate possible and ride my coattails as I navigate these financial market and build wealth while others lose nearly everything they own during the next financial crisis. Join Today to Get a Free 1oz Silver Bar with a subscription – Offer Ends This Week!
John Newell of Fieldhouse Capital Management explores the investment opportunities presented by this project generator in a district rich with historic mine strikes.
If the adage in the mining business is “that the best place to find a mine is next to an old mine,” then by extension, the best place to explore for gold is next to a successful exploration play, and GoldON Resources Ltd. (GLD:TSX.V) is a company that we believe deserves a closer look.
Background In our first Great Bear Resources Ltd. (GBR:TSX.V; GTBDF:OTCQX) article, linked here, we saw a company that checked a lot of the boxes when looking at potentially investing in a gold exploration company. Great historical gold-producing district, where discoveries have been turned into mines for the past century. Great management and geologists. It is also helpful to have tight share structure, with management owning shares so that their goals were aligned with the other shareholders.
When we first started following Great Bear Resources, like most juniors it was hard to raise money. The shares bounced around with the volatility that comes with sector, the company did not have any big investors championing the story, and while we researched the story, we had no idea that everything was about to change.
The now-famous drill results came out, and the famed Red Lake investor and former Goldcorp chairman and founder stepped in and bought ~10%, coupled and with continuous better results, and the rest as they say is history. Great Bears share price went from $0.50 to over $9/per share in less than 18 months.
So, we are motivated to look for other companies that could also mirror that kind of success, while recognizing that mineral exploration is a high-risk business, and replicating Great Bears success is a mighty tall order. However, it is also true that it has been success in the discovery phase of a mining projects lifespan that has created the greatest shareholder wealth in the resource sector. We look for those companies for a part of our portfolio on mining companies, knowing the odds are 1 in 1,000. Our research led us to GoldON Resources Ltd., and we decided to have a closer look.
Who is GoldON? GoldON Resources Ltd. is a mineral exploration company with a project generator business model. GoldON, as the name reflects, is a company focused on exploration in Ontario, Canada. It is focused on discovery-stage properties with a goal of adding value by defining, or redefining, using new exploration methods and exploration opportunities, and then sourcing a well-financed partner to advance the project by way of option or joint venture participation.
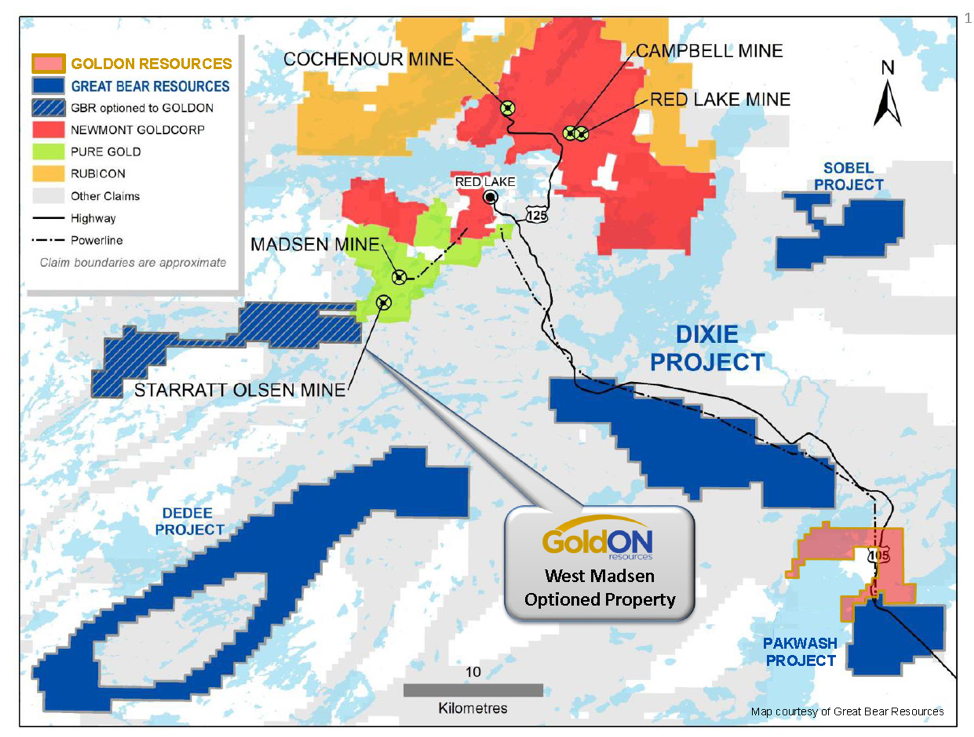
The company has, and continues to, seek and acquire properties by staking or [acquiring an] option in mining-friendly jurisdictions, and is geographically focused on some of the prolific gold mining districts of Ontario, Canada, notably the famous and prolific Red Lake camp.
The Red Lake Camp
Excerpt from the Red Lake Regional Heritage Foundation Web page: The Legend of Red Lake According to Ojibway legend, thousands of years ago two warriors of the Chippeway nation came upon a very large moose beside a lake. They believed the beast was Matchee Manitou (evil spirit) and tried to kill it. Wounded, the animal escaped by diving deep into the lake. A large pool of blood colored the water red, and the hunters named the body of water Misque Sakigon, or Color of Blood Lake. Over the years it became known as Red Lake.
While Canada has had many prolific gold- and silver-producing areas discovered over the past 100 years, and many famous gold rushes, few rival the prolific Red Lake District, where some of the richest grades of gold have been found. Gold was first discovered in 1925, and as the word got out it quickly grew. Since 1925 there have been 28 operating mines producing in excess of 25 million ounces with an average grade of 0.5 ounce of gold per ton. Much of the gold deposits are discovered in a greenstone formation that has come from structurally controlled vein-type gold deposits near regional mafic volcanic sediment contacts. Gold will generally occur where the greenstone rocks come together with the sedimentary rocks. At that point, the rocks have been stretched and folded, creating the cracks and openings that can fill with gold.
The Company GoldON is led by Michael Romanik, who is CEO, president and a director, and has assembled a great management team, geological team, drilling/exploration crew and advisory board. Mr. Romanik has demonstrated the ability to raise capital with strategic investors and leading industry executives, while using the funds on careful, well-researched drill targets, on ground that offers great discovery potential.
GoldON has three main properties we will cover in this market awareness report, Slate Falls, West Madsen and Bruce Lake. The other properties are likely going to wait until next year to see any meaningful work done.
Share Structure The company has a good share structure, with a focus on discovery-stage projects, with over $1 million in the treasury to complete the upcoming drilling at Slate Falls and the next phase of exploration at West Madsen.
Issued and outstanding: 15,152,282
Warrants: 3,625,350
Stock options: 1,561,150
Fully diluted: 20,338,782
Insider holdings: ~24%
Insiders & close associates: ~50%
Goldcorp. founder and head of McEwen Mining (MUX) (Rob McEwen): ~5%
Slate Falls GoldON is currently preparing to drill its flagship, 100%-owned Slate Falls property. The 5,687-hectare Slate Falls property is in the Meen-Dempster Greenstone Belt between the Red Lake and Pickle Lake Gold Camps (see location map below).
The Fry Lake-Bamaji Lake Deformation Zone passes through the property, representing first- and second-order crustal-scale structures that cut stratigraphy that is similar to and contemporaneous with the stratigraphy that hosts the past-producing Golden Patricia gold mine, which produced 620,000 ounces of gold at 15 g/t Au between 19881997 and lies 30 kilometers to the northeast. Also, the almost 5 million-ounce Springpole project being run by First Mining Gold Corp. (FF:TSX) (news release on Springpole) is ~30 kilometers to the northwest, so we know we are in gold country.
This news release, dated June 25, 2019, strengthens our belief that GoldON is in the right rock type. News release: Selected Rock Grab Samples Assay up to 331.76 g/t Au and 3,025 g/t Ag at GoldON’s Slate Falls Project.
Just as being in the right neighborhood for finding gold gives confidence. So too does good prospecting and fieldwork, sampling, reconnaissance mappingall are vital to identify quality drill targets while saving time and money, before the drills start turning. Fieldwork in 2019 returned the highest-grade surface sample results to date and turned up priority targets, which include the Trail Zone, where high-grade values up to 861 g/t Au in drill core and 3,025 g/t Ag in surface samples will be included in the current drill program getting underway.
It is also worth mentioning that Mr. Bob Singh did the detailed review and compilation of all historical exploration data on the Slate Falls property, and was the Qualified Person (QP) on the project in 2017. Then his lead role on Great Bear’s Dixie Lake Project required his full attention, and the Slate Falls QP role was handed over to Mr. Mike Kilbourne, P.Geo.
Michael Romanik, president of GoldON states it best:
“We are early in the project life cycle at Slate Falls and the results from our 2019 prospecting and sampling program will be instrumental in guiding our drill plan. We have clearly defined our initial high-grade targets and look forward to commencing our maiden drill program on the Property.”
West Madsen
Sometimes you’re smart or lucky in mining, and whichever it is in GoldON’s case, we’ll take it. With Great Bear Resources very busy with their new, ever-expanding discovery at their 100%-owned Dixie Lake Project, only 20 kilometers away, Great Bear optioned off its other 100%-owned, royalty-free West Madsen properties to GoldON, whereby GoldON has the option to earn a 100% interest in Great Bear’s West Madsen gold property (see GoldON’s news release from May 28.)
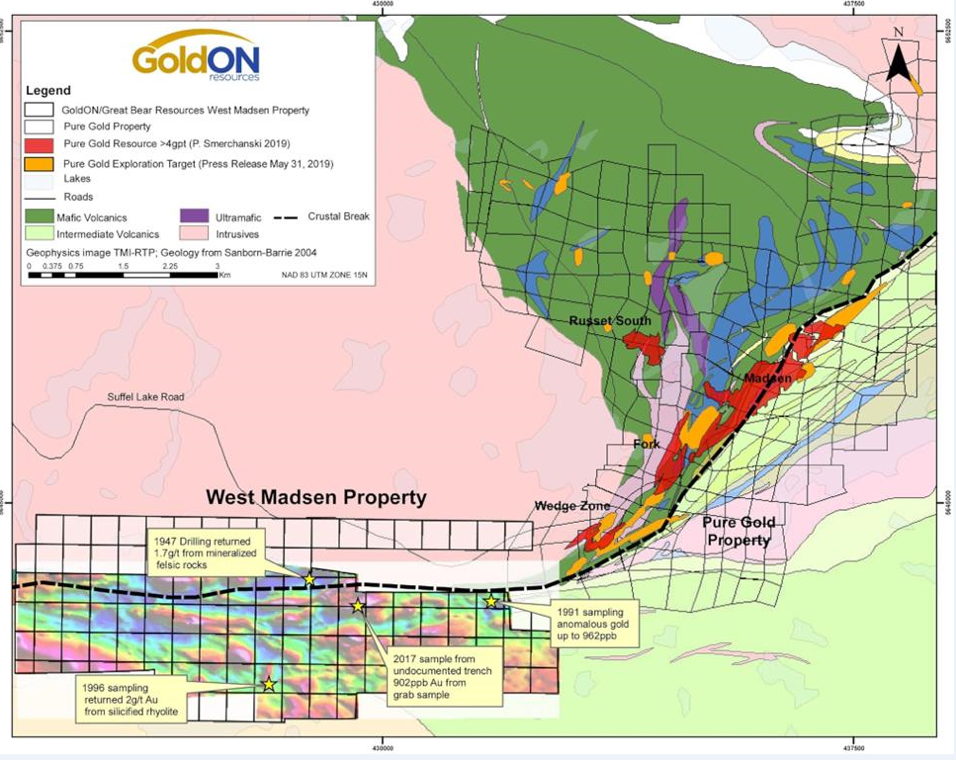
The West Madsen property is on strike to the historical, past-producing Madsen and Starratt Olsen mine, which is directly contiguous to Pure Gold Mining Inc.’s (PGM:TSX.V; PUR:LSE)‘s Madsen property, which is Canada’s highest-grade development gold project, currently being developed. Pure Gold is fully funded, with planned production for late 2020.
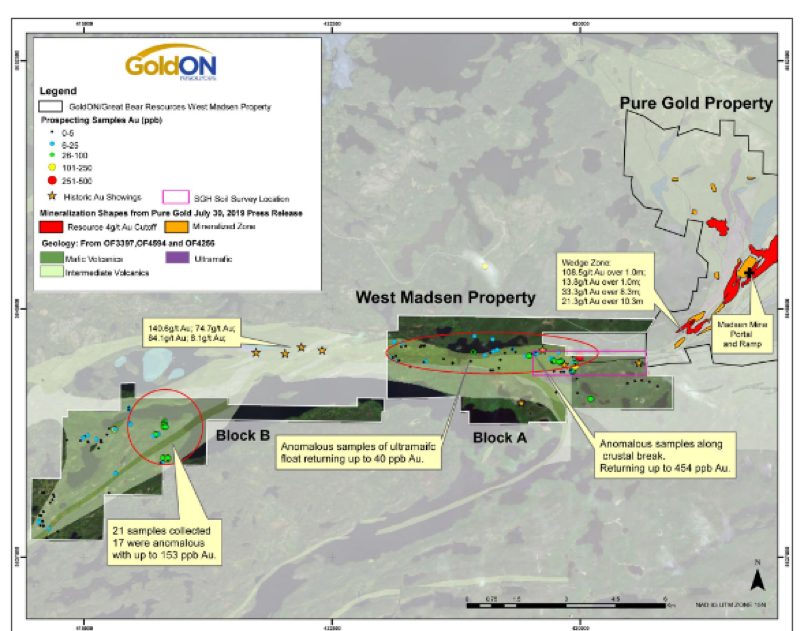
West Madsen is composed of two contiguous claim blocks (Blocks A and B; see slide below), each roughly 6 kilometers (6 km) by 3 km in size, for a total area of 3,860 hectares. GoldON has hired the Red Lake specialists Rimini Exploration as project manager for West Madison. Their work is so respected at the now-famous Dixie Lake Project of Great Bear that the company had the Bear-Rimini zone named after them.
Also, the multitalented VP Exploration, Mr. Bob Singh, from Great Bear Resources, will act as a technical advisor, along with Mr. Perry English, often referred to as a one-man prospect generator in the Red Lake District, who will join as a strategic advisor.
Pure Gold’s Madsen Project includes the Madsen deposit and the Fork, Russett South, and Wedge deposits. Pure Gold announced bonanza-grade gold results from the Wedge deposit on July 30, 2019, and the expansion of their 2019 exploration drilling program (from 12,000 to 20,000 meters) on October 9, with the aim of making new discoveries and continuing to grow the resource base.
This high-grade discovery is less than two kilometers away from GoldON’s Madsen’s Block A, with the best grades at the southwest end of the strike. Pure Gold’s exciting discovery and continued drilling success appears to be getting closer to GoldON’s property boundary.
More evidence that a major crustal break between Balmer Assemblage rocks and Confederation Assemblage rocks is interpreted to trend from the Pure Gold land package onto the West Madsen property.
Within the Red Lake Greenstone Belt, these major crustal breaks are associated with extensive gold mineralization, hosted both in the Balmer Assemblage and within the felsic to intermediate volcanic rocks adjacent to the interpreted fault zones, as recently identified by GoldON’s option partner, Great Bear Resources at their Dixie Project (see Great Bear’s press release from May 28, 2019).
GoldON’s phase I fieldwork on the West Madsen property in summer 2019 included a property-scale, grassroots prospecting and a 3D spatiotemporal gas hydrocarbon (SGH) soil survey. SGH is an extractive procedure that releases organic compounds absorbed on B-horizon soil samples. The SGH procedure provides a highly focused and sensitive method that measures compounds in the C5C17 range down to the low parts-per-trillion (ppt), which has been effectively used at Great Bear’s Dixie Lake discovery. A drilling program to follow up on the gold zones identified from the SGH surveys is planned after further prospecting and mapping work.
As Pure Gold’s new discovery, and continued and expanded drilling success, continue to find more high-grade gold, it seems likely that the rich gold-bearing zone could continue across the property line to include both the historic and current work that has returned gold at West Madsen. GoldON appears to be in the right rocks and getting the right evidence, which could lead to a significant discovery at West Madsen.
Bruce Lake GoldON recently signed an option agreement to acquire a 100% interest in the Bruce Lake property (news release of March 28, 2019). This road-accessible property with hydro lines running through it sits in between Great Bear’s major Dixie Lake discovery and Great Bear’s 3,100-hectare Pakwash property.
GoldON’s Bruce Lake property consists of seven claims covering 2,490 hectares in a structurally active area spatially associated with east-west trending deformation zones and northeast-trending faults. These faults have been central for gold mineralization to occur. This ground is unexplored, with gold anomalies yet to be explored; however, lake sediment results along with MMI (mobile metal ions) is especially well suited for deeply buried mineral deposits. MMI measures metal ions that travel upward from mineralization to unconsolidated surface materials such soil, till, sand and so on. Using careful soil sampling strategies, sophisticated chemical ligands and ultra-sensitive instrumentation, work suggests the property could be a source of gold.
The Technicals After a sharp run up in the price in early to mid-2019, Goldon has pulled back ~60% from the initial move off the 2018 lows. This could represent a good entry point in the company as it ramps up exploration on at least two significant exploration properties this year and next.
The chart of Great Bear, below, is a reminder that the path to higher is sometimes volatile and ~60% corrections are not uncommon before a move higher.
In Summary While the company’s exploration efforts are still early days, GoldON has assembled at least three high-priority properties that after preliminary and advanced geological work, are drill ready. GoldON has assembled a technical team with deep experience in the Red Lake area, a tight share structure with much of the shares owned by management, friends and family who believe in these projects. The company can run cost-effective exploration on all their road-accessible projects with a ready, experienced workforce and infrastructure including power and roads nearby.
GoldON has positioned itself in a mining region that has been turning discoveries into mines for a century. Given the recent drop in the share price, this area could be a good time for patient investors, with some risk tolerance, to look at GoldON Resources Ltd.
John Newell is a portfolio manager at Fieldhouse Capital Management. He has 38 years of experience in the investment industry acting as an officer, director, portfolio manager and investment advisor with some of the largest investment firms in Canada. Newell is a specialist in precious metal equities and related commodities and is a registered portfolio manager in Canada (advising representative).
Disclosures: 1) John Newell: I, or members of my immediate household or family, own shares of the following companies mentioned in this article: GoldON. I personally am, or members of my immediate household or family are, paid by the following companies mentioned in this article: None. My company currently has a financial relationship with the following companies mentioned in this article: None. I determined which companies would be included in this article based on my research and understanding of the sector. Additional disclosures/disclaimer below. 2) The following companies mentioned in this article are sponsors of Streetwise Reports: Great Bear Resources. Click here for important disclosures about sponsor fees. 3) Comments and opinions expressed are those of the specific experts and not of Streetwise Reports or its officers. The author is wholly responsible for the validity of the statements. The author was not paid by Streetwise Reports for this article. Streetwise Reports was not paid by the author to publish or syndicate this article. The information provided above is for informational purposes only and is not a recommendation to buy or sell any security. Streetwise Reports requires contributing authors to disclose any shareholdings in, or economic relationships with, companies that they write about. Streetwise Reports relies upon the authors to accurately provide this information and Streetwise Reports has no means of verifying its accuracy. 4) The article does not constitute investment advice. Each reader is encouraged to consult with his or her individual financial professional and any action a reader takes as a result of information presented here is his or her own responsibility. By opening this page, each reader accepts and agrees to Streetwise Reports’ terms of use and full legal disclaimer. This article is not a solicitation for investment. Streetwise Reports does not render general or specific investment advice and the information on Streetwise Reports should not be considered a recommendation to buy or sell any security. Streetwise Reports does not endorse or recommend the business, products, services or securities of any company mentioned on Streetwise Reports. 5) From time to time, Streetwise Reports LLC and its directors, officers, employees or members of their families, as well as persons interviewed for articles and interviews on the site, may have a long or short position in securities mentioned. Directors, officers, employees or members of their immediate families are prohibited from making purchases and/or sales of those securities in the open market or otherwise from the time of the interview or the decision to write an article until three business days after the publication of the interview or article. The foregoing prohibition does not apply to articles that in substance only restate previously published company releases. As of the date of this article, officers and/or employees of Streetwise Reports (including members of their household) own securities of GoldON, a company mentioned in this article.
Additional Disclosures and Disclaimer from John Newell, Fieldhouse Capital Management
Legal Notice / Disclaimer:
This document is not and should not be construed as an offer to sell or the solicitation of an offer to purchase or subscribe for any investment.
John Newell has based this document on information obtained from sources he believes to be reliable, but which has not been independently verified.
John Newell makes no guarantee, representation or warranty and accepts no responsibility or liability as to its accuracy or completeness. Expressions of opinion are those of John Newell only and are subject to change without notice. John Newell assumes no warranty, liability or guarantee for the current relevance, correctness or completeness of any information provided within this Report and will not be held liable for the consequence of reliance upon any opinion or statement contained herein or any omission.
Furthermore, I, John Newell, assume no liability for any direct or indirect loss or damage or for lost profit, which you may incur because of the use and existence of the information provided within this Report.
It should not be assumed that the methods, techniques, or indicators presented in these pages will be profitable or that they will not result in losses. Past results are not necessarily indicative of future results. Examples presented on these pages are for educational purposes only. These set-ups are not solicitations of any order to buy or sell. The authors, the publisher, and all affiliates assume no responsibility for your trading results. There is a high degree of risk in trading. Hypothetical and historical performance results have many inherent limitations, some of which are described below. No representation is being made that any account will or is likely to achieve profits or losses similar to those shown. In fact, there are frequently sharp differences between hypothetical and historical performance results and the actual results subsequently achieved by any trading program. One of the limitations of hypothetical and historical performance results is that they are generally presented with the benefit of hindsight. In addition, hypothetical and historical trading may not present the financial risks and returns for future trading. For example, the ability to withstand losses or to adhere to a particular trading program in spite of trading losses are material points which can also adversely affect trading results. There are numerous other factors related to the markets in general or to the implementation of any specific trading program which cannot be fully accounted for in the preparation of hypothetical performance results and all which can adversely affect actual trading results. Disclaimer: This Publication is protected by Canadian and International Copyright laws. All rights reserved. No license is granted to the user except for the user’s personal use. No part of this publication or its contents may be copied, downloaded, stored in a retrieval system, further transmitted, or otherwise reproduced, stored, disseminated, transferred, or used, in any form or by any means without prior written permission. This publication is proprietary. Neither the information, nor any opinion expressed constitutes a solicitation for the purchase of an investment program. Any further disclosure or use, distribution, dissemination or copying of this message or any attachment is strictly prohibited; such information, whether derived from Fieldhouse Capital Management or from any oral or written communication by way of opinion, advice, or otherwise with a principal of the company is not warranted in any manner whatsoever, is for the use of our customers only and may be obtained from internal and external research sources considered to be reliable.
The production numbers are reviewed in a BMO Capital Markets report.
In an Oct. 15 research note, BMO Capital Markets analyst Andrew Mikitchook reported that Wesdome Gold Mines Ltd.’s (WDO:TSX) Q3/19 production was a beat and management raised full-year production guidance. “Eagle continues to outperform, delivering strong cash flows,” the analyst added, referring to the company’s Ontario mine.
During Q3/19, Wesdome produced 28,910 ounces (28.91 Koz) of gold at Eagle, which exceeded BMO’s forecast of 19 Koz and the company’s Q2/19 production by 29%, indicated Mikitchook. This beat was due to positive grades that averaged 13.3 grams per ton (13.3 g/t). In comparison, reserve grades at Eagle are about 12 g/t. Thus far in 2019, the gold miner produced 70.3 Koz.
Mikitchook relayed that Wesdome’s management increased full-year 2019 production guidance to 8893 Koz gold from 7280 Koz but did not change cost guidance, which is a cash cost of US$640 per ounce or an all-in sustaining cost of US$985 per ounce. Costs for the year are expected to come in at the low end of guidance.
The company’s strong cash flows continue to fund Wesdome’s ongoing exploration at its Eagle and Kiena mines, Mikitchook pointed out.
BMO has an Outperform rating and a CA$9 per share target price on Wesdome. The company’s current share price is around CA$6.49.
Disclosure: 1) Doresa Banning compiled this article for Streetwise Reports LLC and provides services to Streetwise Reports as an independent contractor. She or members of her household own securities of the following companies mentioned in the article: None. She or members of her household are paid by the following companies mentioned in this article: None. 2) The following companies mentioned in this article are billboard sponsors of Streetwise Reports: None. Click here for important disclosures about sponsor fees. 3) Comments and opinions expressed are those of the specific experts and not of Streetwise Reports or its officers. The information provided above is for informational purposes only and is not a recommendation to buy or sell any security. 4) The article does not constitute investment advice. Each reader is encouraged to consult with his or her individual financial professional and any action a reader takes as a result of information presented here is his or her own responsibility. By opening this page, each reader accepts and agrees to Streetwise Reports’ terms of use and full legal disclaimer. This article is not a solicitation for investment. Streetwise Reports does not render general or specific investment advice and the information on Streetwise Reports should not be considered a recommendation to buy or sell any security. Streetwise Reports does not endorse or recommend the business, products, services or securities of any company mentioned on Streetwise Reports. 5) From time to time, Streetwise Reports LLC and its directors, officers, employees or members of their families, as well as persons interviewed for articles and interviews on the site, may have a long or short position in securities mentioned. Directors, officers, employees or members of their immediate families are prohibited from making purchases and/or sales of those securities in the open market or otherwise from the time of the interview or the decision to write an article until three business days after the publication of the interview or article. The foregoing prohibition does not apply to articles that in substance only restate previously published company releases.
Disclosures from BMO Capital Markets, Wesdome Gold Mines, October 15, 2019
IMPORTANT DISCLOSURES
Analyst’s Certification I, Andrew Mikitchook, hereby certify that the views expressed in this report accurately reflect my personal views about the subject securities or issuers. I also certify that no part of my compensation was, is, or will be, directly or indirectly, related to the specific recommendations or views expressed in this report.
Analysts who prepared this report are compensated based upon (among other factors) the overall profitability of BMO Capital Markets and their affiliates, which includes the overall profitability of investment banking services. Compensation for research is based on effectiveness in generating new ideas and in communication of ideas to clients, performance of recommendations, accuracy of earnings estimates, and service to clients.
For Important Disclosures on the stocks discussed in this report, please click here.
Uzbekistan’s central bank left its benchmark refinancing rate unchanged at 16.0 percent but said it would undertake a series of macro prudential measures to restrain lending by banks, eliminate imbalances in the financial markets and ensure overall financial stability.
The Central Bank of the Republic of Uzbekistan (CBU), which has maintained its rate since raising it by 200 basis points in September 2018, described its decision as a “prudent approach” to monetary policy that takes into account the existing realities of the economy and ensures stable prices and financial stability.
Inflation in Uzbekistan has been accelerating this year and rose to a higher-than-forecast 16.5 percent in August due to an acceleration in investment loans, government spending, a devaluation of the sum along with higher regulated prices of electricity and gas, and the indexation of wages and pensions.
In 2018 inflation in Uzbekistan averaged 14.3 percent, steady from 2017’s 14.4 percent.
But CBU said in a statement from Oct. 19 that inflation eased to 16.0 percent in September, confirming that some of the price rises were temporary in nature, and inflation is expected to ease toward 15.5 percent – the upper boundary of its 13.5-15.5 percent forecast corridor for 2019 – as one-time effects slowly fade.
In October, however, inflation is expected to rise temporarily due to the abolition of VAT exemptions on a number of imported goods as well as the liberalization of prices for flour and bread.
In July the central bank said it was still assuming inflation would ease to 10-12 percent in 2020 and then decelerate further to single digits in 2021.
Uzbekistan’s economy has been growing rapidly this year, boosted by banks’ lending and government spending, with gross domestic product up 5.8 percent year-on-year in the second quarter, up from 5.3 percent in the first quarter.
Lending by banks rose 38.3 percent in the first 9 months of the year, including loans in the national currency, which were up 34.3 percent, down from 61.1 percent in the same 2018 period, partly due to a gradual liberalization of interest rates in the country and the simultaneous improvement in lending conditions and mechanism, which are enhancing the efficiency of the central bank’s transmission mechanism.
But there was also a rise in the demand for foreign currency, resulting in a faster devaluation of the sum, in particular in July and August. In the second half of August the sum fell sharply against the U.S. dollar and was on Friday trading around 9,452 to the U.S. dollar, down 7.9 percent from Aug. 14 and down 11.8 percent since the start of this year.
Uzbekistan’s economy is in the midst of major economic reforms begun in 2016, with reforms so far including liberalization of foreign exchange, tax reform and an upgrade in the quality and availability of economic statistics.
The liberalization has unleashed strong demand for investments that have been unmet for years, boosting the trade deficit which the CBU expects will be covered by the current and financial account and thus not create significant pressures on the sum’s exchange rate.
In April CBU undertook three major projects to upgrade the payment system that should allow the interbank payment system to function 24 hours, 7 days a week in contrast to the current system which doesn’t permit financial transactions after 5 p.m. local time and on the weekends and holidays. www.CentralBankNews.info
Here are the latest links to our coverage of the Commitment of Traders data changes.
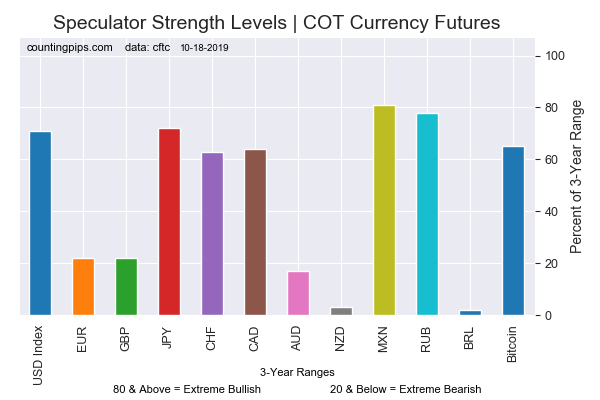
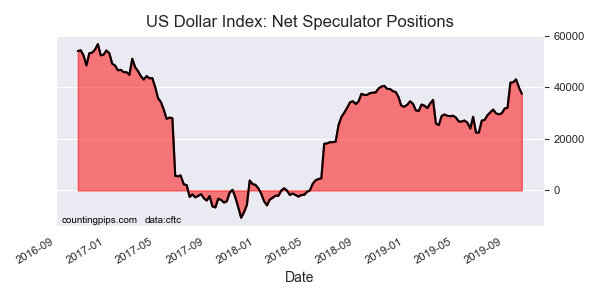
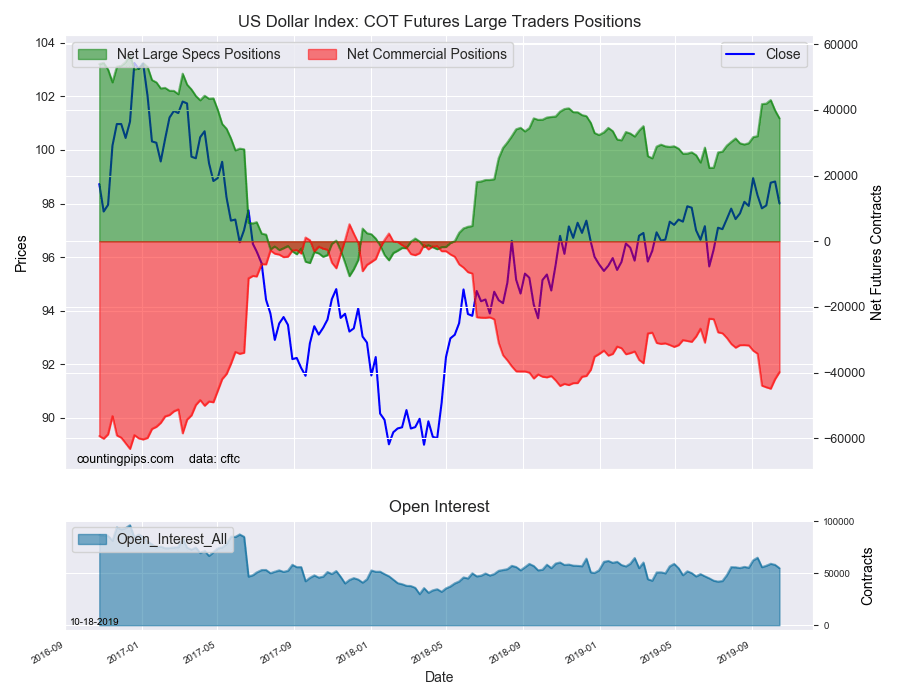
This week in the COT data, currency speculators decreased their US Dollar Index bullish betsfor a second straight week following a streak of six straight weekly gains that had pushed USD index bets to 2-year highs.
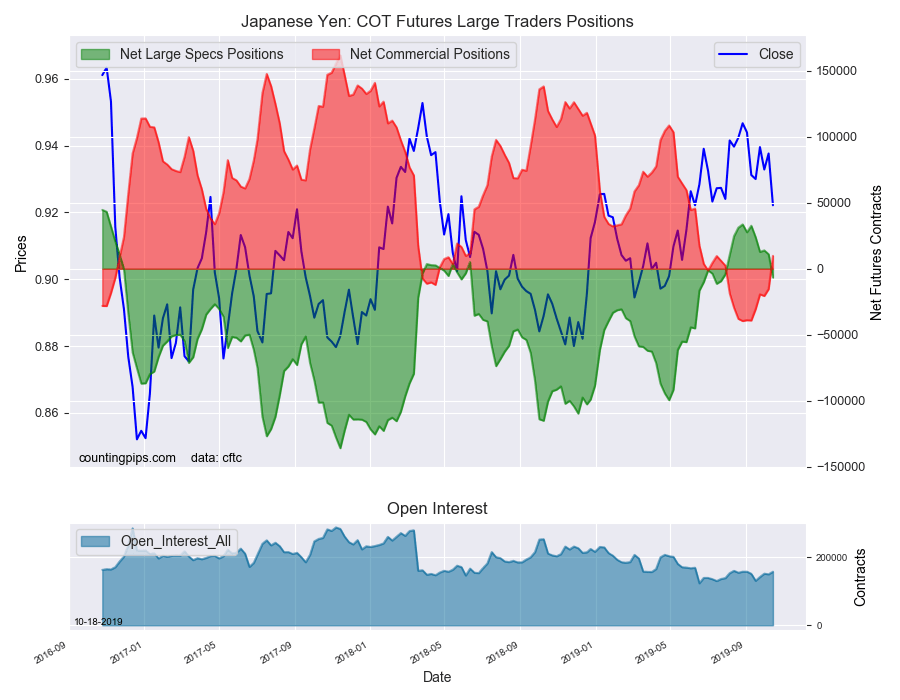
Japanese yen bets also dropped this week and fell back into overall bearish territory for the first time in eleven weeks. The sentiment for the JPY has turned sour after surging throughout the summer.
Precious metals speculators sharply dropped their Gold bullish positions this week after small gain last week. Gold bets have now fallen in two out of the past three weeks and slid to the lowest level since July 23rd.
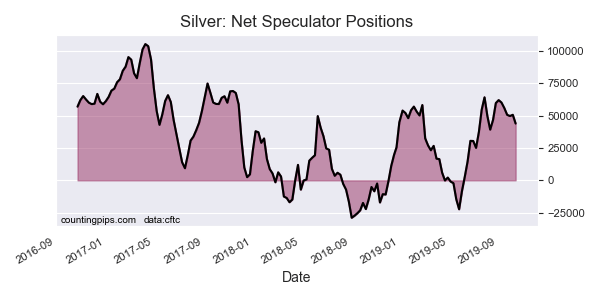
Silver speculators were back to shedding their bullish bets this week for the fifth time out of the past six weeks. Silver positions are at the lowest level of the past nine weeks.
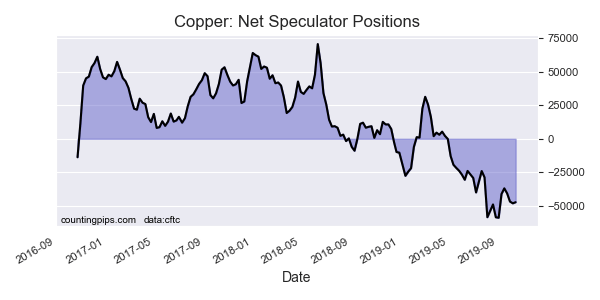
Copper speculators reduced their bearish bets this week following three straight weeks of higher bearish positions. The copper speculative position continues to be strongly bearish although off the record high bearish level of September 3rd at a total of -58,841 contracts
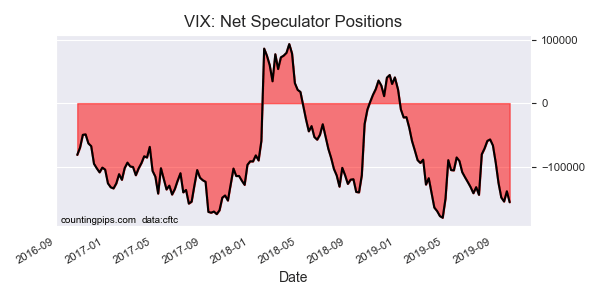
VIX speculators added to their bearish positions for the sixth time out of the past seven weeks this week. The VIX spec bearish position is at the most bearish level since the April 30th record high position.
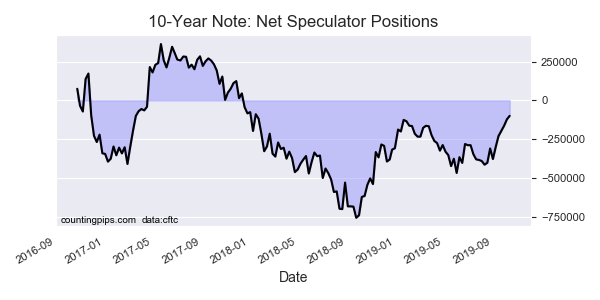
The 10-Year Bond speculators once again cut back on their bearish bets for the sixth straight week and dropped the net position to the least bearish level in ninety-one weeks. Speculators have decreased their bearish bets by a total of 278,175 contracts in the past six weeks.
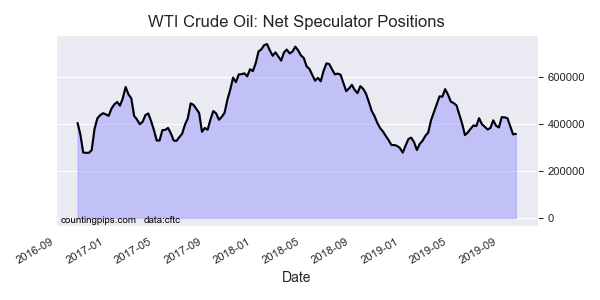
Lastly, the WTI Crude Oil speculators slightly edged their bullish bets higher this week following four consecutive weekly declines. Despite this week’s small gain, the overall bullish position is under the +400,000 net contract level for a third week.
Large currency speculators decreased their net positions in the US Dollar Index futures markets this week, according to the latest Commitment of Traders (COT) data released by the Commodity Futures Trading Commission (CFTC) on Friday. See full article.
The large speculator contracts of WTI crude futures totaled a net position of 356,884 contracts, according to the latest data this week. This was a change of 1,799 contracts from the previous weekly total. See full article.
Large speculator contracts of the 10-Year Bond futures totaled a net position of -99,692 contracts, according to the latest data this week. This was a change of 22,868 contracts from the previous weekly total. See full article.
Large precious metals speculator contracts of the Gold futures totaled a net position of 253,027 contracts, according to the latest data this week. This was a change of -22,536 contracts from the previous weekly total. See full article.
Large stock market volatility speculator contracts of the VIX futures totaled a net position of -155,980 contracts, according to the latest data this week. This was a change of -17,300 contracts from the previous weekly total. See full article.
Large precious metals speculator contracts of the silver futures totaled a net position of 43,989 contracts, according to the latest data this week. This was a change of -6,765 contracts from the previous weekly total. See full article.
Metals speculator contracts of the copper futures totaled a net position of -47,255 contracts, according to the latest data this week. This was a change of 838 contracts from the previous weekly total. See full article.
*COT Report: The COT data, released weekly to the public each Friday, is updated through the most recent Tuesday (data is 3 days old) and shows a quick view of how large speculators or non-commercials (for-profit traders) were positioned in the futures markets.
The CFTC categorizes trader positions according to commercial hedgers (traders who use futures contracts for hedging as part of the business), non-commercials (large traders who speculate to realize trading profits) and nonreportable traders (usually small traders/speculators).
The UK economy has been delivered another fresh blow following the drama that has taken place in the British parliament on Saturday.
This is the stark message from the CEO of one of the world’s largest independent financial advisory organizations.
The comments from Nigel Green, chief executive of deVere Group, come as Prime Minister Boris Johnson faced a new setback after MPs backed a move – in the form of the Letwin Amendment – to delay a Brexit deal until further legislation is passed.
Dubbed Super Saturday, it was Parliament’s first weekend session in 37 years.
Mr Green notes: “One of the most important days in British political history became something of a damp squib as the Letwin Amendment rendered the Meaningful Vote meaningless.
“The prospect of a no-deal Brexit is now becoming increasingly likely. As such, the government is said to be upping its no-deal preparations and is set to introduce legislation needed for the UK to leave the EU on October 31.
“The Prime Minister is clear that he will not negotiate a delay and says that the law doesn’t compel him to do so. He will tell EU leaders there should be no delays and that they should reject Parliament’s letter asking for a delay.”
He continues: “These extraordinary goings-on extend and intensify the ongoing Brexit-fuelled uncertainty and chaos.
“The event of not-so-Super Saturday will negatively hit UK financial assets, major investment decisions will continue to be put on hold by companies and organisations, as will big-ticket spending items by households, and confidence and opportunity will continue to be undermined.
“This will, of course, all compromise the British economy.”
He goes on to add: “Much of the chaos has already been priced-in to the pound, so it will be to some degree shielded from the events in parliament today.”
Mr Green concludes: “The tense and volatile geopolitical climate in the UK is one of the main headwinds for domestic UK and international investors around the world as what happens in Westminster can affect returns.
“UK and international investors in UK assets can be expected to respond to the continuing uncertainties by considering removing their wealth and assets away from the UK.
“Amid the uncertainty, one thing is certain: Whatever happens next, the ongoing Brexit nightmare is not going to end on Halloween.”
About:
deVere Group is one of the world’s largest independent advisors of specialist global financial solutions to international, local mass affluent, and high-net-worth clients. It has a network of more than 70 offices across the world, over 80,000 clients and $12bn under advisement
Large currency speculators decreased their bullish net positions in the US Dollar Index futures markets this week, according to the latest Commitment of Traders (COT) data released by the Commodity Futures Trading Commission (CFTC) on Friday.
The non-commercial futures contracts of US Dollar Index futures, traded by large speculators and hedge funds, totaled a net position of 37,436 contracts in the data reported through Tuesday October 15th. This was a weekly reduction of -2,423 contracts from the previous week which had a total of 39,859 net contracts.
This week’s net position was the result of the gross bullish position (longs) dropping by -4,689 contracts (to a weekly total of 44,288 contracts) compared to the gross bearish position (shorts) which saw a lesser decrease by -2,266 contracts on the week (to a total of 6,852 contracts).
US Dollar Index speculators dropped their bullish bets for a second straight this week following a streak of six consecutive weekly gains. The dollar positioning s now under the +40,000 net position for a second straight week after bets had ascended to a 127-week high at +43,028 net contracts on October 1st.
Individual Currencies Data this week:
In the other major currency contracts data, we saw only one substantial change (+ or – 10,000 contracts) in the speculators category this week.
Japanese yen speculators strongly bailed out (-17,653 change in contracts) of their positions this week and pushed the overall level back into bearish territory for the first time in eleven weeks. Yen positioning had reached a 2019 high on August 27th at a total of 33,607 contracts before sentiment turned lower and fell for five out of the next seven weeks.
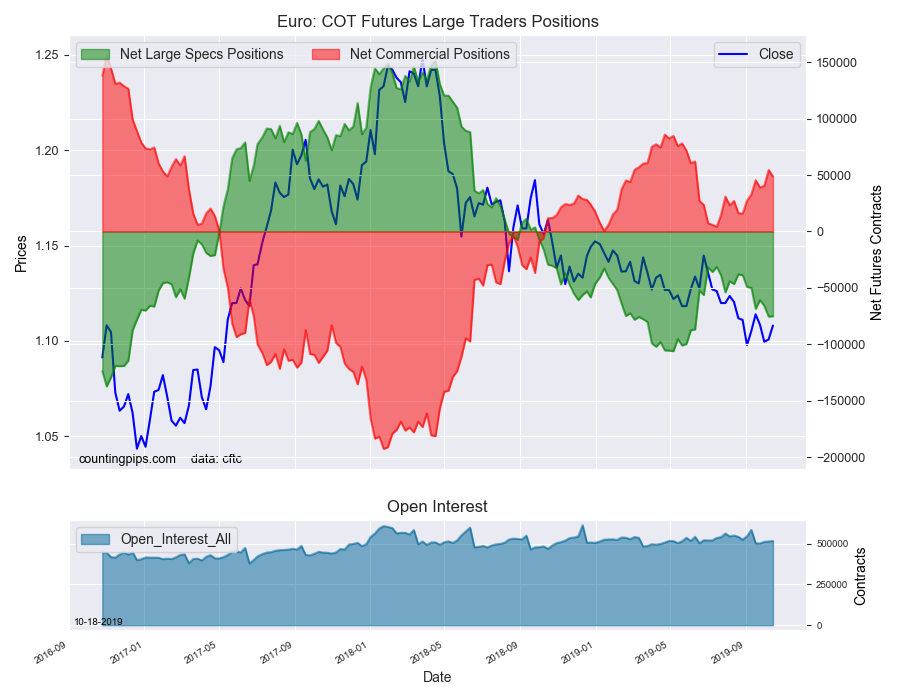
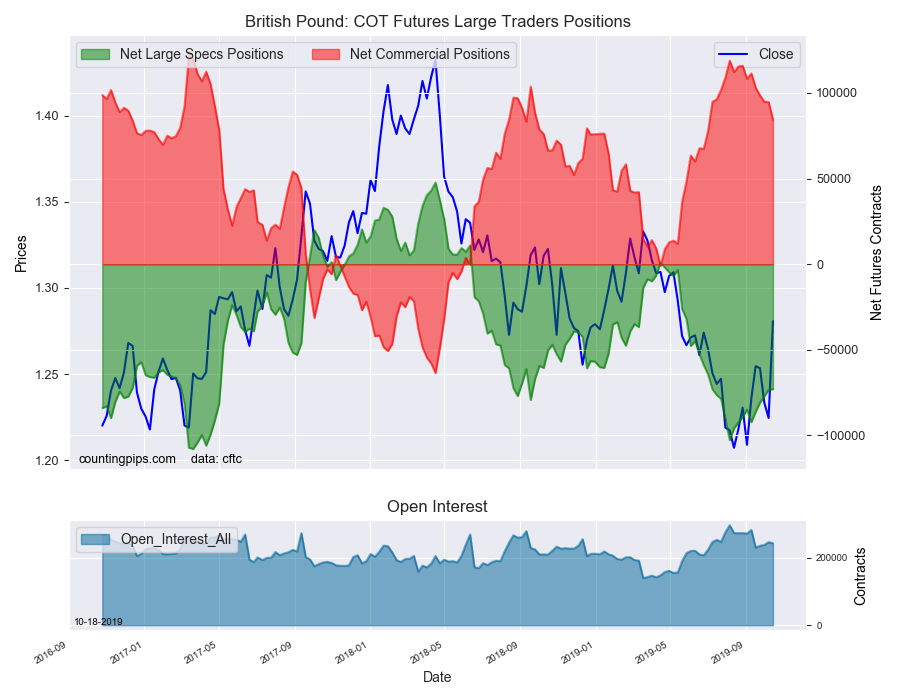
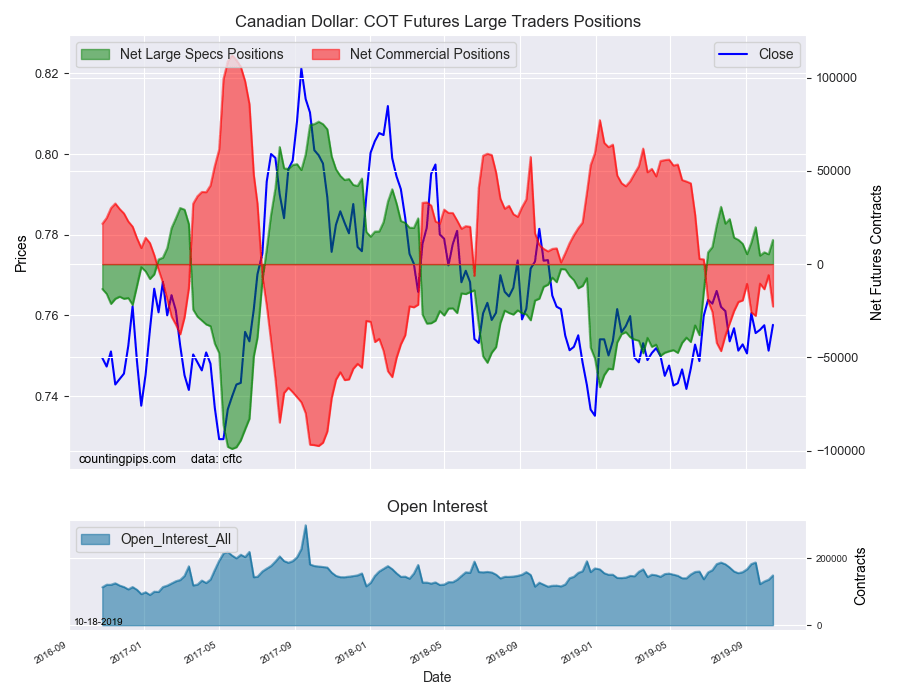
Overall, the major currencies that saw improving speculator positions this week were the euro (259 weekly change in contracts), British pound sterling (267 contracts) and the Canadian dollar (7,648 contracts).
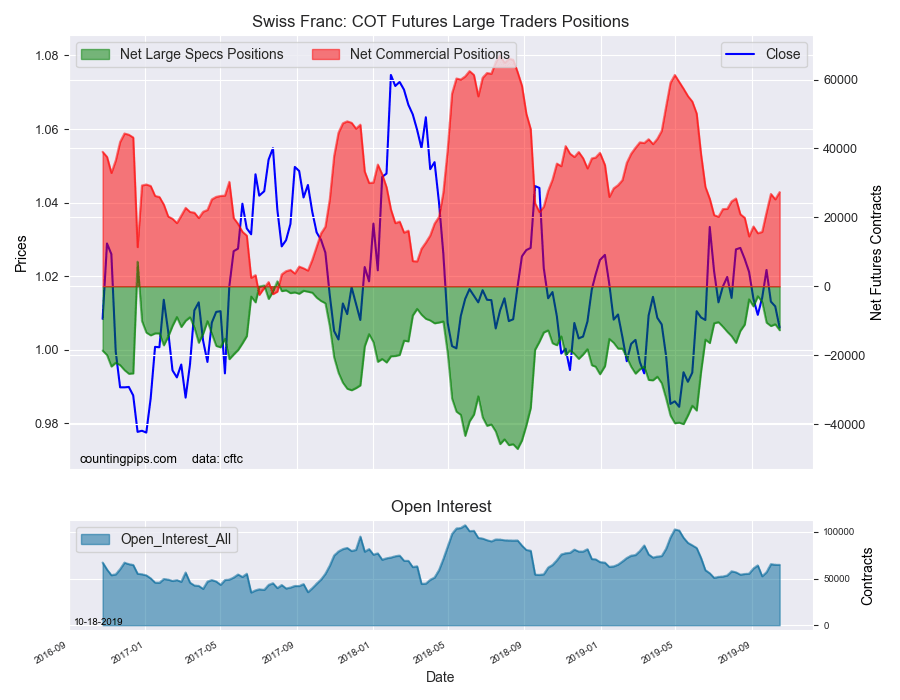
The currencies whose speculative bets declined this week were the US dollar index (-2,423 weekly change in contracts), Japanese yen (-17,653 contracts), Swiss franc (-1,719 contracts), Australian dollar (-661 contracts), New Zealand dollar (-1,946 contracts) and the Mexican peso (-1,920 contracts).
Other Notables:
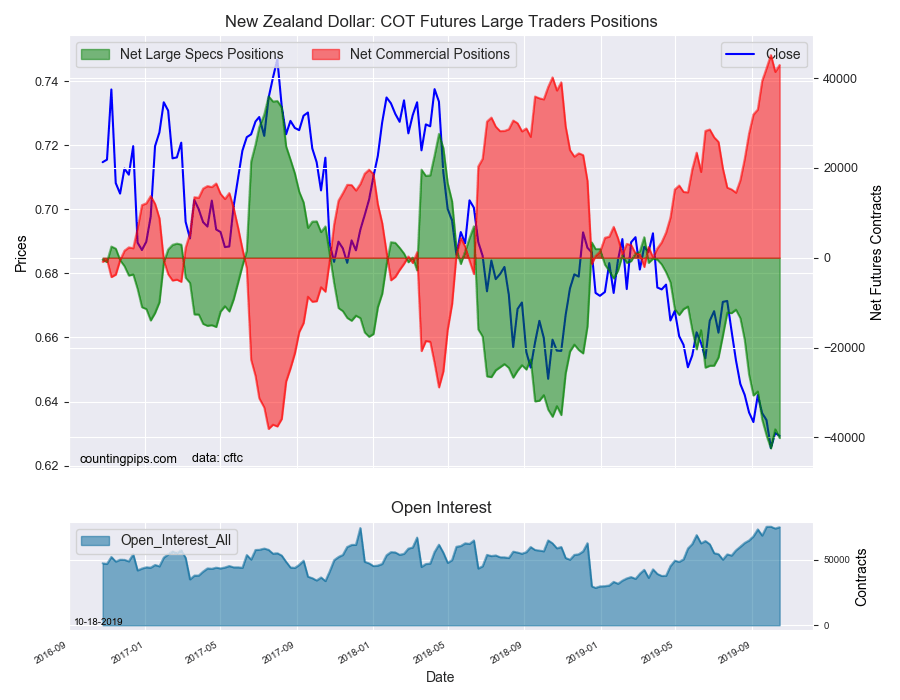
New Zealand dollar speculators pushed their bearish positions higher again this week for the fourth time out of the past five weeks. The overall position is back over the -40,000 net contract level for only the second time in history with the first being two weeks ago (the all-time record bearish position of -42,474 contracts).
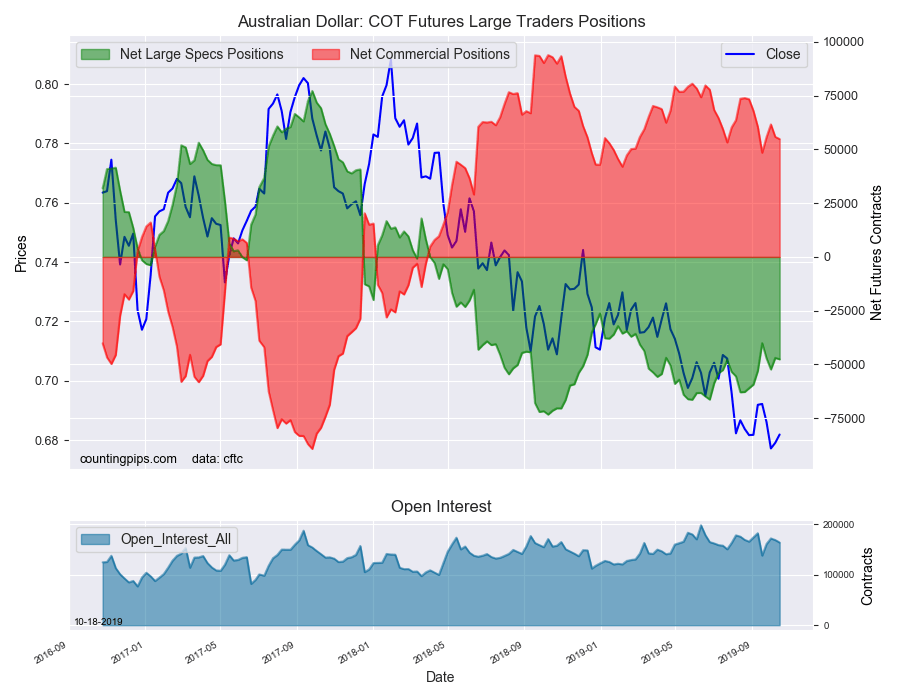
Australian dollar speculators slightly added to the bearish bets this week for the third time in the past four weeks. Overall, the AUD position remains in the lower part of its three year range and the AUD has now been in bearish territory for eighty-one straight weeks, dating back to March of 2018.
Chart: Current Strength of Each Currency compared to their 3-Year Range
See the table and individual currency charts below.
Table of Large Speculator Levels & Weekly Changes:
Currency
Net Speculator Position
Specs Weekly Change
USD Index
37,436
-2,423
EuroFx
-75,154
259
GBP
-72,952
267
JPY
-6,641
-17,653
CHF
-12,766
-1,719
CAD
12,961
7,648
AUD
-47,605
-661
NZD
-40,163
-1,946
MXN
113,476
-1,920
This latest COT data is through Tuesday and shows a quick view of how large speculators or non-commercials (for-profit traders) were positioned in the futures markets. All currency positions are in direct relation to the US dollar where, for example, a bet for the euro is a bet that the euro will rise versus the dollar while a bet against the euro will be a bet that the dollar will gain versus the euro.
Weekly Charts: Large Trader Weekly Positions vs Price
EuroFX:
The Euro large speculator standing this week resulted in a net position of -75,154 contracts in the data reported through Tuesday. This was a weekly gain of 259 contracts from the previous week which had a total of -75,413 net contracts.
British Pound Sterling:
The large British pound sterling speculator level totaled a net position of -72,952 contracts in the data reported this week. This was a weekly advance of 267 contracts from the previous week which had a total of -73,219 net contracts.
Japanese Yen:
Large Japanese yen speculators recorded a net position of -6,641 contracts in this week’s data. This was a weekly decline of -17,653 contracts from the previous week which had a total of 11,012 net contracts.
Swiss Franc:
The Swiss franc speculator standing this week reached a net position of -12,766 contracts in the data through Tuesday. This was a weekly decline of -1,719 contracts from the previous week which had a total of -11,047 net contracts.
Canadian Dollar:
Canadian dollar speculators totaled a net position of 12,961 contracts this week. This was a rise of 7,648 contracts from the previous week which had a total of 5,313 net contracts.
Australian Dollar:
The large speculator positions in Australian dollar futures reached a net position of -47,605 contracts this week in the data ending Tuesday. This was a weekly fall of -661 contracts from the previous week which had a total of -46,944 net contracts.
New Zealand Dollar:
The New Zealand dollar speculative standing came in at a net position of -40,163 contracts this week in the latest COT data. This was a weekly lowering of -1,946 contracts from the previous week which had a total of -38,217 net contracts.
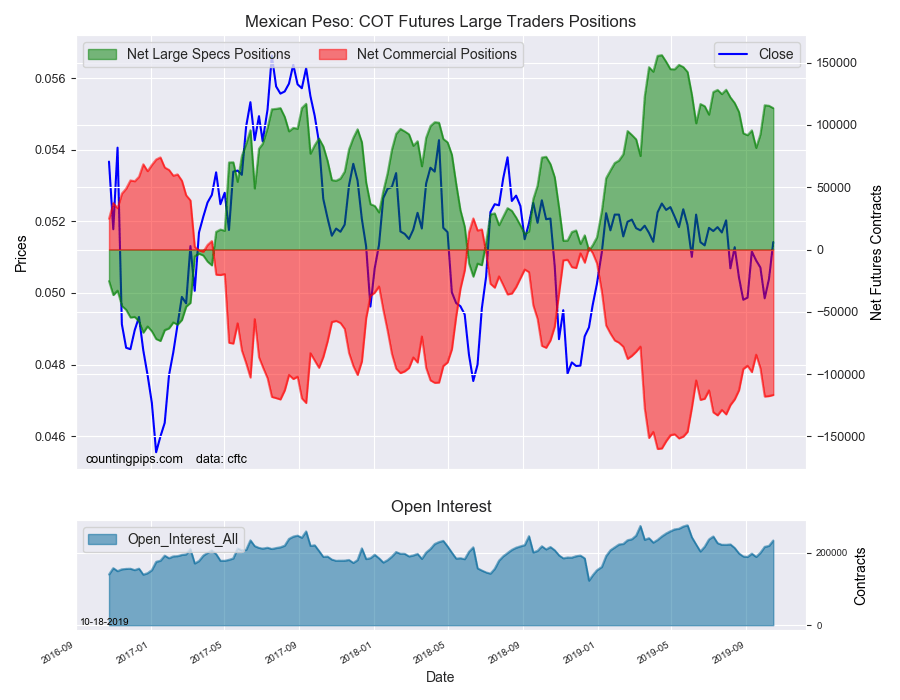
Mexican Peso:
Mexican peso speculators resulted in a net position of 113,476 contracts this week. This was a weekly lowering of -1,920 contracts from the previous week which had a total of 115,396 net contracts.
*COT Report: The COT data, released weekly to the public each Friday, is updated through the most recent Tuesday (data is 3 days old) and shows a quick view of how large speculators or non-commercials (for-profit traders) were positioned in the futures markets.
The CFTC categorizes trader positions according to commercial hedgers (traders who use futures contracts for hedging as part of the business), non-commercials (large traders who speculate to realize trading profits) and nonreportable traders (usually small traders/speculators).