Equities Traders Spooked By Trade Deal Comments

By Orbex

Deal Not Done Yet

Risk markets have recovered today following some jitters seen across yesterday’s session.

These came in response to reports that the US-China trade deal might not be as “done” as comments have suggested.

Reuters ran a story yesterday reporting White House officials as saying that while negotiations are continuing between the US and China, the deal might not necessarily be ready in time for Trump and Xi to sign it at the upcoming APEC meeting in November.

The White House official told reporters:

“If it’s not signed in Chile, that doesn’t mean that it falls apart. It just means that it’s not ready. Our goal is to sign it in Chile. But sometimes texts aren’t ready. But good progress is being made and we expect to sign the agreement in Chile”.

The official was keen to stress that the aim remains to have the deal signed in Chile. However, as of yet, the date is still fluid and could move back if the deal is not finished.

US & China Have An Understanding

However, the market is still hopeful that the two sides will agree on a deal. 

This sentiment is in line with the recent optimism shown by both US and Chinese officials on the back of last week’s talks. Speaking at the Future Investment Initiative Conference in Riyadh yesterday, White House adviser Jared Kushner said:

“I think people understand the President, that he’s firm, they know that he’s going to make the decisions that he thinks are right, and I think ultimately that we’ve come to an understanding with China now on where we want to head.

Indeed, Kushner also acknowledged the political cost of the trade war for Trump saying:

“All of the costs of it, the tariffs, the retaliation that people have put on, he’s paid the price for, during his presidency.”

Kushner added that he believed the US Treasury Secretary and Trade Representative have made a “fabulous deal” in their negotiations with Chinese officials.

Trump Talks Equities Up to New Highs

Speculation that a deal is forthcoming was heightened on Monday. This came following comments from Trump who noted that the deal with China was “ahead of schedule”.

Trump’s comments sparked a 100 point rally in the S&P which saw it surging up to fresh all-time highs.

Tariff Threat Remains

If the current optimism from both US and Chinese leaders isn’t enough to keep markets encouraged that the two sides will agree on a deal, then the threat of further tariffs might help.

The US has warned that the Chinese do not sign a deal by December 15th at the latest, it will press ahead with the next round of tariffs of 15% on $156 billion of Chinese goods.

US Trade Adviser Says China “Miscalculated”

Trump’s trade adviser Pete Navarro  told CNN:

“The Chinese have consistently miscalculated going back to Mar a Lago, they misread the signal of resolve and strength by the president. And as a result, they’ve slow-walked us and reneged on deals and all they’ve gotten is a tougher and tougher stance.”

Headlines around the ongoing trade talks are likely to be volatile, yielding neurotic market reactions. However, traders will be doing their best to focus on the facts. 

Currently, the negotiations are continuing. The hope is that they can reach a deal in November, allowing room to move on to discussing the “phase two” deal.

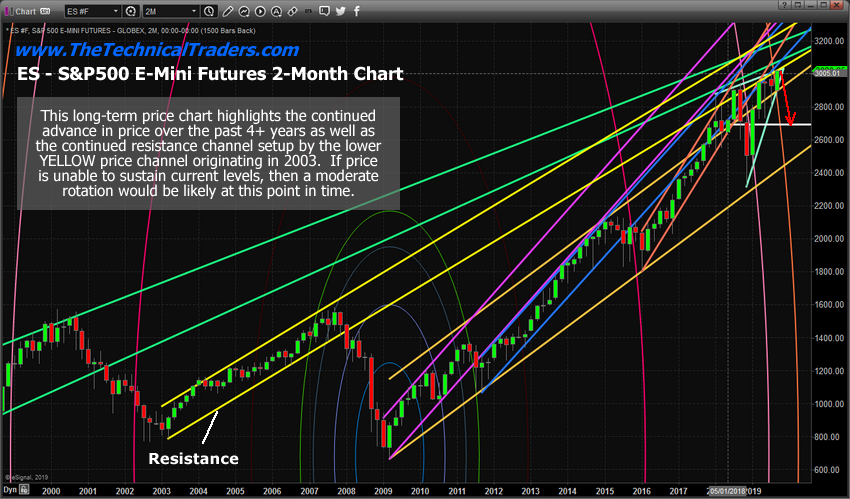
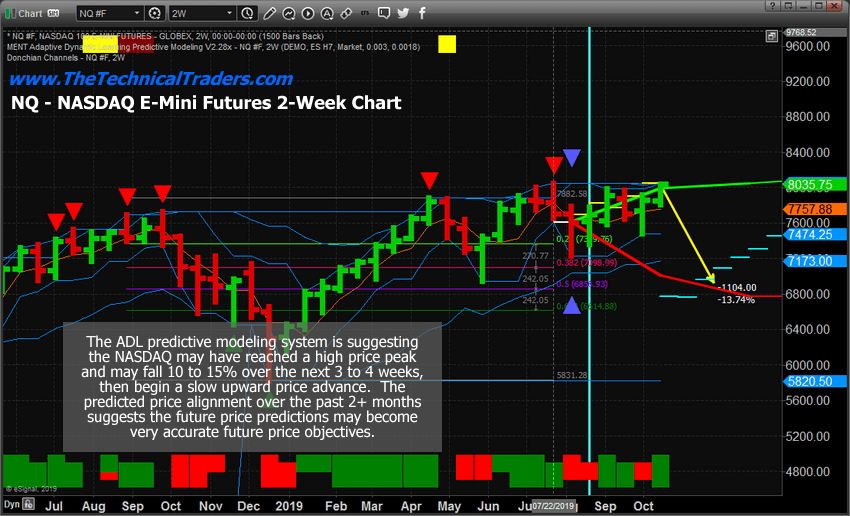
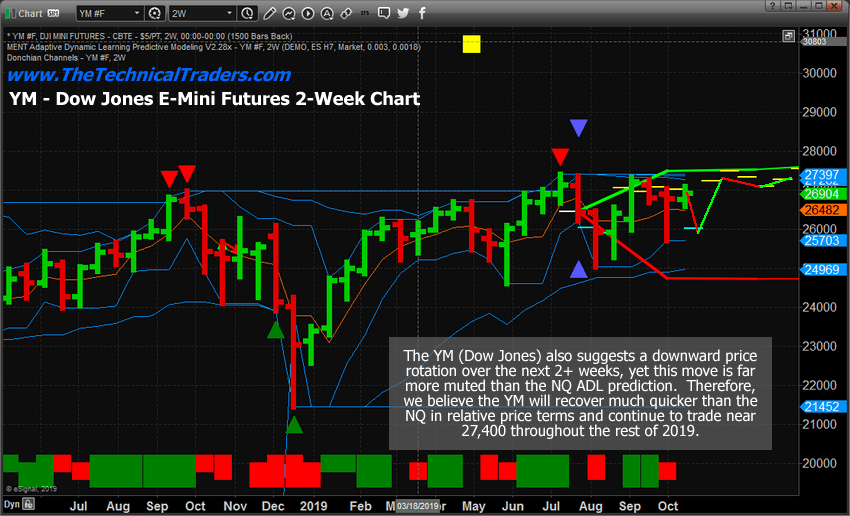
Technical Perspective

After breaking out above the 3028.08 level to print fresh all-time highs, SPX500 has subsequently tested the top of the recent bullish channel. This is holding as resistance for now.

The RSI indicator is showing some mild bearish divergence here. However, while we hold above the 3028.08 level, focus remains on a further push higher. If we break back below that level, the 3011.96 level bullish channel low will be the key support zone to watch.

By Orbex


Soybeans Analysis: Demand for US soybeans in China may be less than expected

By IFCMarkets

Demand for US soybeans in China may be less than expected

Demand for US soybeans in China may not be as large as previously expected. Will the Soyb quotations continue falling?

The U.S. Agriculture Department (USDA) previously reported exporting 475,000 tons of soybeans to China over the past week. This is noticeably less than the expected 800 thousand – 1.6 million tons. Last year, China introduced retaliatory duties on American soybeans, which should be abolished during the current trade negotiations between the two countries. It was assumed that after this, China will purchase up to 10 million tons of American soybeans per year. Theoretically, this demand has already been taken into account in current quotes. Meanwhile, before the sanctions (in 2017), China purchased only 8.4 million tons in the United States. In the current market year, which started in September, the USDA has so far confirmed shipments of 6 million tons of soybeans to China. The risk that China will acquire less American soy than expected could have a negative effect on quotations. Currently, the US is harvesting soybeans. Weather conditions are quite favorable and it may exceed forecasts.

Soyb

On the daily timeframe Soyb: D1 broke down the support line of a growing trend. Most technical analysis indicators formed a signal to decline. A downward movement may occur in the case of a large crop in the United States and a decrease in demand in China.

  • The Parabolic indicator gives a bullish signal.
  • The Bolinger bands widened, indicating high volatility. The upper Bollinger line has a downward slope.
  • The RSI indicator is below the mark of 50. It has formed a divergence to fall.
  • The MACD indicator demonstrates a downward signal.

The bullish momentum may develop if Soyb falls below the last low: 930. This level can be used as an entry point. The initial stop lose may be placed higher than the last upper fractal, the maximum since June 2018 and the Parabolic signal: 960. After opening a pending order, the stop shall be moved following the Bollinger and Parabolic signals to the next fractal minimum. Thus, we are changing the potential profit/loss to the breakeven point. More risk-averse traders may switch to the 4-hour chart after the trade and place a stop loss moving it in the direction of the trade. If the price meets the stop level (960) without reaching the order (930), we recommend to cancel the order: the market sustains internal changes that were not taken into account.

Technical Analysis Summary

PositionSell
Sell stopBelow 930
Stop lossAbove 960

Market Analysis provided by IFCMarkets

USD Lower Ahead Of FOMC

By Orbex

FOMC in Focus

The US dollar has been trading lower over the European morning on Wednesday as traders prepare for the October FOMC later today. The Fed is all-but-guaranteed to slash rates yet again with the latest market pricing reflecting a near 100% likelihood of a .25% rate cut.

With the move priced in, the main focus will be on the Fed’s forward guidance. If the Fed keeps the door open for further easing, we could see USD heavily sold. USD index trades 97.38 last.

EUR Higher on Weak USD

EURUSD has been higher today in light of the weakness in USD. The single currency has also been boosted by the confirmation that Brexit will now be delayed until January 31st.

This move has increased the likelihood of the UK leaving with a deal, thus avoiding an economic cliff edge for either the UK or the EU. EURUSD trades 1.1123 last.

GBP Higher on Elections News

GBPUSD has been firmer today, again benefiting from a weaker USD. The response to news of the Brexit delay has been muted, however, given the upcoming UK elections on December 12th which were agreed in parliament last night.

The elections have added further uncertainty to the picture for GBP trades. However, GBPUSD trades 1.2887 last, recovering well off the 1.2771 lows.

SPX500 Remains Near Highs

Risk assets have had a quiet session so far today. However, they are trading in the green as the market prepares itself for a further rate cut from the Fed. SPX500 remains above the 3028.08 level after breaking out to fresh highs earlier in the week on comments from Trump regarding the increasing proximity of a deal with China.

Safe Havens Rally

Safe havens have seen some upside today as a weaker USD allows for upside in both JPY and gold. USDJPY trades 108.83 last, still sitting above the 108.72 level for now.

XAUUSD trades 1492.87 last as the grind below the 1500 level continues. Tonight’s FOMC could provide the catalyst for a further directional move with bias tilted to the upside for now.

Crude Subdued

Oil prices have been flat today, broadly unchanged over the session as traders await the next clear directional cues. Reports yesterday suggesting that a US-China trade deal is not quite the “done” deal Trump has made out, weighed on price though we have since stabilized thanks to weakness in USD.

Yesterday the API reported a fourth-consecutive weekly build in US crude stores, which also weighed on prices. Traders will now look to today’s headline EIA report for confirmation. Crude trades 55.55 last, still sitting above the 55 level for now.

BOC Rate Cut in Question

USDCAD has been a little softer do far today given the weakness in USD ahead of the FOMC. However, with sentiment improving given the fresh Brexit delay and likelihood of a US-China trade deal in the near term, there are upside risks today for CAD. The BOC might opt to remain on hold at its October meeting, creating a divergence between it and the Fed. USDCAD trades 1.3080 last, back above the 1.308 level now.

AUD Rallies

AUDUSD is rising steadily today given the combination of Fed easing expectations and higher optimism around a US-China trade deal. Despite some negative reports yesterday, the market is hopeful that the US and China will press ahead with a deal, keeping AUD supported in the near term. Aussie trades .6878 last, nearing last week’s highs.

By Orbex


Forex Technical Analysis & Forecast 30.10.2019 (EURUSD, GBPUSD, USDCHF, USDJPY, AUDUSD, USDRUB, USDCAD, GOLD, BRENT, BTCUSD)

Article By RoboForex.com

EURUSD, “Euro vs US Dollar”

EURUSD has expanded the consolidation range towards 1.1117; in fact, the entire range may be considered as a correction. Possibly, the pair may choose an alternative scenario to continue the correction towards 1.1122. According to the main scenario, the price is expected to form a new descending structure to reach 1.1086, which may later be followed by a new grow towards 1.1102 and then further decline with the target at 1.1033.

EURUSD
Risk Warning: the result of previous trading operations do not guarantee the same results in the future

GBPUSD, “Great Britain Pound vs US Dollar”

After finishing the correction at 1.2900, GBPUSD has finished the descending impulse; right now, it is consolidating. Possibly, the pair may break 1.2838 and then continue trading downwards with the target at 1.2800. Later, the market may break this level as well and continue its decline towards 1.2704.

GBPUSD
Risk Warning: the result of previous trading operations do not guarantee the same results in the future

USDCHF, “US Dollar vs Swiss Franc”

USDCHF has completed the correction at 0.9933; right now, it is moving upwards with the target at 0.9955. After that, the instrument may start a new decline towards 0.9944 and then form one more ascending structure to reach the key target at 0.9977.

USDCHF
Risk Warning: the result of previous trading operations do not guarantee the same results in the future

USDJPY, “US Dollar vs Japanese Yen”

USDJPY has finished the descending impulse at 108.77; right now, it is consolidating. If later the price breaks this range to the downside, the market may continue the correction with the target at 108.51; if to the downside – start another growth to reach 109.33.

USDJPY
Risk Warning: the result of previous trading operations do not guarantee the same results in the future

AUDUSD, “Australian Dollar vs US Dollar”

AUDUSD is consolidating around 0.6860. Possibly, today the pair may expand the range towards 0.6844. Later, the market may resume moving upwards to reach 0.6877 and then continue trading inside the downtrend with the target at 0.6800.

AUDUSD
Risk Warning: the result of previous trading operations do not guarantee the same results in the future

USDRUB, “US Dollar vs Russian Ruble”

USDRUB has completed the correction at 64.00. Today, the pair may fall to break 63.63 and then continue trading inside the downtrend with the target at 63.33.

USDRUB
Risk Warning: the result of previous trading operations do not guarantee the same results in the future

USDCAD, “US Dollar vs Canadian Dollar”

USDCAD has finished the ascending impulse at 1.3080; right now, it is consolidating around it. Possibly, the pair may continue the correction to reach 1.3131 and then start another decline with the target at 1.3030.

USDCAD
Risk Warning: the result of previous trading operations do not guarantee the same results in the future

XAUUSD, “Gold vs US Dollar”

Gold has broken the consolidation range downwards. Possibly, today the pair may fall with the short-term target at 1478.28 and then start a new growth towards 1492.80. After that, the instrument may continue trading inside the downtrend with the first target at 1468.36.

GOLD
Risk Warning: the result of previous trading operations do not guarantee the same results in the future

BRENT

Brent has finished the ascending impulse at 61.94; right now, it is correcting towards 61.27. Later, the market may form one more ascending structure to reach 62.22 and then resume trading downwards with the target at 61.75. After that, the instrument may start another growth with the short-term target at 62.89.

BRENT
Risk Warning: the result of previous trading operations do not guarantee the same results in the future

BTCUSD, “Bitcoin vs US Dollar”

BTCUSD is consolidating above 9060.00. Possibly, the pair may break 9500.00 to the upside and then continue trading inside the uptrend towards 9900.00. The key target of this ascending structure is at 10800.00.

BITCOIN

Article By RoboForex.com

Attention!
Forecasts presented in this section only reflect the author’s private opinion and should not be considered as guidance for trading. RoboForex LP bears no responsibility for trading results based on trading recommendations described in these analytical reviews.

Fibonacci Retracements Analysis 30.10.2019 (GBPUSD, EURJPY)

Article By RoboForex.com

GBPUSD, “Great Britain Pound vs US Dollar”

As we can see in the H4 chart, there was a divergence on MACD, which made GBPUSD complete the rising wave at 76.0% fibo at 1.3040 and start a new pullback. The support is at 1.2670. after completing the correction, the instrument may start another rising impulse to reach the previous high at 1.30450 and then the key one at 1.3381.

GBPUSD_H4
Risk Warning: the result of previous trading operations do not guarantee the same results in the future

The H1 chart shows more detailed structure of the current descending correction after the divergence. The pair has already reached 23.6% fibo, but may yet continue falling towards 38.2% and 50.0% fibo at 1.2699 and 1.2604. at the same time, there is a short-term convergence, which is slowing down the current decline.

GBPUSD_H1
Risk Warning: the result of previous trading operations do not guarantee the same results in the future

EURJPY, “Euro vs. Japanese Yen”

As we can see in the H4 chart, there was a divergence on MACD, which made EURJPY finish the ascending wave at 76.0% fibo at 121.55 and start a new sideways movement. If the price breaks the resistance at 121.27 the pair may resume growing. The key target is the high at 123.36.

EURJPY
Risk Warning: the result of previous trading operations do not guarantee the same results in the future

In the H1 chart, the pair has reached 23.6% fibo. In the future, the instrument may continue falling towards 38.2% and 50.0% fibo at 119.79 and 119.27 respectively.

EURJPY_H1

Article By RoboForex.com

Attention!
Forecasts presented in this section only reflect the author’s private opinion and should not be considered as guidance for trading. RoboForex LP bears no responsibility for trading results based on trading recommendations described in these analytical reviews.

Will a dovish FED lead to a bullish yearly close for Gold?

By Admiral Markets

Source: Economic Events 30 October 2019 – Admiral Markets’ Forex Calendar

Today, all eyes are on the FED rate decision.

While a rate cut of 25 basis points is nearly completely priced in (currently the FED Watch Tool shows a likelihood of way over 90%), what’s certainly of higher interest is the rhetoric in regards to the rate decision in December and the announced “Non-QE”-QE program.

In regards to the latter, the current plan is to buy US Treasuries for the next 8.5 months at a pace of 60 billion USD per month, and any hints at Wednesday’s meeting that the FED could consider extending that program if there are no liquidity improvements could result in Gold taking on bullish momentum. This could lead Gold to recapture 1,500 USD, with US yields expected to push lower again.

If in addition to such a dovish rhetoric, speculations around another 25 basis point rate cut for the December meeting are taking on momentum again (currently the FED Watch Tool sees a surprisingly low likelihood of below 20% for such a rate cut), and the upcoming US economic releases, especially the ISM Manufacturing on Friday, could trigger further bullish momentum in Gold into the weekly close.

If the ISM data continues to trend lower and result in rising recession fears (for September the ISM Manufacturing dropped to 47.8, the steepest contraction in the manufacturing sector since June 2009), the yellow metal has a good and solid chance to go for an attack at the region around 1,520 USD.

In general and from a technical perspective, the advantage in Gold stays on the Long side above 1,380 USD and our mid-term target around 1,650/700 USD is still active.

And again: even a stint below the current October lows around 1,460 USD wouldn’t darken the picture, but instead bring a potential mid-term long trigger around 1,440/450 USD into play:

Source: Admiral Markets MT5 with MT5SE Add-on Gold Daily chart (between 31 July 2018 to 29 October 2019). Accessed: 29 October 2019 at 10:00 PM GMT

Please note: Past performance is not a reliable indicator of future results, or future performance.

In 2014, the value of Gold fell by 1.7%, in 2015, it fell by 10.4%, in 2016 it increased by 8.1%, in 2017 it increased by 13.1%, in 2018, it fell by 1.6%, meaning that after five years, it was up by 6.4%.

Trade With MetaTrader 5

Disclaimer: The given data provides additional information regarding all analysis, estimates, prognosis, forecasts or other similar assessments or information (hereinafter “Analysis”) published on the website of Admiral Markets. Before making any investment decisions please pay close attention to the following:

  1. This is a marketing communication. The analysis is published for informative purposes only and are in no way to be construed as investment advice or recommendation. It has not been prepared in accordance with legal requirements designed to promote the independence of investment research, and that it is not subject to any prohibition on dealing ahead of the dissemination of investment research.
  2. Any investment decision is made by each client alone whereas Admiral Markets shall not be responsible for any loss or damage arising from any such decision, whether or not based on the Analysis.
  3. Each of the Analysis is prepared by an independent analyst (Jens Klatt, Professional Trader and Analyst, hereinafter “Author”) based on the Author’s personal estimations.
  4. To ensure that the interests of the clients would be protected and objectivity of the Analysis would not be damaged Admiral Markets has established relevant internal procedures for prevention and management of conflicts of interest.
  5. Whilst every reasonable effort is taken to ensure that all sources of the Analysis are reliable and that all information is presented, as much as possible, in an understandable, timely, precise and complete manner, Admiral Markets does not guarantee the accuracy or completeness of any information contained within the Analysis. The presented figures refer that refer to any past performance is not a reliable indicator of future results.
  6. The contents of the Analysis should not be construed as an express or implied promise, guarantee or implication by Admiral Markets that the client shall profit from the strategies therein or that losses in connection therewith may or shall be limited.
  7. Any kind of previous or modeled performance of financial instruments indicated within the Publication should not be construed as an express or implied promise, guarantee or implication by Admiral Markets for any future performance. The value of the financial instrument may both increase and decrease and the preservation of the asset value is not guaranteed.
  8. The projections included in the Analysis may be subject to additional fees, taxes or other charges, depending on the subject of the Publication. The price list applicable to the services provided by Admiral Markets is publicly available from the website of Admiral Markets.
  9. Leveraged products (including contracts for difference) are speculative in nature and may result in losses or profit. Before you start trading, you should make sure that you understand all the risks.

By Admiral Markets

Long-Term Predictive Software Suggests Volatility May Surge

By TheTechnicalTraders.com

Over the past few weeks and months, a number of key economic data has continued to rally the US major indexes towards new highs, hopes of a US/China trade deal, a continued shift of capital in the US markets for protection and safety, and moderately strong US economic indicators and an earning season that appears to be moderately strong for Q3 of 2019.  The interesting facet of this move higher is that it is happening while trading volume has diminished dramatically in the SPY.  The futures contracts, the ES, YM, and NQ, continue to show relatively strong volume activity though.

Additionally, the overnight Repo markets have risen to the attention of many skilled analysts.  The concern is that the continued US Fed support of the overnight Repo facility may be a band-aid attempt to support a gaping credit crisis that is brewing just outside of view.  We’ve been doing quite a bit of research over the past few weeks regarding this Repo market support by the US Fed and we believe there is more to it than many believe.  We believe certain institutional banking firms may be at extreme risks related to derivative investments, shadow banking activities and/or global commodity/stock/currency/asset risk exposure.  The only answer we have for the extended Repo facility at increasing levels is that the institutional banking system is starting to “fray around the edges”.  Thus, we believe some larger credit risk problems may be just around the corner.

Our longer-term analysis continues to suggest that “all is fine – until it is not”.  Our belief that a capital shift that has been taking place over the past 5+ years where foreign capital continues to pour into the US markets is driving US stock market prices higher.  There is evidence that the capital shift into the US has slowed over the past 5+ months, yet one would not notice this by looking at these longer-term charts.  The point we are trying to make today is that price peaks near current highs have, historically, been met with strong resistance and collapsed by 8 to 15% on average.

SP500 Index – 2 Month Long Term Chart

This ES 2 Month chart highlights the resistance channel initiated near the 2003 lows (the lower YELLOW price channel line) and how that level has continued to act as moderate price resistance throughout most of 2017, 2018 and 2019.  We believe that price, at current levels, must either rally above this level and be capable of sustaining higher price levels (which would be supported by stronger forward guidance, earnings, economic data and/or investments), or will attempt to rotate lower from these current highs because price is simply unable to support/sustain higher price levels given the current global economic data.

When we attempt to rationalize the potential for price given the Repo issues, the current global economic data/news, the uncertainty of a US Presidential election cycle only 12 months away, the BREXIT deal hanging out in the near future and recent currency rotations, we believe is transitional shift is taking place in the markets in preparation for some type of surge in volatility associated with a very strong potential for extended price rotation.

NASDAQ 2 Week Chart – Adaptive Dynamic Learning (ADL)

Our Adaptive Dynamic Learning (ADL) price modeling system on this NQ 2-Week chart highlights what the ADL system suggests as a moderate price rotation setting up over the next 2 to 8+ weeks.  This data originates on August 5, 2019, and the alignment of the future predicted price levels (the DASHES) on this chart shows how accurate the ADL future price predictions have been over the past 3+ months.  Currently, the ADL predictive modeling system is suggesting a price reversion is about to take place in the NQ where price may fall 10 to 15% over the next 2 to 6+ weeks.  Then, the price will attempt to set up a momentum base and begin to move higher near the end of 2019 or early into 2020.

DOW 2 Week Chart – Adaptive Dynamic Learning (ADL)

This YM 2-Week chart showing the same type of ADL predicted price levels suggests the YM may also see some type of price reversion, yet the size of this reversion is much smaller than the NQ.  The ADL predictive modeling system is suggesting the YM may rotate to levels near 26,000 or lower before finding immediate support and attempting a renewed rally back to levels near 27,000.

Concluding Thoughts:

What this suggests is that the NASDAQ and S&P500 may become much more volatile than the Dow Jones index over the next 2 to 6+ weeks.  Volatility may surge on a reversion move in the ES and NQ over the next few months while the YM remains rather calm comparatively.  Skilled traders must understand that subtle risks are starting to show throughout the global markets.  Foreign markets are starting to show signs of extended contraction – China and Asia in particular.  The situation in Europe and with the Euro are open to interpretation.  Our opinion is that risk levels have already exceeded a comfort level in this arena.

Should some event take place where the global banking system and/or Repo market continue to attempt to take up the slack – traders will become even more concerned that “something is broken” and could pull massive amounts of capital out of the markets fairly quickly.  If this happens when volume and volatility are very low, we have a situation where simple price exploration could present a real problem (think FLASH CRASH).

Skilled traders need to stay very cautious near these new highs.  We may see a surge in volatility over the next few weeks unless the markets are able to settle the concerns raised by analysts and others.  Headed into the end of 2019, into a contentious US presidential election cycle and with obvious signs that something may be breaking in the global banking system, now is the time to protect and prepare for the unknown.  We can’t make this any clearer – consider this a warning alert from TheTechnicalTraders.com.


EURUSD: Markets await US GDP and the results of the FOMC meeting

By Alpari.com

On Tuesday the 29th of October, trading on the euro closed up. Bearish sentiment switched to bullish at 1.1074. There are several factors that may have sparked this growth:

  • All governments of EU member states ratified the Brexit extension.
  • Leader of the opposition Labour Party in the UK, Jeremy Corbyn, has said the party will back a general election in December given that the UK can no longer exit the EU without a deal.
  • The S&P 500 index reached a new all-time high. Investors expect progress to be made in the US-China trade talks, which had a positive effect on riskier assets.

Day’s news (GMT+3):

  • 12:00 Switzerland: ZEW survey – expectations (Oct).
  • 13:00 Eurozone: business climate (Oct).
  • 15:15 US: ADP employment change (Oct).
  • 15:30 US: GDP (Q3).
  • 16:00 Germany: harmonised index of consumer prices (Oct).
  • 17:00 Canada: BoC interest rate decision and statement, BoC monetary policy report.
  • 18:15 Canada: BoC press conference.
  • 21:00 US: Fed interest rate decision, Fed’s monetary policy statement.
  • 21:30 US: FOMC press conference.

EURUSD H1Current situation:

Yesterday didn’t end as expected. The market fell victim to the fundamentals. After the breakout of the trend line by the upwards correction from 1.1073 (25/10/19), the euro dropped to 1.1074. The recovery to the trend line killed any hopes of a decline to 1.1067. In the end, the pair rose to 1.1118.

Key facts:

  • The bulls have broken the upper line of the channel.
  • The rise above 1.1107 (the high between the two lows of 1.1073 and 1.1074) has confirmed a double base model.

There’s plenty going on in today’s economic events calendar. The biggest highlights of the day are the meetings of the Bank of Canada and FOMC, as well as US GDP figures for Q3 and Jerome Powell’s speech. The BoC is expected to keep rates at their current level, while we expect the Fed to reduce interest rates by 25 base points. Since a rate reduction has already been factored in by the market, if it does happen, attention will immediately turn towards the FOMC press conference. GDP is expected to decline from 2% to 1.6%. These figures will be released at 15:30 (EET), so expect some increased volatility ahead of the FOMC meeting.

When there are important events in the calendar to which the reactions can’t be reasonably predicted, we prefer not to predict any price movements. Judging by yesterday’s movements, the bulls can now set their sights on 1.1163.

By Alpari.com

The Analytical Overview of the Main Currency Pairs on 2019.10.30

by JustForex

The EUR/USD currency pair

Technical indicators of the currency pair:
  • Prev Open: 1.11003
  • Open: 1.11003
  • % chg. over the last day: +0.11
  • Day’s range: 1.11065 – 1.11153
  • 52 wk range: 1.0884 – 1.1623

Greenback is stable against other world currencies. Investors took a wait and see attitude before today’s Fed meeting. Most participants in financial markets expect the regulator to reduce the range of key interest rates by 25 basis points to 1.50-1.75%. We recommend that you pay attention to the comments and rhetoric of representatives of the Central Bank, which may signal the further pace of monetary policy adjustment. A number of important economic releases will also be published today. At the moment, EUR/USD quotes are consolidating in the range of 1.11000-1.11200. Open positions from the key levels.

The Economic News Feed for 30.10.2019:

  • – Labour Market Report (GER) – 10:55 (GMT+2:00);
  • – ADP Nonfarm Employment Change (US) – 14:15 (GMT+2:00);
  • – Preliminary GDP Report (US) – 14:30 (GMT+2:00);
  • – Fed Interest Rate Announcement (US) – 20:00 (GMT+2:00);
EUR/USD

Indicators do not give accurate signals: 50 MA began to cross 100 MA.

The MACD histogram has moved into the positive zone, indicating a bullish sentiment.

The Stochastic Oscillator is in the neutral zone, the %K line is above the %D line, which gives a signal to buy EUR/USD.

Trading recommendations
  • Support levels: 1.11000, 1.10750, 1.10450
  • Resistance levels: 1.11200, 1.11500, 1.11750

If the price consolidates above 1.11200, expect a rise toward 1.11500-1.11700.

Alternatively, the quotes could decrease toward 1.10700-1.10500.

The GBP/USD currency pair

Technical indicators of the currency pair:
  • Prev Open: 1.28601
  • Open: 1.28656
  • % chg. over the last day: +0.03
  • Day’s range: 1.28582 – 1.28828
  • 52 wk range: 1.1959 – 1.3385

The technical pattern on the GBP/USD currency pair is still ambiguous. GBP continues to trade in a flat. At the moment, the local support and resistance levels are 1.28450 and 1.29000, respectively. Participants in the financial markets are waiting for the Fed meeting. We also recommend keeping track of up-to-date information regarding the Brexit process. GBP/USD quotes have the potential for correction. Open positions from key levels.

The Economic News Feed for 30.10.2019 is calm.

GBP/USD

Indicators do not give accurate signals, 50 MA has crossed 100 MA.

The MACD histogram is in the positive zone, which points to a bullish sentiment.

The Stochastic Oscillator is in the positive zone, the %K line is above the %D line which also points to a bullish sentiment.

Trading recommendations
  • Support levels: 1.28450, 1.28000, 1.27600
  • Resistance levels: 1.29000, 1.29450, 1.30000

If the price consolidates below the support level of 1.28450, expect the quotes to fall toward 1.28000-1.27800.

Alternatively, the quotes can grow toward 1.29400-1.29600.

The USD/CAD currency pair

Technical indicators of the currency pair:
  • Prev Open: 1.30549
  • Open: 1.30871
  • % chg. over the last day: +0.31
  • Day’s range: 1.30804 – 1.30955
  • 52 wk range: 1.2727 – 1.3664

The USD/CAD has moved up. The trading tool has updated local highs. CAD is currently consolidating in the range of 1.30750-1.31000. Investors took a wait and see attitude before the meetings of the Bank of Canada and the Fed. It is expected that the Central Bank of Canada will maintain the basic parameters of monetary policy at the same level. We recommend you to pay attention to the comments and rhetoric of representatives of regulators. Open positions from key levels.

The Bank of Canada will announce their interest rate at 16:00 (GMT+2:00).

USD/CAD

The signals of the indicators are indecisive. The price has fixed above 100 MA, which signals the power of buyers.

The MACD histogram is in the positive zone, but below the signal line, which gives a weak signal to buy USD/CAD.

The Stochastic Oscillator is in the neutral zone, the %K line is below the %D line, which indicates a bearish sentiment.

Trading recommendations
  • Support levels: 1.30750, 1.30500, 1.30200
  • Resistance levels: 1.31000, 1.31200, 1.31450

If the price consolidates above the round level of 1.31000, expect a further correction toward 1.31300-1.31500.

Alternatively, expect the quotes to descend toward 1.30500-1.30300.

The USD/JPY currency pair

Technical indicators of the currency pair:
  • Prev Open: 108.982
  • Open: 108.866
  • % chg. over the last day: -0.04
  • Day’s range: 108.810 – 108.888
  • 52 wk range: 104.97 – 114.56

The USD/JPY currency pair has stabilized. The trading instrument is currently consolidating. The local support and resistance levels are 108.800 and 109.000, respectively. Investors are waiting for the Fed meeting. We also recommend that you keep track of up-to-date information regarding the settlement of the trade conflict between Washington and Beijing. Open positions from key levels.

During the Asian trading session, Japan published an optimistic report on the retail sales.

USD/JPY

Indicators do not give accurate signals: the price crossed 50 MA and 100 MA.

The MACD histogram has moved to the negative zone, indicating a bearish sentiment.

The Stochastic Oscillator is in the neutral zone, the %K line crossed the %D line. There are no signals at the moment.

Trading recommendations
  • Support levels: 108.800, 108.650, 108.500
  • Resistance levels: 109.000, 109.300, 109.500

If the price consolidates above the round level of 109,000, expect further growth toward 109.200-109.500.

Alternatively, the quotes could decrease toward 108.650-108.400.

by JustForex

FOMC: Rate Cut Almost Certain

By Orbex

The Federal Reserve Bank will be holding its monetary policy meeting this Wednesday.

The central bank is widely expected to deliver another quarter-point rate cut at this week’s meeting.

However, not everything is set in stone. Despite the CME Group’s Fed Watch tool assigning a > 90% probability, there is still scope for the Fed to disappoint.

The expectations for another rate cut come amid softening growth in the labor market and the US economy itself.

The central bank has cut interest rates two times this year in July and September and the Fed funds rate currently stands at 1.75% – 2.00%. Many investors are betting on another rate cut.

Fed funds rate

Among those include US President Trump who has been repeatedly calling for the Fed to lower rates and restart the central bank’s QE program.

If the Fed follows through with today’s rate cut, it would echo similar policy moves in 1998. Back then, the central bank delivered three rate cuts amid an expanding economy. The central bank signaled that it was done with cutting rates after the third rate cut.

However, it is unlikely to expect similar moves from the Fed this time.

FOMC – What Members Think?

The following is a summary of comments from various FOMC members in the run-up to the blackout period.

Boston Fed President Eric Rosengren maintains that there is no need for further rate cuts. Rosengren, a hawk among the FOMC members recently renewed his case against lowering rates.

According to the Boston Fed, the current low rates are more than enough to address the risks to the economy. He said that the US economy remains in a good shape and that further rate cuts are not required.

However, Kashkari, who is not an FOMC voting member said that he would support a rate cut. His comments come amid concerns that the job market was softening.

Loretta Mester, Cleveland Fed President was on the side of a wait and see approach. While supporting the rate cut in July, Mester said that she would prefer to wait and assess more data before supporting a rate cut.

Other doves on the FOMC include St Louis Fed president Bullard. Bullard said that he and his colleagues should think about cutting interest rates. The rate cuts, he said, were required in order to guard against the threats to the economy such as China.

Similar (dovish) views were also expressed by Chicago Fed president, Charles Evans, while vice chairman, Richard Clarida was more diplomatic, answering that the Fed will act appropriately.

Clarida was one of the final members to speak before the start of the blackout period.

Fed’s Forward Guidance

Today’s monetary policy meeting will also include a press conference by Fed chair Jerome Powell. Investors will be closely watching his comments.

The FOMC meeting comes a few hours after the advance GDP report comes out. The US economy is widely tipped to grow at a < 2% GDP growth rate in the three months of September 2019.

This comes at a time when the US labor market, considered one of the strong pillars of growth, is starting to show signs of softening. Meanwhile, manufacturing activity in the United States is contracting for the past two months.

Considering the above, it is quite likely to see a rate cut today. However, the Fed’s forward guidance will matter. Question is whether the central bank is done with rate cuts for the remainder of the year, or will there be another rate cut by December.

By Orbex