PGE Projects in Brownfields of Montana and Yukon Raise Expectations for Junior Miner

By The Gold Report

Source: Maurice Jackson for Streetwise Reports   10/29/2019

Recent developments on several of this North American explorer’s prospects are discussed in an interview with Maurice Jackson of Proven and Probable.

Maurice Jackson: Joining us today is Michael Rowley, president and CEO of Group Ten Metals Inc. (PGE:TSX.V; PGEZF:OTCQB; 5D32:FSE), which is known for platinum, palladium, nickel, copper and cobalt in the Stillwater district in Montana.

Sir, we have more exciting news coming from Group Ten Metals’ flagship Stillwater West project, which is becoming recognized for both the scale and grade of its mineralization. Your current exploration and drilling campaign has been in progress for two months now, with numerous holes completed. But before we get to that, Mr. Rowley, please introduce Group Ten Metals and the opportunity the company presents to the market.

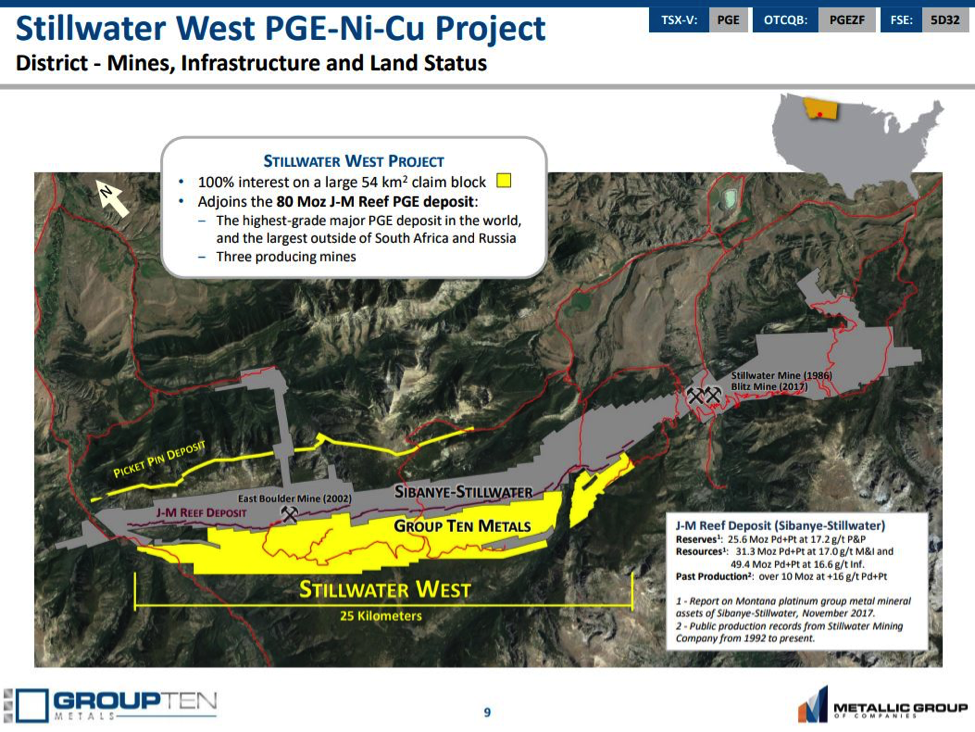
Michael, I have a map displaying Group Ten Metals flagship Stillwater West project. I believe it’s paramount for [readers] to understand the strategic advantage Group Ten Metals has over many of its peers, and that is brownfields exploration, which is a term that the lay investor may not appreciate. How does Group Ten Metals’ brownfields exploration benefit current and prospective shareholders?

Michael Rowley: The term brownfields means operating in a proven mining district, which is distinct from exploring a greenfields district, which has no existing mineral deposits or mines, and may be remote with no infrastructure. The Stillwater West project is a great example of a brownfields asset as it adjoins three operating mines that are among the very best of their kind in the world, in a district that is known to be rich in minerals. We share that geology, we benefit from all that infrastructure, and we have an extensive database with known mineralization zones to expand upon. The result is greatly increased probability of success, and greatly reduced capital expenditures when it comes time to potentially build a mine.

Maurice Jackson: Let’s talk a little about the uniqueness of the Stillwater West asset and what that means for investors. There are very few projects like this globally, so to be developing one in North America in a brownfields setting is a rather compelling story. Tell us about that if you will.

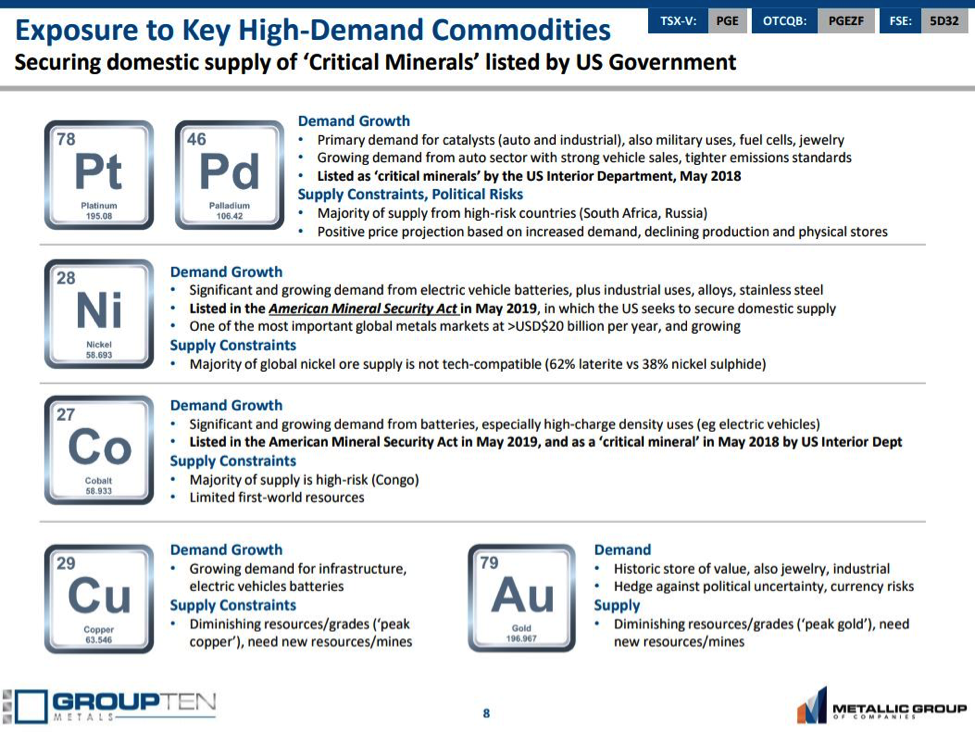
Michael Rowley: It’s the size potential of Stillwater West that is truly impressive; it is rare for a junior to have literally half of such an iconic and productive district, in any commodity. It’s also location and timing; we are one of few exploration plays outside of South Africa and Russia that are focused on palladium, platinum and rhodium, and we have terrific potential for nickel and cobalt at a time when the U.S. is looking to secure domestic supplies of these commodities. Palladium and nickel are top performing commodities, and platinum is expected to follow with continued mine closures in South Africa. So, in broad strokes, there are very few assets of this type in the world, and in North America they are practically unheard of. The closest analogs in terms of geology are the Platreef mines in the Bushveld Complex in South Africa.

Maurice Jackson: For the readers not familiar with either the Bushveld or Stillwater regions, what can you share with us about the parallels between the two, with reference to your neighbor to the North?

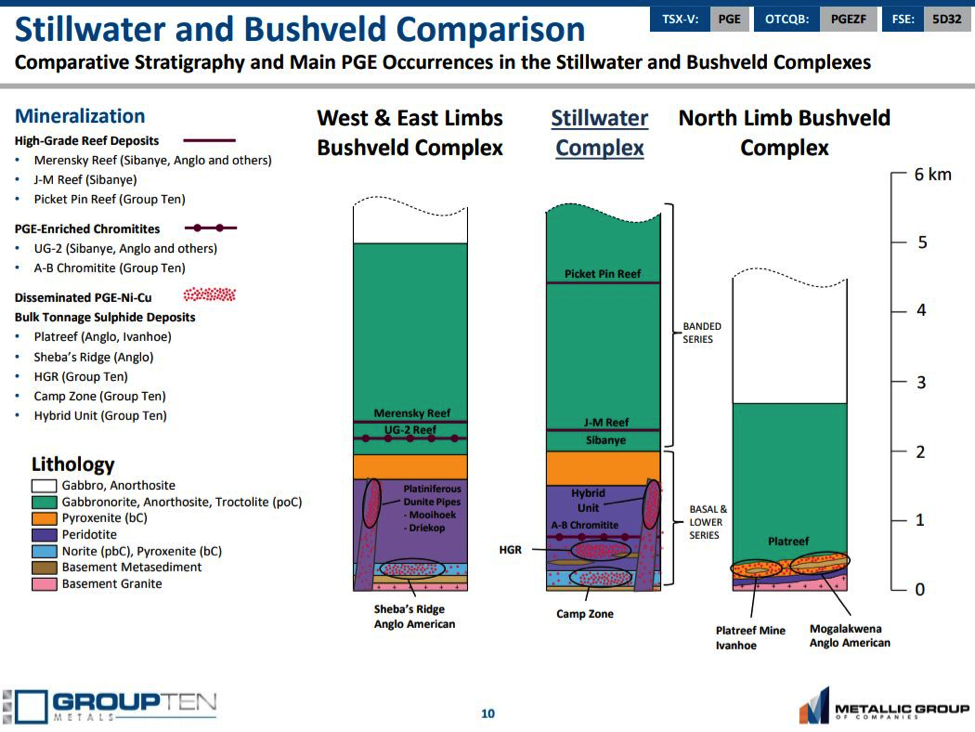
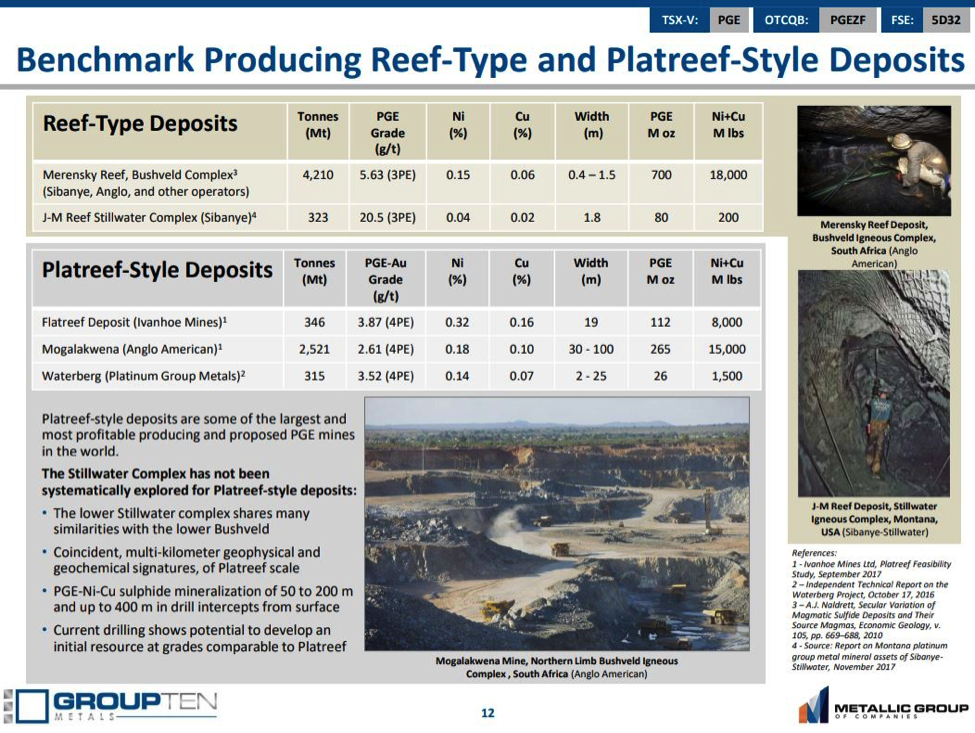
Michael Rowley: The Bushveld and Stillwater complexes are both magmatic intrusions. Magmatic deposits give us give us essentially all our ‘battery grade’ sulfide nickel globally, and they may also have a number of other commodities including copper, cobalt, gold and platinum group metals. Voiseys Bay is a magmatic deposit, for example, and it is one that happens to be very rich in nickel and copper, but has very low platinum group elements (PGEs).

The Bushveld and Stillwater complexes are both layered magmatic systems, a subcategory of the bigger picture of magmatic deposits. They are quite similar; Bushveld is about 2 billion years old; Stillwater is about 2.7 billion years old. Both are rich in platinum group elements plus nickel and copper, and both were created when metal-rich magma was laid down, layer after layer, and allowed to cool, slowly, deep underground. That cooling action creates the narrow Reef-type mines that are now in production in the upper portion of the layers in both districts. In the lower portion, the layering stops and larger magma events occur, with mixing of magma and host rock. That is where these larger deposits occur, with mineable widths of tens to hundreds of meters across kilometers of strike length. That is what we are calling ‘Platreef-style’ deposits, named for the Platreef district of the Bushveld complex.

The Platreef district is some of the richest real estate in all of mining, with over 400 million ounces (400 Moz) of platinum group elements plus gold, plus tens of billions of pounds of nickel and copper.

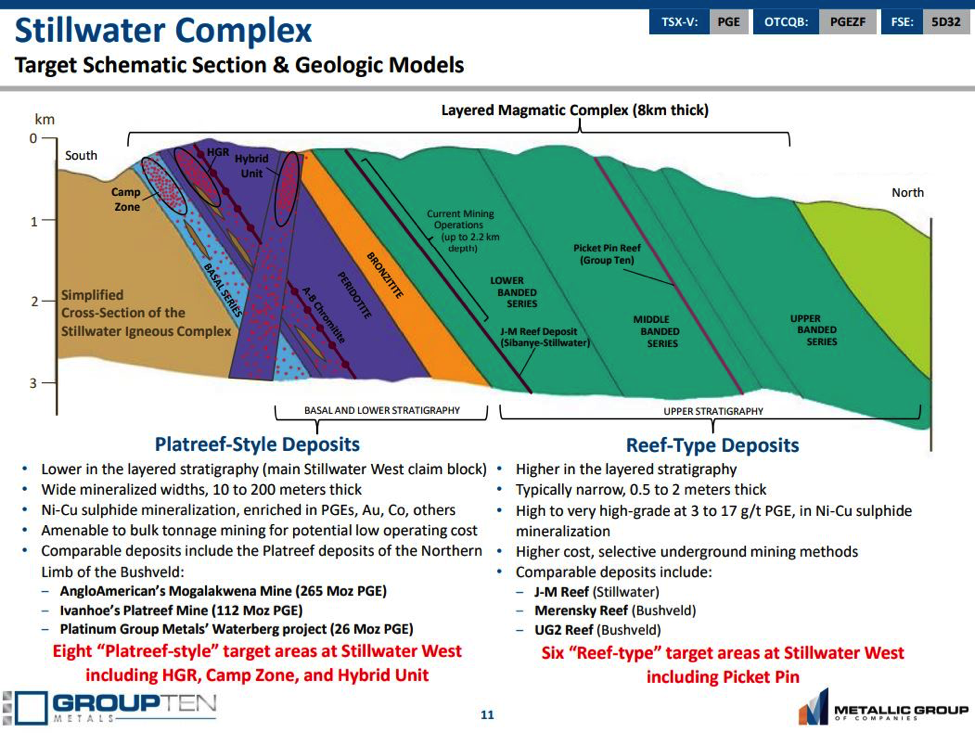
They are actively mining both the narrow ‘reef-type’ mines and the bulk minable ‘Platreef’-type mines now at the Bushveld. Much of the world’s platinum now comes from the reef-type mines, however they are deep, hot, dangerous, and have been underfunded for many years now. Closures are ongoing, and continued closures are expected to drive the platinum price in the coming year. The mines of the Platreef district, by contrast, are highly economic and produce platinum (Pt) at less than $400/ounce ($400/oz), plus palladium (Pd), nickel, copper and other commodities.

At Stillwater, in the Stillwater district, a company called Sibanye-Stillwater is actively mining one reef-type deposit with three underground mines operating some hundreds of meters to the north of our main claim block. That deposit is the highest-grade PGE deposit in the world, with more than 80 Moz at over 16 g/t Pd+Pt. Sibanye Gold Ltd. (SBGL:NYSE) purchased the Stillwater mines just two years ago for $2.2 billion and has since emerged as the world’s largest platinum producer.

Group Ten was the first group to consolidate the land package and database to enable a systematic approach to exploration for massive ‘Platreef-style’ deposits at Stillwater. Our early work, starting in 2017, attracted a highly qualified team and quickly showed the potential of the project based on a remarkable database. Our first ground programs expanded on that, in 2018, and that further confirmed the potential for remarkable scale across the 25-kilometer wide property. Now, in 2019, we are completing our first drill program at priority target areas and I’m pleased to report that the geologic model is holding up very nicely.

Maurice Jackson: We covered some good basics; let’s find out what Group Ten Metals has discovered since our last interview. The company issued a press release last week providing an exploration update including drilling progress on the company’s flagship Stillwater West Project in Montana. Mr. Rowley, take us behind the scenes and share the stated goals of the 2019 exploration campaign.

Michael Rowley: 2019 has been a break-out year for us, starting with our debut at the trade shows back in February, where we displayed historic core for the first time to introduce the application of these new geologic models to the Stillwater district, and that culminates with our first drill program at Stillwater West.

Our 2019 exploration program is our biggest yet, and it has several objectives. We are conducting ground-based geological sampling and mapping programs to advance less advanced target areas to drill-ready status for next year, and we are completing soil mapping across the western portion of the property—a huge area—to advance targets in those areas for next year, as soils have been a very effective tool on the eastern 15-kilometer width of the property.

We are also drill testing the three most advanced target areas, and the drill programs in these areas have been designed to provide a proof-of-concept of the Platreef setting while also advancing mineralized zones toward formal mineral resources. We have over 28,000 meters of drilling in the database, and eight Platreef-style target areas in total. Five of those have sufficient past drilling and show enough continuity of mineralization that we can work up a geological block model as a starting point for those mineral resources. This year, we’ve focused initially on the three most advanced areas and expect to move those quickly forward toward formal mineral resources of platinum, palladium, nickel, copper and cobalt. We have essentially all the core from the 2000s-era work in our possession, and we have relogged it and assayed it, sometimes for the first time, as necessary, with the new geologic model in mind. The older data, mostly drilling from the 1960s and 1970s, was primarily assayed for nickel and copper only, so we are redrilling those areas, as necessary, to bring those holes into a NI43-101-compliant resource with complete suite of assay data to go along with it.

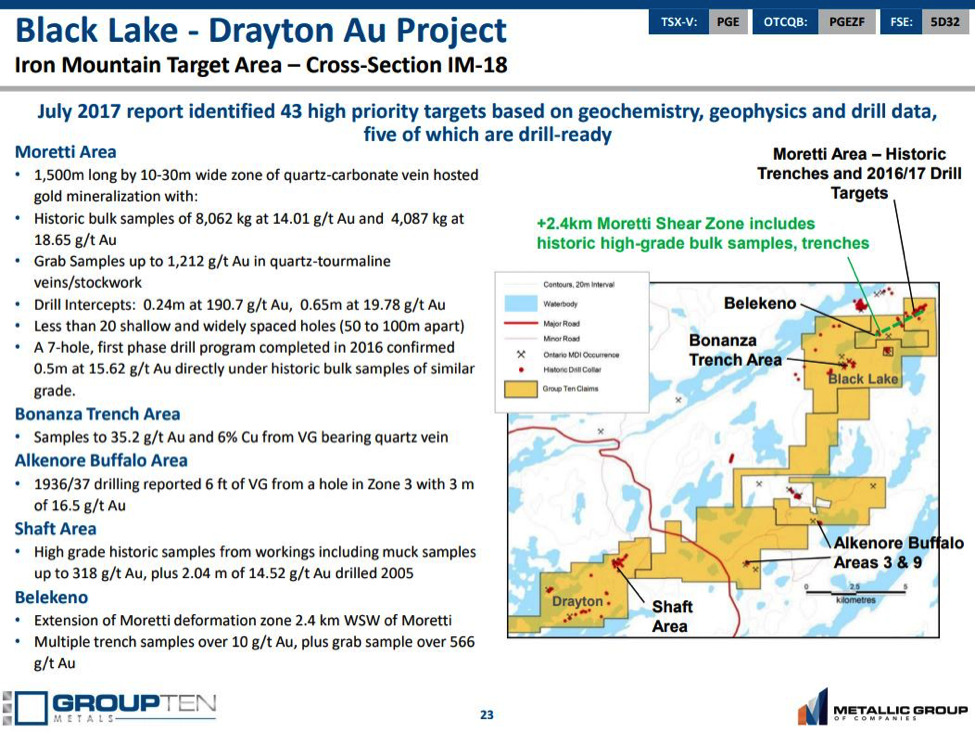
Maurice Jackson: We touched on Platreef and bulk tonnage. Let’s visit the Iron Mountain Target Area, where the company has been active recently. What can you share with us?

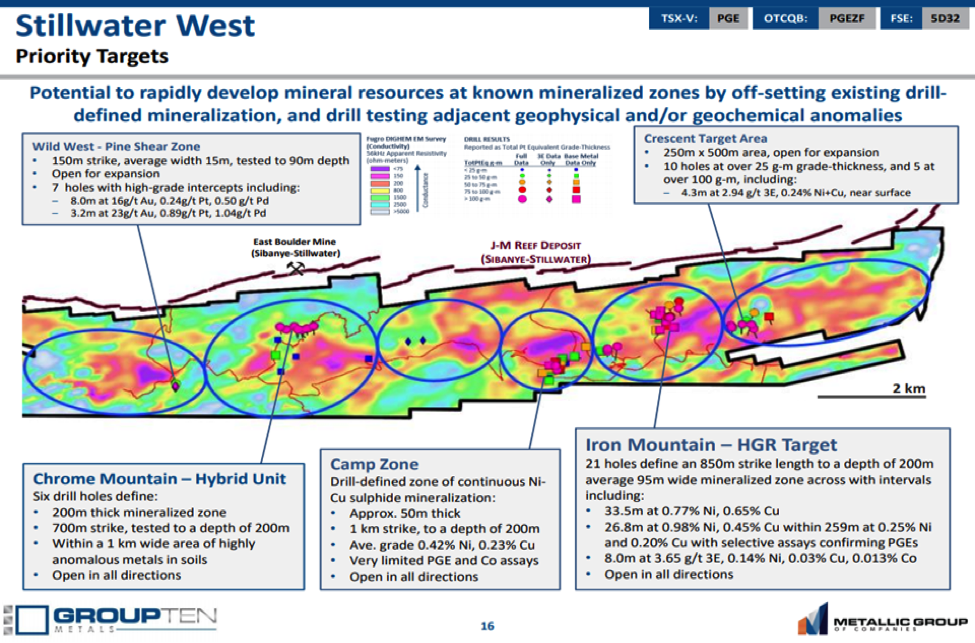
Michael Rowley: Iron Mountain is the most advanced of the eight Platreef-style target areas on the project. It has a mineralized zone defined by 21 past drill holes. It is open for expansion, within a multi-kilometer, conductive, high anomaly and has soils that are lighting up with palladium, platinum, gold, copper (Cu), nickel (Ni) and cobalt (Co) across a similar kilometric-scale area. In our block model work to date, these 21 past drill holes define a mineralized zone that is 850-meter (850m) strike length to a depth of 200m at an average width of 95m. Drill intervals in that mineralized zone include 26.8m at 0.98% Ni and 0.45% Cu. That entire hole was mineralized top to bottom, with 259m running 0.25% Ni and 0.20% Cu, which is remarkable. Another similar hole within about 100m returned 33.5m at 0.77% Ni and 0.65% Cu.

Those holes were drilled in the 1960s and ’70s, and have very limited precious metal assay data, although we do have selective assay results running up to 2.7 g/t palladium, which is very encouraging.

Also, in that area, we have a hole drilled in 2002 that has complete assay data, which reports 8.0m starting right at surface with 3.65 g/t 3E, 0.14% Ni, 0.03% Cu, and 0.013% Co. These are very attractive grades, and they are over an 8-meter width.

So, compare that to our target, the mines of the Platreef, in South Africa. Ivanhoe Mines Ltd. (IVN:TSX; IVPAF:OTCQX) and Anglo American Platinum Ltd. (AMS:JSE) are running 0.2 to 0.4% combined nickel and copper, with several grams of precious metals on top of that, across tens to hundreds of meters in width and kilometers in strike length. It is early days, but our results from Iron Mountain are right in line with those numbers in terms of grade and the potential for scale.

Iron Mountain also shows good rhodium results, which is timely these days, with rhodium almost $5,000 an ounce. We had one rock sample that returned almost 6 g/t rhodium, which I don’t recall seeing in exploration results from other companies.

Maurice Jackson: Group Ten Metals was active on two more target areas. Take us to the Camp Zone Target Area and provide us with an update.

Michael Rowley: Like Iron Mountain, the Camp Zone target area includes a drill-defined zone of continuous Ni-Cu sulphide mineralization that we expect to quickly move to a formal resource through our work this year. Again, we have untested conductive highs that are kilometric in scale, with coincident, highly elevated levels of precious and battery metals shown in the soil survey, across a similar length.

Known mineralization at Camp Zone is about 50m thick and runs about 1 km in strike, with an average grade of 0.42% Ni and 0.23% Cu, which is very high relative to Platreef grades. Like Iron Mountain, we have very limited PGE, gold (Au) and Co assays in the older holes, but have good indications where we do have data for those commodities.

Like Iron Mountain, it is open in all directions and had been tested to just 200 meters depth at Camp Zone. This year’s program went deeper than that to identify new zones, and will add complete assay data, as well as working to bring older data into a modern resource estimate.

Maurice Jackson: Before we leave the Stillwater West, take us to the Chrome Mountain Target Area and update on the latest developments there.

Michael Rowley: Much of the interest at Chrome Mountain, to date, has centered on the Hybrid Unit, which appears to be a later magmatic event from much of the rest of the lower Stillwater Complex. It may be what is known as an intrusive dunite pipe. . .which gets very interesting because some of the earliest and highest-grade PGE mines in the Bushveld were of this type.

To date, the Hybrid Unit is defined by ten drill holes that delineate a 200m-thick mineralized zone across 700m of strike. Entire holes are mineralized, top to bottom, with 100- and 200-meter intervals, and more, grading 1, even 2, g/t Pt-equivalent, including base metals at up to Platreef grades. To date, the target has been tested to a depth of 200m and it sits within a 1 km wide area of highly anomalous metals in soils. Like Camp Zone and Iron Mountain, it is open for expansion in all directions and our work this year will be moving that along nicely.

Maurice Jackson: You have other assets. Would you care to touch on those for our audience?

Michael Rowley: We were strategically acquiring brownfields mineral properties throughout the recent bear market cycle, so we’ve been able to acquire 100% interests in some remarkable land positions.

In Ontario, we own the Black Lake Drayton gold project, which shares geology with the adjoining Goldlund and Goliath projects, owned by First Mining Gold Corp. (FF:TSX) and Treasury Metals Inc. (TML:TSX: TSRMF:OTCBB), respectively. There’s almost 4M high-grade ounces of gold in those assets alone, and that figure climbs over 10Moz in the broader Rainy River belt that they’re all part of. We have low carrying costs on the asset and, when the time is right, we’ll do a deal based on the fact that we have over 30 km of highly prospective strike in a neighborhood that, in our opinion, must be a consolidation target for a major operator.

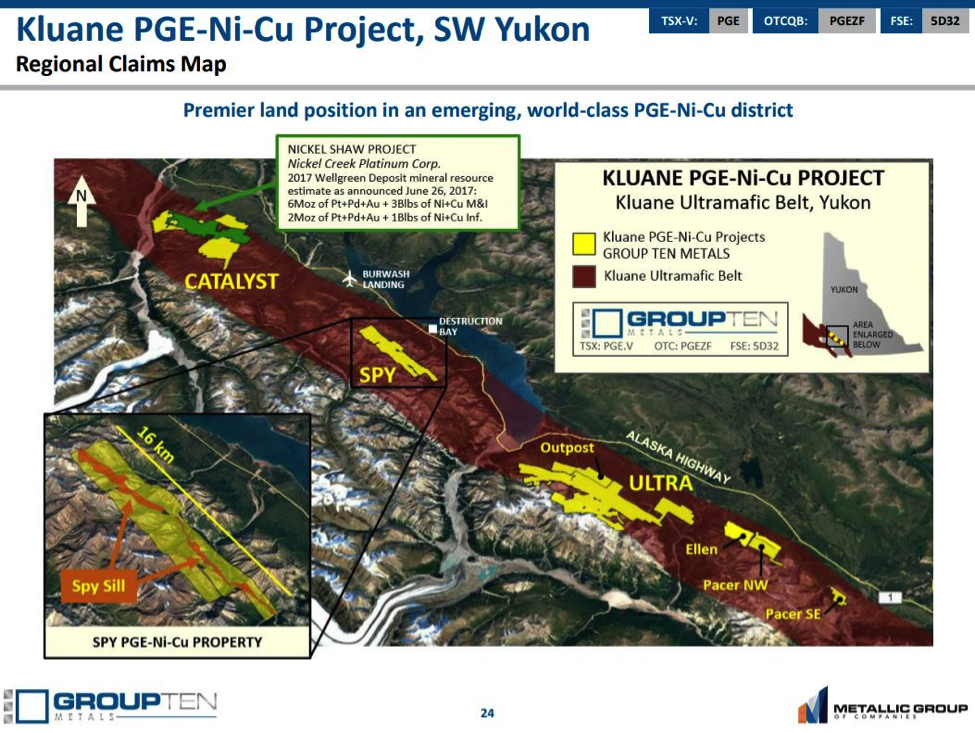
Turning back to black rocks and PGE-Ni-Cu projects, we were also active in consolidating the largest land position in the Kluane Ultramafic Belt, in the Yukon Territory. This is highly prospective ground adjoining, and on strike with, the Wellgreen deposit, which one of the largest undeveloped PGE-Ni-Cu deposits in the world.

It’s worth noting that back in July of this year we announced an earn-in deal by which Mount Cairnes Resources can earn a 51% interest in our Ultra project, which is part of the overall Kluane package, by completing cash payments totaling $750,000, issuing three million shares to Group Ten, and completing $3.75 million in work over four years to earn that 51% interest in the Ultra project. That deal speaks to the value of the assets we have acquired through the bear market years, and we expect to complete more like it as part of our focus on Stillwater.

Maurice Jackson: Mr. Rowley, please provide us with an update on the capital structure of Group Ten Metals.

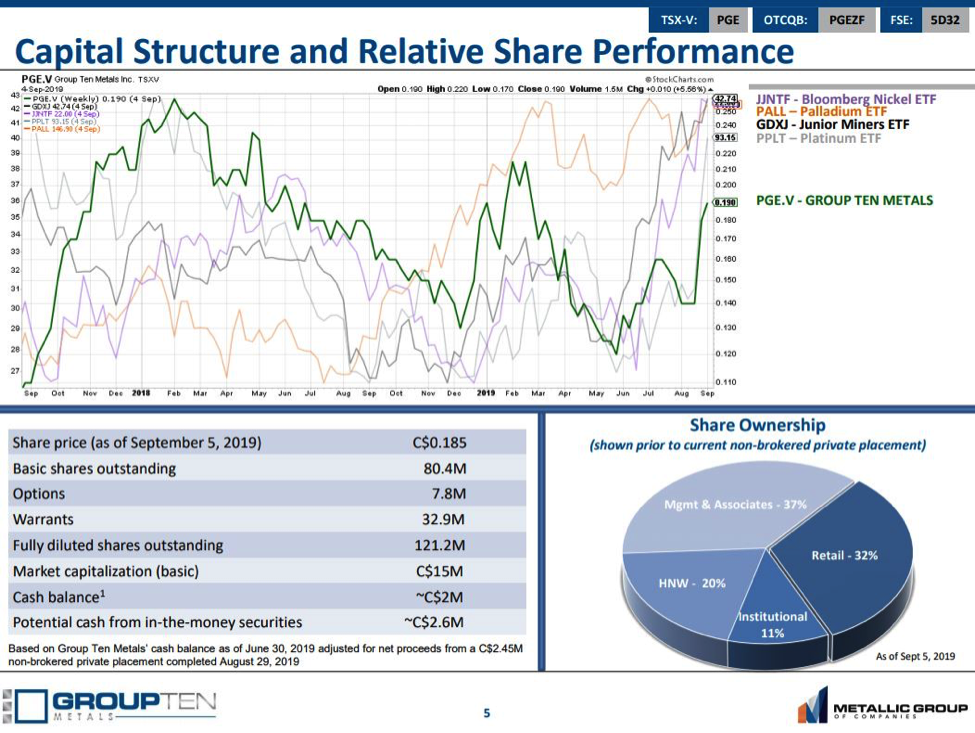
Michael Rowley: We currently have a market cap of about $13M, with about 80M shares outstanding. And that follows a private placement we completed in August where we raised $2.45M at $0.14/share.

Maurice Jackson: In our last interview, you made reference to warrants that may be exercised, providing the company an additional $2.4 million in working capital. Do you have an update for us?

Michael Rowley: Exercises are ongoing, and we’re glad to see that. They are presently in the money and they are coming in, and that provides the company with additional funds for exploration and promotion.

Maurice Jackson: In closing, sir what is the next unanswered question for Group Ten Metals? When should we expect results, and what determines success?

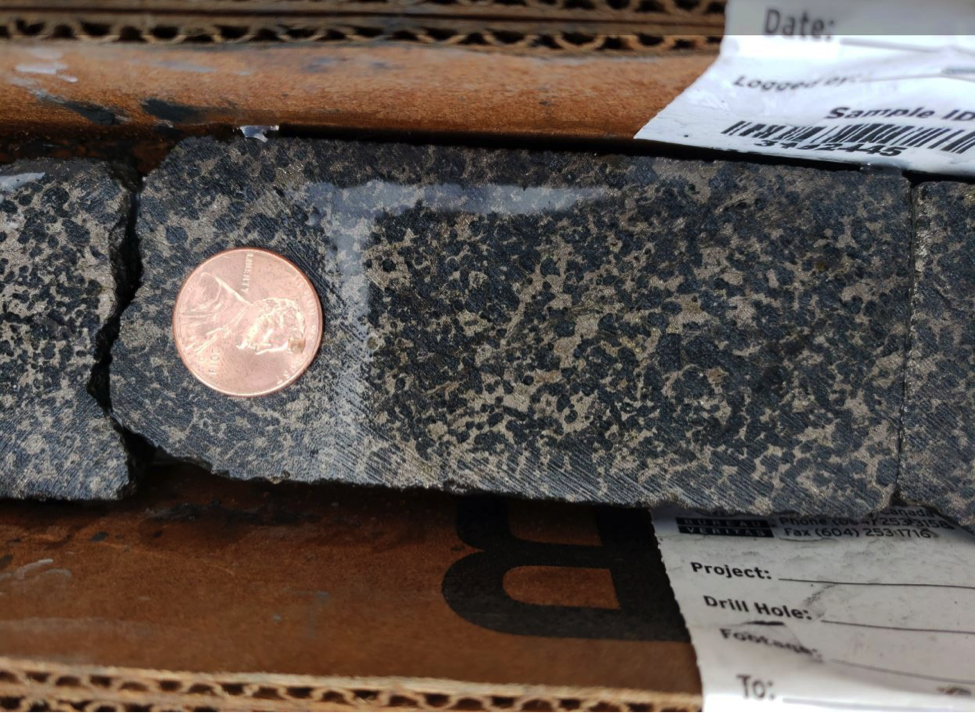
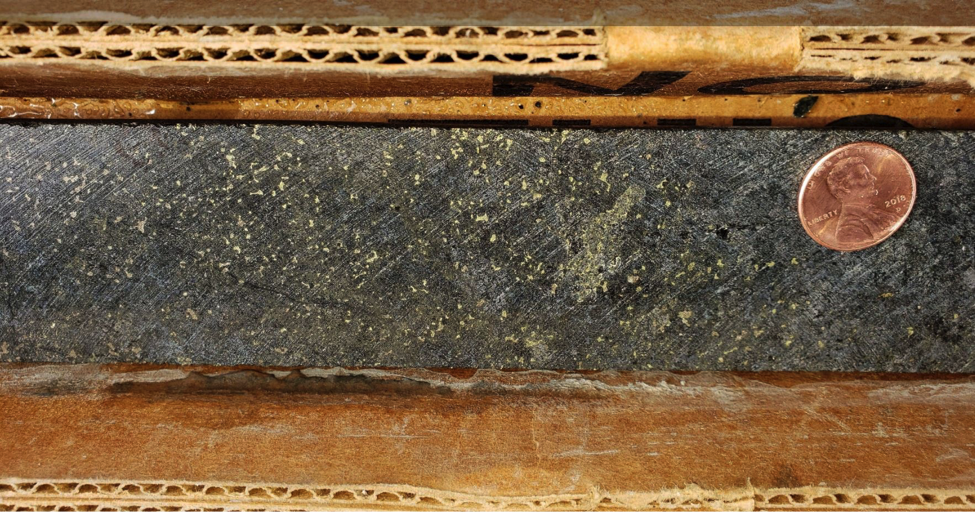
Michael Rowley: Assay results from our 2019 programs are one major driver that is expected in the coming weeks and months. This year’s program returned some really encouraging visual sulfide mineralization, as shown in some pictures we posted a few weeks ago. That core has gone to the lab and those results will be out in the coming weeks as they become available. We’re excited about that.

In addition, we will be working hard updating our block model at our flagship Stillwater West project. We continue to get real interest in our non-core assets and will be announcing deals on those as they get done.

Maurice Jackson: What keeps you up at night that we don’t know about?

Michael Rowley: I think a lot of folks are not aware of how much of the world’s platinum and palladium is mined. There really are two different production models there. Three-quarters of the world’s platinum is mined from narrow reef-type mines in South Africa. You can basically think of these reef deposits as being like veins. Even though they are geologically different, they are similar in terms of the mining effort and the nature of mining. Thousands of workers, kilometers underground, working mineralized widths that are less than one meter, with rock temperatures hitting 75 degrees centigrade. These mines have been losing money for years, they are undercapitalized, and they are closing and will continue to close.

And it’s interesting that the South African mining companies that own these operations are diversifying. We saw Sibanye buy Stillwater for $2.2B in 2017, and just recently Impala Platinum bought North American Palladium for $1B. That trend of closing reef-type mines and corporate diversification outside of South Africa will continue through 2020 and beyond.

Now, let’s look at the Platreef district, also in the Bushveld complex but to the north of the reef mines and blessed with very different geology. The deposits at Platreef are tens to hundreds of meters thick and start at 26 Moz at Waterberg and run up to 265 Moz at Anglo American Platinum Ltd.’s (AMS:JSE) Mogalakwena mine. That operation is producing platinum at less than $400/oz. Ivanhoe Mines Ltd.’s (IVN:TSX; IVPAF:OTCQX) adjoining Platreef mine is now in construction and will have very similar attractive economics. The key is that they are bulk mining operations, and they have healthy co-product values of nickel and copper.

The setting is correct for multiple potential Platreef-style deposits at Stillwater. It’s there based on the known parallels between the Bushveld and Stillwater districts, and it’s there in our work to date. We are excited to be bringing that new age of platinum, palladium, nickel, and copper mining to an iconic American mining district.

Maurice Jackson: Last question sir: What did I forget to ask?

Michael Rowley: Let’s touch on our target commodities as several of them have made interesting moves lately. Palladium continues at record highs based on shortage of physical supplies. It ran an 800,000-ounce deficit last year, and is expected to run a 1 million-ounce deficit this year, driven largely by its use in catalytic converters, so that price can be expected to stay elevated for some time.

Nickel is getting a lot of press lately based on increasing demand in the battery and steel markets, especially after a large purchase by a Chinese group drew down inventories rather suddenly, just recently.

Platinum is starting to move and is expected to follow gold at some point, and that most likely driven by diminishing supplies out of South Africa due to mine closures, as we talked about a minute ago.

Overall, we are bullish on the price outlook for both those commodities and glad to be targeting them in America at a time when the U.S. government is looking to secure domestic supplies.

Maurice Jackson: To get more information on Group Ten Metals, the website address is www.grouptenmetals.com. And as a reminder Group Ten Metals trades on the TSX-V: PGE and on the OTCQB: PGEZF. For direct inquiries please contact Chris Ackerman at (604) 357-4790 ext. 1, and he may also be reached at [email protected].

As reminder Group Ten Metals is a sponsor and we are proud shareholders for the virtues conveyed in to today’s interview.

Before you make your next bullion purchase, be sure you call me. I’m a licensed representative for Miles Franklin Precious Metals Investments, where we provide a number of options to expand your precious metals portfolio, from physical delivery, offshore depositories, precious metal IRAs, and private blockchain-distributed ledger technology. Call me directly at (855) 505-1900 or you may e-mail [email protected].

Finally, please subscribe to provenandprobable.com, where we provide mining insights and bullion sales. Subscription is Free!

Michael Rowley of Group Ten Metals thank you for joining us today on Proven and Probable.

Maurice Jackson is the founder of Proven and Probable, a site that aims to enrich its subscribers through education in precious metals and junior mining companies that will enrich the world.

Sign up for our FREE newsletter at: www.streetwisereports.com/get-news

Disclosure:
1) Maurice Jackson: I, or members of my immediate household or family, own shares of the following companies mentioned in this article: Group Ten Metals. I personally am, or members of my immediate household or family are, paid by the following companies mentioned in this article: None. My company has a financial relationship with the following companies mentioned in this article: Group Ten Metals is a sponsor of Proven and Probable. Proven and Probable disclosures are listed below.
2) The following companies mentioned in this article are billboard sponsors of Streetwise Reports: Group Ten Metals. Click here for important disclosures about sponsor fees. As of the date of this article, an affiliate of Streetwise Reports has a consulting relationship with Group Ten Metals. Please click here for more information.
3) Statements and opinions expressed are the opinions of the author and not of Streetwise Reports or its officers. The author is wholly responsible for the validity of the statements. The author was not paid by Streetwise Reports for this article. Streetwise Reports was not paid by the author to publish or syndicate this article. The information provided above is for informational purposes only and is not a recommendation to buy or sell any security. Streetwise Reports requires contributing authors to disclose any shareholdings in, or economic relationships with, companies that they write about. Streetwise Reports relies upon the authors to accurately provide this information and Streetwise Reports has no means of verifying its accuracy.
4) This article does not constitute investment advice. Each reader is encouraged to consult with his or her individual financial professional and any action a reader takes as a result of information presented here is his or her own responsibility. By opening this page, each reader accepts and agrees to Streetwise Reports’ terms of use and full legal disclaimer. This article is not a solicitation for investment. Streetwise Reports does not render general or specific investment advice and the information on Streetwise Reports should not be considered a recommendation to buy or sell any security. Streetwise Reports does not endorse or recommend the business, products, services or securities of any company mentioned on Streetwise Reports.
5) From time to time, Streetwise Reports LLC and its directors, officers, employees or members of their families, as well as persons interviewed for articles and interviews on the site, may have a long or short position in securities mentioned. Directors, officers, employees or members of their immediate families are prohibited from making purchases and/or sales of those securities in the open market or otherwise from the time of the interview or the decision to write an article until three business days after the publication of the interview or article. The foregoing prohibition does not apply to articles that in substance only restate previously published company releases. As of the date of this article, officers and/or employees of Streetwise Reports LLC (including members of their household) own shares of Group Ten Metals, a company mentioned in this article.

Proven and Probable LLC receives financial compensation from its sponsors. The compensation is used is to fund both sponsor-specific activities and general report activities, website, and general and administrative costs. Sponsor-specific activities may include aggregating content and publishing that content on the Proven and Probable website, creating and maintaining company landing pages, interviewing key management, posting a banner/billboard, and/or issuing press releases. The fees also cover the costs for Proven and Probable to publish sector-specific information on our site, and also to create content by interviewing experts in the sector. Monthly sponsorship fees range from $1,000 to $4,000 per month. Proven and Probable LLC does accept stock for payment of sponsorship fees. Sponsor pages may be considered advertising for the purposes of 18 U.S.C. 1734.

The Information presented in Proven and Probable is provided for educational and informational purposes only, without any express or implied warranty of any kind, including warranties of accuracy, completeness, or fitness for any particular purpose. The Information contained in or provided from or through this forum is not intended to be and does not constitute financial advice, investment advice, trading advice or any other advice. The Information on this forum and provided from or through this forum is general in nature and is not specific to you the User or anyone else. You should not make any decision, financial, investments, trading or otherwise, based on any of the information presented on this forum without undertaking independent due diligence and consultation with a professional broker or competent financial advisor. You understand that you are using any and all Information available on or through this forum at your own risk.

Images provided by the author.

( Companies Mentioned: PGE:TSX.V; PGEZF:OTCQB; 5D32:FSE,
)

Navidea Shares Jump 60% on Phase 2b Rheumatoid Arthritis Trial Results

By The Life Science Report

Source: Streetwise Reports   10/29/2019

Shares of Navidea Biopharmaceuticals traded 60% higher today on extremely high relative volume after the firm released data from its Phase 2b Rheumatoid Arthritis Tc 99m Tilmanocept Planar Imaging study.

Developer of precision immunodiagnostic agents and immunotherapeutics Navidea Biopharmaceuticals Inc. (NAVB:AMEX), today announced positive results from the company’s first interim analysis of its ongoing NAV3-31 Phase 2B study. The company advised in the report that the “Analysis demonstrates that these interim data support Navidea’s hypotheses that Tc 99m Tilmanocept imaging can provide robust, quantitative imaging in healthy controls and in patients with active rheumatoid arthritis (RA) and that this imaging is stable, reproducible, and can define joints with and without RA-involved inflammation.”

The firm’s NAV3-31 Phase 2B trial which included 30 patient subjects is titled “Evaluation of the Precision and Sensitivity of Tilmanocept Uptake Value (TUV) on Tc 99m Tilmanocept Planar Imaging”. The study included three arms that included healthy subjects, patients with active, moderate-to-severe rheumatoid arthritis (RA) who are on stable therapy, and a pilot arm of the upcoming Phase 3 trial of Tc 99m tilmanocept as an early indicator of efficacy of anti-TNF alpha treatment in RA patients. The company advised that the whole body and hand/wrist image sets acquired on the same day at multiple time points demonstrated quantitative repeatability and stability of signal, noting that images from patients with active RA show the same localization patterns on images taken a week apart.

The company advised that the data demonstrated quantitative repeatability and stability of signal and it is now continuing to enroll subjects as planned to complete the Phase 2b study and preparing for the upcoming Phase 3 trial.

The company’s Chief Medical Officer Michael Rosol commented, “These results support our hypotheses for Arms 1 and 2 of this trial and are key for the path forward to the Phase 3. The demonstration that Tc 99m tilmanocept imaging is stable and has low variability enables us to proceed with confidence in testing our hypothesis that this can be an early indicator of therapeutic efficacy in these patients…With these exciting results in hand, we continue to enroll subjects as planned to complete this Phase 2B and prepare for the upcoming Phase 3.”

Navidea’s CEO Jed Latkin added, “I am very pleased that the results of this interim analysis are so encouraging. It reaffirms that we are heading in the right direction with our clinical trial pipeline in rheumatoid arthritis. I look forward to continuing this momentum into the Phase 3.”

The company explains in the report that “RA is a chronic disease affecting over 1.3 million Americans and as much as 1% of the worldwide population. If the product is successfully developed, Navidea would expect to play a major role in the management of RA patients worldwide.”

Navidea Biopharmaceuticals is based in Dublin, Ohio and has more than 50 employees worldwide. The firm states that it is a “biopharmaceutical company focused on the development of precision immunodiagnostic agents and immunotherapeutics, and is developing multiple precision-targeted products based on its Manocept platform to enhance patient care by identifying the sites and pathways of disease and enable better diagnostic accuracy, clinical decision-making, and targeted treatment. Navidea’s Manocept platform is predicated on the ability to specifically target the CD206 mannose receptor expressed on activated macrophages.”

Navidea began the day with a market capitalization of about $14 million with 18.06 million shares outstanding. The stock has a 52-week price range of $0.49-5.32. NAVB shares opened much higher today at $1.24 (+$0.4625, +59.49%) over yesterday’s $0.7775 closing price. The stock has traded more than 21 million shares today between $1.09-1.39/share and is currently trading at $1.26 (+$0.4825, +62.06%).

Sign up for our FREE newsletter at: www.streetwisereports.com/get-news

Disclosure:
1) Stephen Hytha compiled this article for Streetwise Reports LLC and provides services to Streetwise Reports as an independent contractor. He or members of his household own securities of the following companies mentioned in the article: None. He or members of his household are paid by the following companies mentioned in this article: None.
2) The following companies mentioned in this article are billboard sponsors of Streetwise Reports: None. Click here for important disclosures about sponsor fees.
3) Comments and opinions expressed are those of the specific experts and not of Streetwise Reports or its officers. The information provided above is for informational purposes only and is not a recommendation to buy or sell any security.
4) The article does not constitute investment advice. Each reader is encouraged to consult with his or her individual financial professional and any action a reader takes as a result of information presented here is his or her own responsibility. By opening this page, each reader accepts and agrees to Streetwise Reports’ terms of use and full legal disclaimer. This article is not a solicitation for investment. Streetwise Reports does not render general or specific investment advice and the information on Streetwise Reports should not be considered a recommendation to buy or sell any security. Streetwise Reports does not endorse or recommend the business, products, services or securities of any company mentioned on Streetwise Reports.
5) From time to time, Streetwise Reports LLC and its directors, officers, employees or members of their families, as well as persons interviewed for articles and interviews on the site, may have a long or short position in securities mentioned. Directors, officers, employees or members of their immediate families are prohibited from making purchases and/or sales of those securities in the open market or otherwise from the time of the interview or the decision to write an article until three business days after the publication of the interview or article. The foregoing prohibition does not apply to articles that in substance only restate previously published company releases.
6) This article does not constitute medical advice. Officers, employees and contributors to Streetwise Reports are not licensed medical professionals. Readers should always contact their healthcare professionals for medical advice.

( Companies Mentioned: NAVB:NYSE,
)

New Data Could Drive Use of Pancreatic Cancer Early Detection Test

By The Life Science Report

Source: Streetwise Reports   10/29/2019

The recent results and their implications are provided in an H.C. Wainwright & Co. report.

In an Oct. 25 research note, H.C. Wainwright & Co. analyst Yi Chen reported that newly compiled data support the clinical utility of Interpace Diagnostics Group Inc.’s (IDXG:NASDAQ) PancraGEN and could help drive market adoption of it.

The diagnostic test is used for early detection of cancer in indeterminate pancreatic cysts and pancreatobiliary solid lesions.

Chen reviewed and commented on the new data. They are from a retrospective records review of 2,167 patients who had two or more endoscopic ultrasound-guided fine needle aspirations (EUS-FNAs) of their pancreatic cyst and were tested with PancraGEN between April 2002 and March 2019. Interpace presented these study results recently at the annual meeting of the American College of Gastroenterology.

“The data demonstrate that examining molecular progression and regression of pancreatic cysts over time using PancraGEN can lead to a better understanding of their natural history, which can help guide the frequency of surveillance,” Chen noted.

Specifically, findings showed that 86% of patients initially had a low risk PancraGEN result. Among those, at follow-up EUS-FNA, PancraGEN showed 92% to still be low risk and 8% to now be moderate or high risk. About 99% of diagnostic progression was only to moderate risk.

Of the 14% who initially had a moderate or high risk PancraGEN result, 21% remained moderate or high risk at follow-up whereas 79% regressed to low risk. More than 99% of the cases of diagnostic regression was from moderate risk.

Chen reported, too, that last month, Interpace contracted with three independent Blue Cross Blue Shield (BCBS) plans, equating to 5 million covered lives across Alabama, Arkansas and Arizona. This development means these insurers’ subscribers now have in-network access to the biotech’s ThyGeNEXT and ThyraMIR tests, which are used to evaluate indeterminate thyroid biopsies.

These and previously announced similar contracts boost the positioning of Interpace’s thyroid diagnostics in the market and ensure reimbursement for their use, Chen pointed out. “We believe the company’s continuous expansion in contracts with commercial payors should increase market adoption and test volume growth in the coming quarters,” he added.

H.C. Wainwright has a Buy rating and a $2 per share target price on Interpace, whose stock is now trading at around $0.78 per share.

Sign up for our FREE newsletter at: www.streetwisereports.com/get-news

Disclosure:
1) Doresa Banning compiled this article for Streetwise Reports LLC and provides services to Streetwise Reports as an independent contractor. She or members of her household own securities of the following companies mentioned in the article: None. She or members of her household are paid by the following None. Click here for important disclosures about sponsor fees.
3) Comments and opinions expressed are those of the specific experts and not of Streetwise Reports or its officers. The information provided above is for informational purposes only and is not a recommendation to buy or sell any security.
4) The article does not constitute investment advice. Each reader is encouraged to consult with his or her individual financial professional and any action a reader takes as a result of information presented here is his or her own responsibility. By opening this page, each reader accepts and agrees to Streetwise Reports’ terms of use and full legal disclaimer. This article is not a solicitation for investment. Streetwise Reports does not render general or specific investment advice and the information on Streetwise Reports should not be considered a recommendation to buy or sell any security. Streetwise Reports does not endorse or recommend the business, products, services or securities of any company mentioned on Streetwise Reports.
5) From time to time, Streetwise Reports LLC and its directors, officers, employees or members of their families, as well as persons interviewed for articles and interviews on the site, may have a long or short position in securities mentioned. Directors, officers, employees or members of their immediate families are prohibited from making purchases and/or sales of those securities in the open market or otherwise from the time of the interview or the decision to write an article until three business days after the publication of the interview or article. The foregoing prohibition does not apply to articles that in substance only restate previously published company releases.

6) This article does not constitute medical advice. Officers, employees and contributors to Streetwise Reports are not licensed medical professionals. Readers should always contact their healthcare professionals for medical advice.

Disclosures from H.C. Wainwright & Co., Interpace Diagnostics Group Inc., Company Update, October 25, 2019

Investment Banking Services include, but are not limited to, acting as a manager/co-manager in the underwriting or placement of securities, acting as financial advisor, and/or providing corporate finance or capital markets-related services to a company or one of its affiliates or subsidiaries within the past 12 months.

I, Yi Chen, Ph.D. CFA and Raghuram Selvaraju, Ph.D., certify that 1) all of the views expressed in this report accurately reflect my personal views about any and all subject securities or issuers discussed; and 2) no part of my compensation was, is, or will be directly or indirectly related to the specific recommendation or views expressed in this research report; and 3) neither myself nor any members of my household is an officer, director or advisory board member of these companies.

None of the research analysts or the research analyst’s household has a financial interest in the securities of Interpace
Diagnostics Group, Inc. (including, without limitation, any option, right, warrant, future, long or short position).

As of September 30, 2019 neither the Firm nor its affiliates beneficially own 1% or more of any class of common equity securities of Co-Diagnostics, Inc.

Neither the research analyst nor the Firm has any material conflict of interest in of which the research analyst knows or has reason to know at the time of publication of this research report.

The research analyst principally responsible for preparation of the report does not receive compensation that is based upon any specific investment banking services or transaction but is compensated based on factors including total revenue and profitability of the Firm, a substantial portion of which is derived from investment banking services.

The firm or its affiliates received compensation from Interpace Diagnostics Group, Inc. for non-investment banking services
in the previous 12 months.

The Firm or its affiliates did receive compensation from Interpace Diagnostics Group, Inc. for investment banking services
within twelve months before, and will seek compensation from the companies mentioned in this report for investment banking
services within three months following publication of the research report.

H.C. Wainwright & Co., LLC managed or co-managed a public offering of securities for Interpace Diagnostics Group, Inc. during the past 12 months.

The Firm does not make a market in Interpace Diagnostics Group, Inc. as of the date of this research report.

H.C. Wainwright & Co., LLC and its affiliates, officers, directors, and employees, excluding its analysts, will from time to time have long or short positions in, act as principal in, and buy or sell, the securities or derivatives (including options and warrants) thereof of covered companies referred to in this research report.

( Companies Mentioned: IDXG:NASDAQ,
)

Energy MLP Makes ‘Contrarian Play Outside the Renewables Arena’

The Energy Report

Source: Streetwise Reports   10/28/2019

A description of and comments about the play, an acquisition, are provided in a Raymond James report.

In an Oct. 22 research note, Raymond James analyst Pavel Molchanov reported that Nextera Energy Partners LP (NEP:NYSE) agreed to acquire the Meade Pipeline for $1.37 billion. Closing is expected in November.

This deal comes at a time when “it seems like a stretch to expect even more multiple expansion [for Nextera], hence our Market Perform rating,” Molchanov indicated. Thus, the acquisition is positive in that it does not involve drop-down transactions as most do for the master limited partnership (MLP).

Molchanov described the asset being acquired. Low risk and fee based, the Meade Pipeline holds a 39.2% interest in the Central Penn Line, a 1.7 billion cubic feet per day pipeline in the Marcellus, transporting gas to the Mid-Atlantic markets. Transco, which contracted 100% of the capacity to nine shippers, has a minimum 14-year lease with Meade. The deal will take Nextera into the Marcellus Shale and beyond its current pipeline assets in Texas.

As for the acquisition cost, “the ‘headline’ valuation is pricey,” Molchanov pointed out, with the $1.37 billion translating to 14x EBITDA of $90–100 million. When the proposed pipeline expansion is completed, EBITDA is expected to rise to $105–115 million.

Because Nextera’s purchase of Meade Pipeline is not wind and solar energy centered, Molchanov described it as contrarian and wrote that the MLP’s management still remains focused on low-carbon energy.

As for drop-downs, Molchanov noted, Q3/19 was the first full quarter with the latest one, a deal for 611 megawatts of alternative energy, two-thirds of it wind, which closed in June. “Distributable cash flow (ex-Desert Sunlight) of $125 million, a perennial source of choppiness, topped our model as well as the previous all-time high of $116 million from Q2/18,” the analyst added. Adjusted EBITDA in Q2/19 was $315 million, reflecting a 55% year-over-year increase.

Molchanov wrote that no changes have been made to the years-long, consistent quarterly dividend. Looking forward, annual growth of the distribution still is an estimated 12–15% through 2024 with 2019 likely to fall in the high end.

Nextera’s current share price is $50.01.

Sign up for our FREE newsletter at: www.streetwisereports.com/get-news

Disclosure:
1) Doresa Banning compiled this article for Streetwise Reports LLC and provides services to Streetwise Reports as an independent contractor. She or members of her household own securities of the following companies mentioned in the article: None. She or members of her household are paid by the following companies mentioned in this article: None.
2) The following companies mentioned in this article are billboard sponsors of Streetwise Reports: None. Click here for important disclosures about sponsor fees.
3) Comments and opinions expressed are those of the specific experts and not of Streetwise Reports or its officers. The information provided above is for informational purposes only and is not a recommendation to buy or sell any security.
4) The article does not constitute investment advice. Each reader is encouraged to consult with his or her individual financial professional and any action a reader takes as a result of information presented here is his or her own responsibility. By opening this page, each reader accepts and agrees to Streetwise Reports’ terms of use and full legal disclaimer. This article is not a solicitation for investment. Streetwise Reports does not render general or specific investment advice and the information on Streetwise Reports should not be considered a recommendation to buy or sell any security. Streetwise Reports does not endorse or recommend the business, products, services or securities of any company mentioned on Streetwise Reports.
5) From time to time, Streetwise Reports LLC and its directors, officers, employees or members of their families, as well as persons interviewed for articles and interviews on the site, may have a long or short position in securities mentioned. Directors, officers, employees or members of their immediate families are prohibited from making purchases and/or sales of those securities in the open market or otherwise from the time of the interview or the decision to write an article until three business days after the publication of the interview or article. The foregoing prohibition does not apply to articles that in substance only restate previously published company releases.

Disclosures from Raymond James, Nextera Energy Partners LP, October 22, 2019

ANALYST INFORMATION

Analysts Holdings and Compensation: Equity analysts and their staffs at Raymond James are compensated based on a salary and bonus system. Several factors enter into the bonus determination, including quality and performance of research product, the analyst’s success in rating stocks versus an industry index, and support effectiveness to trading and the retail and institutional sales forces. Other factors may include but are not limited to: overall ratings from internal (other than investment banking) or external parties and the general productivity and revenue generated in covered stocks.

The analyst Pavel Molchanov, primarily responsible for the preparation of this research report, attests to the following: (1) that the views and opinions rendered in this research report reflect his or her personal views about the subject companies or issuers and (2) that no part of the research analyst’s compensation was, is, or will be directly or indirectly related to the specific recommendations or views in this research report. In addition, said analyst(s) has not received compensation from any subject company in the last 12 months.

RAYMOND JAMES RELATIONSHIP DISCLOSURES
Certain affiliates of the RJ Group expect to receive or intend to seek compensation for investment banking services from all companies under research coverage within the next three months.

Additional Risk and Disclosure information, as well as more information on the Raymond James rating system and suitability categories, is available here.

Saudi Arabia follows Fed and cuts key rates 25 bps

By CentralBankNews.info

Saudi Arabia’s central bank lowered its benchmark repurchase rate and the reverse repo rate by 25 basis points to 2.25 percent and 1.75 percent, respectively, shortly after the U.S. Federal Reserve lowered its federal funds rate by a similar amount.

It is the third rate cut this year by the Saudi Arabian Monetary Authority (SAMA), mirroring the Fed’s three rate cuts since July to maintain the peg of the Saudi Riyal to the U.S. dollar.

www.CentralBankNews.info

Malawi holds rate as inflation still seen decelerating

By CentralBankNews.info
Malawi’s central bank left its policy rate steady at 13.50 percent and confirmed it expects inflation to average 9.0 percent this year, pushed up by higher maize prices, but this is considered temporary and not a risk to achieving the inflation objective of 5 percent by 2021.
The Reserve Bank of Malawi (RBM), which slashed its policy rate in half from November 2016 to May this year on falling inflation, also confirmed its forecast from July for economic growth of 5 percent this year, up from 4 percent in 2018, as the economy “displayed notable resilience despite the adverse effects of Cyclone Idai and the weak performance of tobacco products in 2019.
RBM has cut its policy rate by 13.50 percentage points since November 2016, with the most recent cut in May this year, as inflation declined from almost 25 percent in December 2015 after two years of drought boosted food prices. Since then, better weather has led to improved food production and helped stabilize the kwacha, which fell sharply from 2021 to March 2016.
Today the kwacha trades around 731 to the U.S. dollar, largely unchanged this year.
Malawi’s inflation rate eased to 9.2 percent in September from 9.5 percent in August for a rise to 9.3 percent in the third quarter from 9.0 percent in the second quarter due to food inflation, which rose to 14.2 percent from 13.5 percent in the second quarter.
Non-food inflation, however, fell to an average of 5.4 percent in the third quarter from 5.5 percent in the second, largely due to a stable exchange rate, RBM said.
The forecast for a gradual decline in inflation toward 5 percent is contingent on favorable weather as well as prudent fiscal management, the central bank said, adding higher food prices may slightly push up inflation in the fourth quarter so it is marginally higher than projected.
While this is considered temporary, the central bank said a gradual disinflation process is still necessary due to second round effects of higher inflation, hence the decision to maintain the rate.

    The Reserve Bank of Malawi issued the following statement:


The Monetary Policy Committee (MPC), at its 4th meeting for 2019 held on 29th and 30th October, decided to maintain the Policy Rate at 13.5 percent and the Lombard Rate at 0.4 percent above the Policy Rate. The Committee also maintained the Liquidity Reserve Requirement (LRR) on local currency deposits at 5 percent, and the LRR on foreign currency deposits at 3.75 percent. In arriving at this decision, the Committee observed that although rising maize prices may marginally push up headline inflation in the near term, this elevation is deemed temporary and does not pose a risk to the medium-term inflation objective of 5 percent by 2021.

The economy remains resilient
The economy has displayed notable resilience despite the adverse effects of Cyclone Idai and the weak performance of tobacco exports in 2019. Real Gross Domestic Product (GDP) continues to recover and is projected to grow by 5 percent in 2019; inflation has remained in single digit, and was recorded at 9.3 percent in the third quarter of 2019; the exchange rate remains remarkably firm, currently trading at around K740 per US dollar; lending rates continue to decline, with the base lending rate (now the reference rate) recorded at a historically low level of 12 percent; and private sector credit continued to expand, having grown by an average of 19.1 percent in the third quarter of 2019 up from 15.1 percent in the preceding quarter and 9.9 percent in the corresponding quarter of 2018. The Committee therefore observed that the positive macroeconomic outlook envisaged during its first meeting of 2019 remains firm.

Inflation is projected to average 9.0 percent in 2019
Inflation increased in the third quarter of 2019 to 9.3 percent from 9.0 percent in the second quarter of 2019. The increase was on account of food inflation which rose to 14.2 percent from 13.5 percent in the second quarter of 2019, and 9.9 percent in the corresponding quarter of 2018. Food inflation has largely been driven by maize prices which rose to K227 per Kg in October 2019 from K130 per Kg in October 2018. Food prices pressure may marginally intensify during the lean period, but is expected to substantially decline at the onset of the next harvest season. Non-food inflation, on the other hand, has remained remarkably low as it declined further to an average of 5.4 percent in the third quarter of 2019 from 5.5 percent in the previous quarter, largely owing to stability in the exchange rate.

Credit growth remains strong and money supply growth is not expansionary
Private sector credit has maintained a strong growth momentum, with the third quarter of 2019 registering a growth rate of 19.2 percent compared to 15.1 percent in the preceding quarter and 9.9 percent in the corresponding quarter of 2018. Recovery in private sector credit follows recent declines in interest rates as well as a generally improved macroeconomic environment. The annual growth rate of money supply has been remarkably contained and was recorded at 12.4 percent in August 2019, compared to 10.8 percent and 11.0 percent recorded in July 2019 and August 2018, respectively. The nominal growth of money supply has been consistently lower than the nominal GDP growth for 2019 which is currently estimated at 13.4 percent, signifying subdued demand pressures.

Global economic growth prospects downgraded
The global growth forecast has been revised downwards further by 0.3 percentage points to 3.0 percent in 2019. Growth in advanced economies is projected at 1.7 percent due to lower growth prospects in the United States and Euro area. Emerging market and developing economies are expected to grow by 3.9 percent in 2019. In sub-Saharan Africa, growth is projected at 3.2 percent in 2019 and 3.6 percent in 2020. In South Africa, growth will be weaker in 2019 than earlier projected, reflecting a larger-than-anticipated impact of labour strikes and energy supply issues in mining, together with weak agricultural production. Oil prices have been relatively stable, trading within a narrow range in 2019 despite heightened geopolitical uncertainty. In September 2019, oil prices averaged $60 per barrel. Annual prices are expected to average $61.8 per barrel in 2019, a decrease of 9.6 percent from the 2018 average.

MPC maintains the Policy rate
The MPC noted the general improvement in macroeconomic conditions in 2019, which provided room to reduce the policy rate by 250 basis points in the first two sittings of the Committee, from 16 percent in December 2018 to 13.5 percent in May 2019. Inflation is projected to average 9 percent in 2019 and to gradually decline to 5 percent in 2021, contingent on favourable weather pattern in the next two growing seasons as well as prudent fiscal management. Meanwhile, rising food prices may slightly push up inflation in the fourth quarter leading to a marginally higher outcome than projected. The Committee considers this to be temporary. However, due to second round effects, the Committee considers that a gradual disinflation process is necessary and hence the decision to hold monetary policy unchanged. The Policy rate has thus been maintained at 13.5 percent, the LRR on domestic currency deposits at 5 percent and the LRR on foreign currency deposits at 3.75 percent.”

    www.CentralBankNews.info


Why Is MetaTrader 4 So Popular?

By Orbex

You’ve likely seen ads for MetaTrader 5, the latest version of the most popular forex trading application out there.

Designed to be an upgrade from MetaTrader 4, it has the latest features, and the manufacturer is quite keen to get people to adopt it.

With most technologies, everyone wants the latest version; the latest iPhone, the newest version of Windows, the last release of their favorite game…

So, why is MetaTrader 4 still so popular? In fact, it’s still the most popular forex trading platform for retail FX traders. There’s got to be something going on here…

MT4 v MT5

First, we should understand what are the differences between MetaTrader 4 and what is often billed as its sister program.

Probably the most important trait, in terms of market functionality, is that it isn’t all that different. In fact, if you were to open MT5, it would look almost identical to your MT4 forex trading program. The difference, really, is in the backend: it uses a different programming language which is easier to work with.

But, for the average forex trader who isn’t developing EAs and writing programs to run on their platform – in other words, pretty much everyone – there isn’t much practical difference between the two programs. They have the same indicators, and execution time is the same. There isn’t even a noticeable improvement in aesthetics.

It’s Just Basic Math, Really

This leads to the somewhat anticlimactic explanation for why so many traders stick with MT4: they don’t have a reason to “upgrade”.

And those quotation marks are for a reason! While the company behind the program is definitely trying to push people to use it over their prior program, they continue to support it fully. Therefore, most people see it more as an equal than an upgrade.

Most people who learned to trade on MT4 already know how it works, and are perfectly comfortable with it.

So, they have no need to download, install and deal with a new program that has exactly the same indicators and functions.

Originally MT4 was designed for forex traders, while MT5 was supposed to offer more assets to trade, such as stocks. But, that was retroactively included in all the latest MT4 builds. So, there is no difference between the two in that regard.

The Crowd Decides

A significant number of bigger, steady traders use add-ons to their program, which have been developed for use in MT4.

Because of the change in programing language, they would not be compatible with MT5. There is no advantage for FX traders to learn an entirely new programming language in order to move their customized EAs to another platform. So, without a significant development in signals, EAs and copy-trading on MT5, there is little motivation for other retail traders to move as well.

Basically, there is already a huge community behind MT4, with lots of resources and web articles to support new FX traders. This means that even after the introduction of the newer program, the majority of forex traders will still gravitate towards MT4.

The Bottom Line

There isn’t anything wrong with MT5. And, presumably, over time, it will replace MT4.

But, not anytime in the near future. Should you choose to start trading with the upgraded version, you probably won’t find yourself at a significant disadvantage.

But, in the end, MT4 persists simply out of inertia; it’s good, it gets the job done, and if it ain’t broke, why fix it?

By Orbex


Canada holds rate but lowers 2020, 2021 growth forecast

By CentralBankNews.info

Canada’s central bank left its benchmark target for the overnight rate at 1.75 percent but said the country’s economy was not immune to the weaker global economy and lowered its forecast for economic growth next year and 2021.

“The Governing Council is mindful that the resilience of Canada’s economy will be increasingly tested as trade conflicts and uncertainty persist,” said the Bank of Canada (BOC), adding it would keep a close eye on the extent to which the global slowdown spreads beyond manufacturing and investment, especially consumer spending and housing activity, as well as fiscal policy.

The Bank of Canada issued the following statement:

“The Bank of Canada today maintained its target for the overnight rate at 1 ¾ percent. The Bank Rate is correspondingly 2 percent and the deposit rate is 1 ½ percent.
The outlook for the global economy has weakened further since the Bank’s July Monetary Policy Report (MPR). Ongoing trade conflicts and uncertainty are restraining business investment, trade, and global growth. A growing number of countries have responded with monetary and other policy measures to support their economies. Still, global growth is expected to slow to around 3 percent this year before edging up over the next two years. Canada has not been immune to these developments. Commodity prices have fallen amid concerns about global demand. Despite this, the Canada-US exchange rate is still near its July level, and the Canadian dollar has strengthened against other currencies.
Growth in Canada is expected to slow in the second half of this year to a rate below its potential. This reflects the uncertainty associated with trade conflicts, continuing adjustment in the energy sector, and the unwinding of temporary factors that boosted growth in the second quarter. Business investment and exports are likely to contract before expanding again in 2020 and 2021. At the same time, government spending and lower borrowing rates are supporting domestic demand, and activity in the services sector remains robust. Employment is showing continuing strength and wage growth is picking up, although with some variation among regions. Consumer spending has been choppy, but will be supported by solid income growth. Meanwhile, housing activity is picking up in most markets. The Bank continues to monitor the evolution of financial vulnerabilities in light of lower mortgage rates and past changes to housing market policies.
The Bank projects real GDP will grow by 1.5 percent this year, 1.7 percent in 2020 and 1.8 percent in 2021. This implies that the current modest output gap will narrow over the projection horizon. Measures of inflation are all around 2 percent. CPI inflation likely will dip temporarily in 2020 as the effect of a previous spike in energy prices fades. Overall, the Bank expects inflation to track close to the 2 percent target over the projection horizon.
All things considered, Governing Council judges it appropriate to maintain the current level of the overnight rate target. Governing Council is mindful that the resilience of Canada’s economy will be increasingly tested as trade conflicts and uncertainty persist. In considering the appropriate path for monetary policy, the Bank will be monitoring the extent to which the global slowdown spreads beyond manufacturing and investment. In this context, it will pay close attention to the sources of resilience in the Canadian economy – notably consumer spending and housing activity – as well as to fiscal policy developments.

www.CentralBankNews.info


US Fed cuts rate 3rd time due to ‘global developments’

By CentralBankNews.info

The Federal Reserve, the U.S. central bank, lowered its benchmark federal funds rate for the third time this year and again said this was due to “the implications of global developments for the economic outlook as well as muted inflation pressures.”

The Federal Open Market Committee (FOMC), the Fed’s policy-making body, cut the fed funds rate by another 25 basis points to 1.50 – 1.75 percent and has now cut it by 75 basis points this year following cuts in July, September and today.

The FOMC largely reiterated its view from September that the labor market remains strong, economic activity has been rising at a moderate rate, and while household spending has been rising at strong pace, business investment and exports “remain weak.”

“This action supports the Committee’s view that sustained expansion of economic activity, strong labor market conditions and inflation near the Committee’s symmetric 2 percent objectives are the most likely outcomes, but uncertainties about this outlook remain,” the FOMC said, reiterating its statement from September and July.

On both occasions when the Fed cut its rate this year it attributed this to the impact of weak global growth on the U.S. economy along with muted inflation.

Illustrating the continued split within the FOMC, 8 of its 10 members voted in favor of the rate cut while two members, Esther George and Eric Rosengren voted to maintain the rate, as in September.

The U.S. economy has been slowing in the last two quarters, with real growth in the third quarter today estimated at 2.0 percent year-on-year, down from 2.3 percent in the second quarter and 2.7 percent in the first quarter.

Although overall growth was better than expected, helped by a 2 percent rise in government spending, data showed consumer spending easing to 2.9 percent growth from 4.6 percent in the second quarter and non-residential fixed investment falling 3.0 percent, reflecting the widespread decline in global investments amid uncertainty over trade.

But the jobs market in the U.S. is still healthy, with data today showing private businesses hiring 125,000 workers in October from September’s revised 93,000. In September the U.S. unemployment rate fell to 3.5 percent from 3.7 percent in the previous three months.

As in most of the world, inflation is stable and below central bank targets, with U.S. headline inflation steady at 1.7 percent in September and August, below the Fed’s 2.0 percent target.

The Board of Governors of the Federal Reserve System released the following statement:

“Information received since the Federal Open Market Committee met in September indicates that the labor market remains strong and that economic activity has been rising at a moderate rate. Job gains have been solid, on average, in recent months, and the unemployment rate has remained low. Although household spending has been rising at a strong pace, business fixed investment and exports remain weak. On a 12-month basis, overall inflation and inflation for items other than food and energy are running below 2 percent. Market-based measures of inflation compensation remain low; survey-based measures of longer-term inflation expectations are little changed.
Consistent with its statutory mandate, the Committee seeks to foster maximum employment and price stability. In light of the implications of global developments for the economic outlook as well as muted inflation pressures, the Committee decided to lower the target range for the federal funds rate to 1-1/2 to 1-3/4 percent. This action supports the Committee’s view that sustained expansion of economic activity, strong labor market conditions, and inflation near the Committee’s symmetric 2 percent objective are the most likely outcomes, but uncertainties about this outlook remain. The Committee will continue to monitor the implications of incoming information for the economic outlook as it assesses the appropriate path of the target range for the federal funds rate.
In determining the timing and size of future adjustments to the target range for the federal funds rate, the Committee will assess realized and expected economic conditions relative to its maximum employment objective and its symmetric 2 percent inflation objective. This assessment will take into account a wide range of information, including measures of labor market conditions, indicators of inflation pressures and inflation expectations, and readings on financial and international developments.
Voting for the monetary policy action were Jerome H. Powell, Chair; John C. Williams, Vice Chair; Michelle W. Bowman; Lael Brainard; James Bullard; Richard H. Clarida; Charles L. Evans; and Randal K. Quarles. Voting against this action were: Esther L. George and Eric S. Rosengren, who preferred at this meeting to maintain the target range at 1-3/4 percent to 2 percent.”

www.CentralBankNews.info


EURUSD Analysis: Steady French GDP bullish for EURUSD

By IFCMarkets

Steady French GDP bullish for EURUSD

French economy grew at the same pace – 0.3% over quarter in Q3, as the two previous quarters when a decline to 0.2% was expected. Will the EURUSD rise?

EURUSD testing MA(200)

The price chart on 1-hour timeframe shows EURUSD: H1 is trading sideways. The price is falling below the 200-period moving average MA(200) which is level. And the RSI oscillator is above 50 level but has not reached the overbought zone. There is no trend yet formed, traders have to decide when it would be a best time to enter the market.

Market Analysis provided by IFCMarkets