The US-China trade talks continue to drive the markets. Appetite for risk assets grew as Beijing announced the details of the phase one deal.
As part of this, both sides will be pulling back on the tariff hikes even if both sides reach a partial deal. So far nothing has been confirmed, but investors remain optimistic that the developments will lead to a formal announcement.
EU Commission Lowers Growth Forecasts
The European Commission released the fresh Autumn forecasts for the eurozone. The commission lowered growth for the eurozone, expecting a 1.1% increase. This is down by 0.1 percentage point from the previous forecasts. The GDP for 2020 was also down from 1.4% previously to 1.2%. On inflation, the commission expects consumer prices to average 1.2% this year and gradually rise to 1.3% by 2021.
EURUSD Could be Posting Further Declines
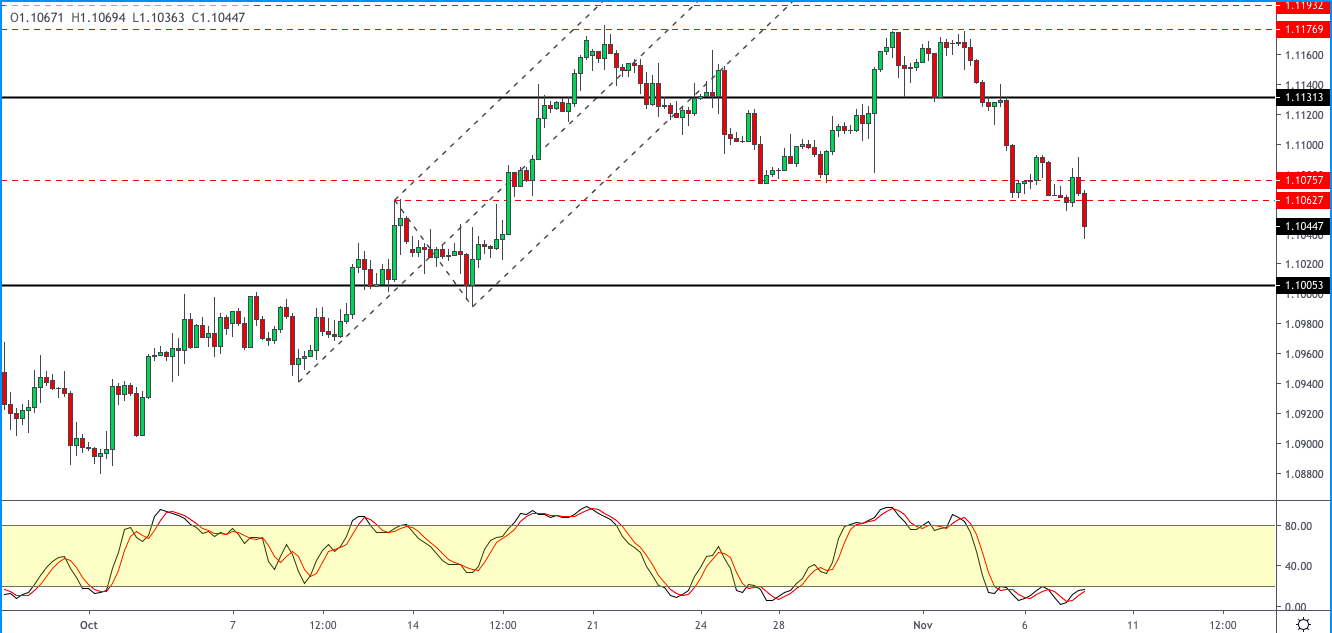
The currency pair is consolidating near the support area of 1.1075 – 1.1062. Price action is trading below this level. A strong close would confirm further declines. If this happens, the common currency will be targeting the lower support at the 1.1000 level. Given that this is a psychological level, we expect the EURUSD to stall at this support in the short term.
Bank of England Leaves Rates Unchanged
The Bank of England held its monetary policy meeting yesterday and decided to leave rates unchanged at 0.75%. The move was widely expected by the markets. However, the surprise was that there were two dissenting votes in favor of a rate hike. The BoE said that recent developments have reduced the risk of a no-deal Brexit and they expect growth to gradually rise.
GBPUSD Falls Below Support
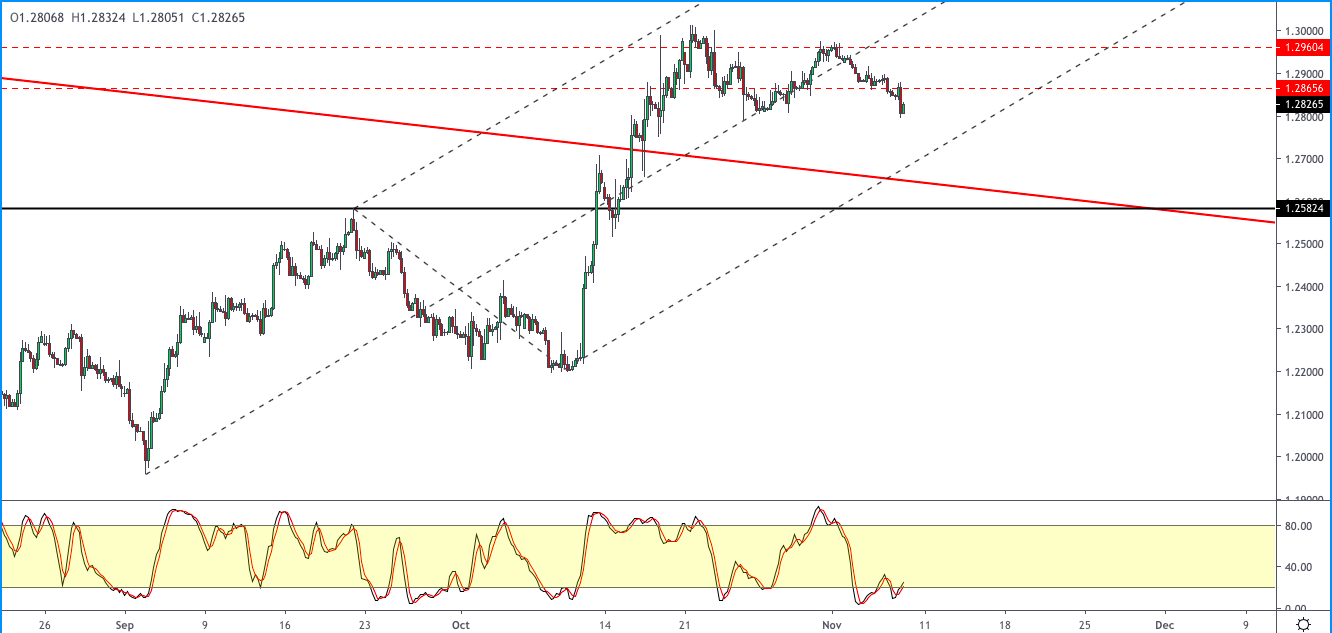
The currency pair fell after the BoE’s report, slipping below the support level of 1.2856. This comes after the currency pair was consolidating near the support area. However, the lower high forming indicates that the bias is to the downside. The minor support at 1.2810 will be key in the near term. A break down below this level will open the way for GBPUSD to slide towards 1.2582.
Gold Prices Slip on Renewed Trade Optimism
The precious metal was back on the decline losing over one percent on the day. The declines come on renewed trade optimism between the US and China. Sentiment for risk assets increases following the new developments on the trade front. The declines in gold prices come after the precious metal has been failing to post further gains.
XAUUSD is Seen Testing the Support
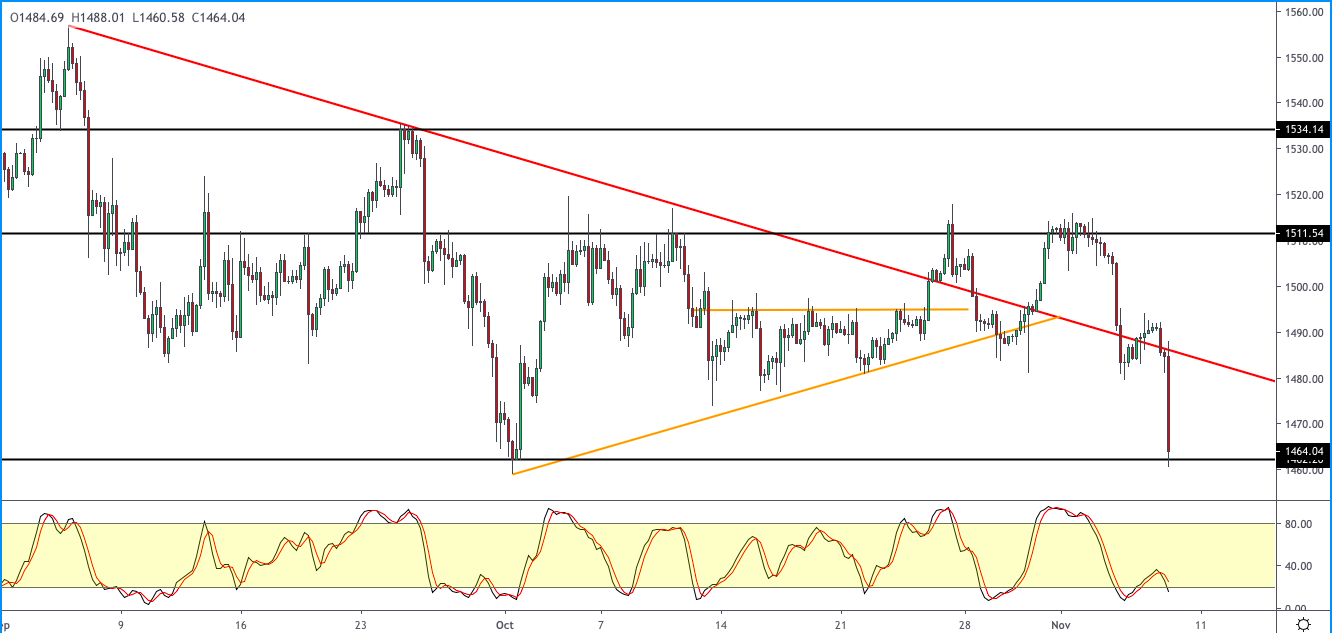
The declines in XAUUSD saw price action falling to the support area of 1462. The support area marks prices testing this level for the second time in recent weeks. Overall, XAUUSD is trading sideways within the levels of 1511 and 1462. A breakdown below the 1462 support level will potentially confirm further declines to 1440.
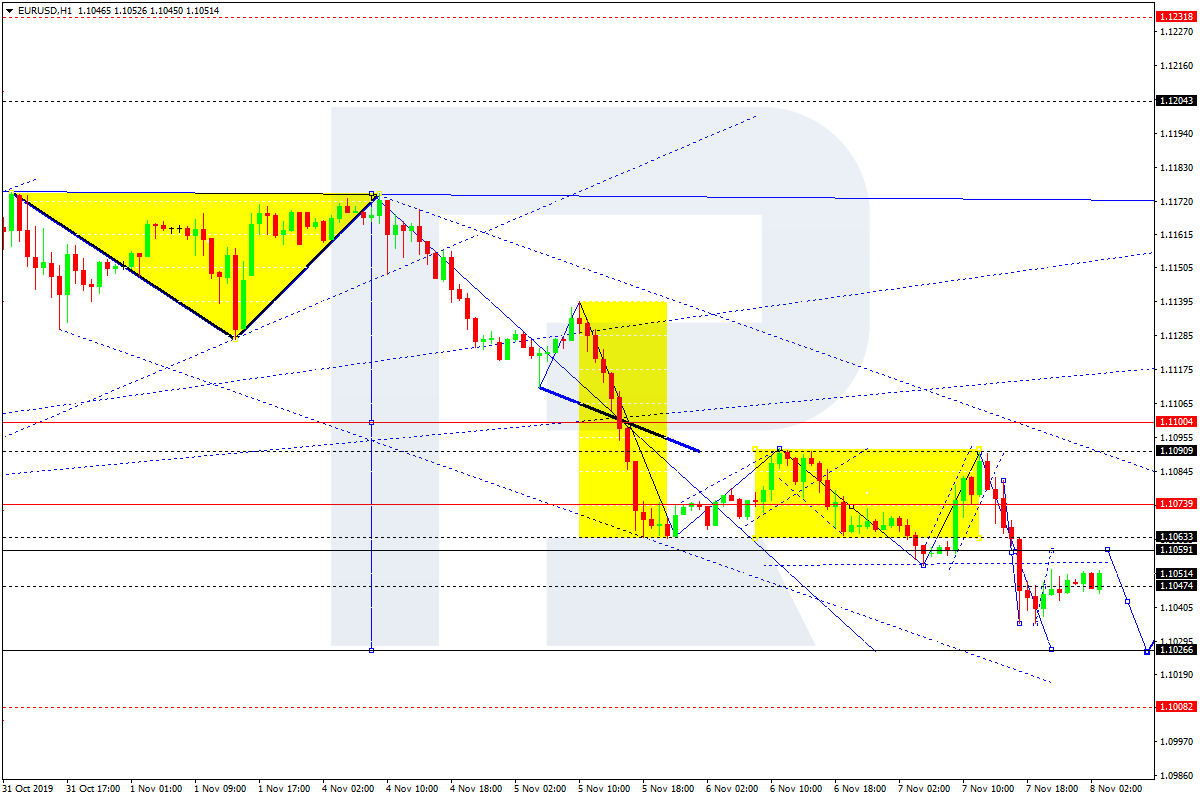
After breaking 1.1060, EURUSD has reached the short-term downside target at 1.1036. Today, the pair may grow to return to 1.1060 and then resume falling to reach 1.1027. After that, the instrument may start a new correction with the target at 1.1077.
GBPUSD, “Great Britain Pound vs US Dollar”
GBPUSD has reached 1.2800. Possibly, today the pair may resume trading upwards with the target at 1.2850. Later, the market may form a new descending structure towards 1.2765.
USDCHF, “US Dollar vs Swiss Franc”
USDCHF has expanded the consolidation range towards 0.9974; right now, it is falling to reach 0.9938. After that, the instrument may start another growth with the target at 0.9980.
USDJPY, “US Dollar vs Japanese Yen”
USDJPY has finished another ascending structure towards 109.47, thus forming Divergent Triangle pattern; right now, it is falling to reach 109.10. Alter, the market may form one more ascending structure towards 109.58 and then trade downwards with the target at 107.04.
AUDUSD, “Australian Dollar vs US Dollar”
AUDUSD is moving downwards to reach 0.6844. After that, the instrument may start a new growth with the target at 0.6898.
USDRUB, “US Dollar vs Russian Ruble”
USDRUB is falling towards 63.50; right now, it is forming Triangle pattern near the lows. If later the pair breaks this pattern to the upside, the instrument may continue the correction towards 64.64; if to the downside – resume trading inside the downtrend with the target at 62.00.
USDCAD, “US Dollar vs Canadian Dollar”
USDCAD is moving upwards. Possibly, the pair may reach 1.3197 and then start another decline to break 1.3155. After that, the instrument may continue trading downwards with the target at 1.3104.
XAUUSD, “Gold vs US Dollar”
After breaking 1481.00, Gold has completed the correction at 1464.50. Today, the pair may trade upwards to reach 1479.00 and then continue the correction with the target at 1447.40.
BRENT
After completing the descending impulse and then the correction at 63.22, Brent has broken the correctional channel; right now, it is consolidating around 62.50. Possibly, today the pair may fall towards 61.95. If later the price breaks this level, the market may continue trading downwards with the short-term target at 60.70.
BTCUSD, “Bitcoin vs US Dollar”
After reaching 9070.00, BTCUSD is growing towards the first target at 9325.00. In fact, the market is expected to start a new ascending structure to reach 9600.00.
Attention! Forecasts presented in this section only reflect the author’s private opinion and should not be considered as guidance for trading. RoboForex LP bears no responsibility for trading results based on trading recommendations described in these analytical reviews.
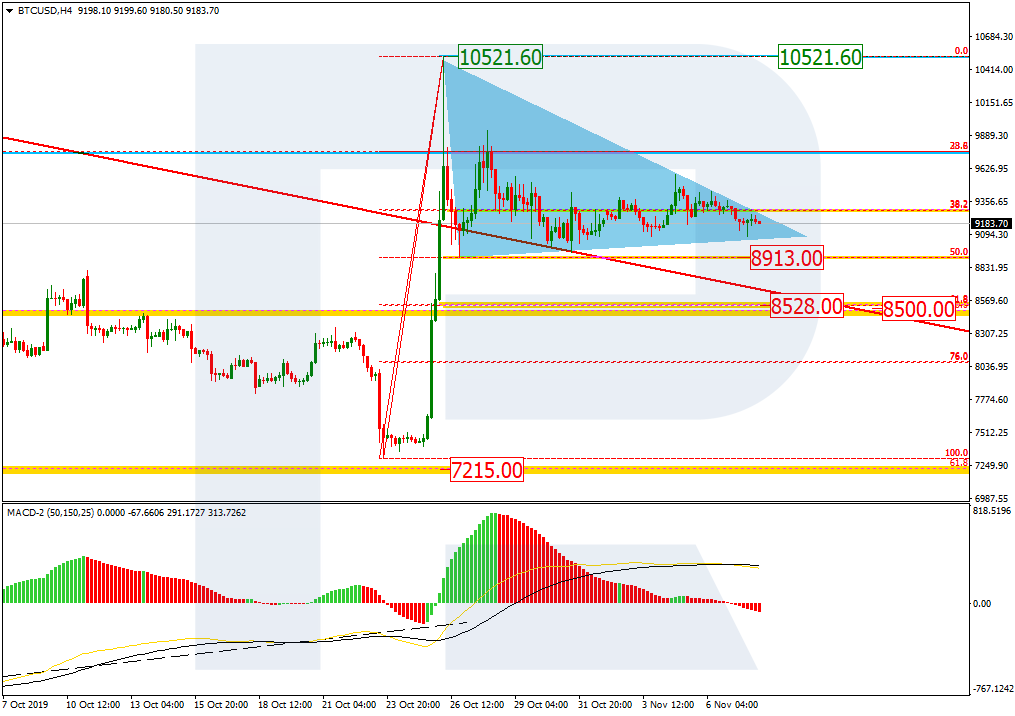
As we can see in the daily chart, BTCUSD is still correcting in the form of Triangle pattern. The previous impulse itself is the first part of the mid-term correction that started after the convergence. By now, the impulse has already reached 38.2% fibo. Later, the market may complete the current correction and resume growing towards the high at 10521.60, and 50.0% and 61.8% fibo at 10578.00 and 11345.00 respectively.
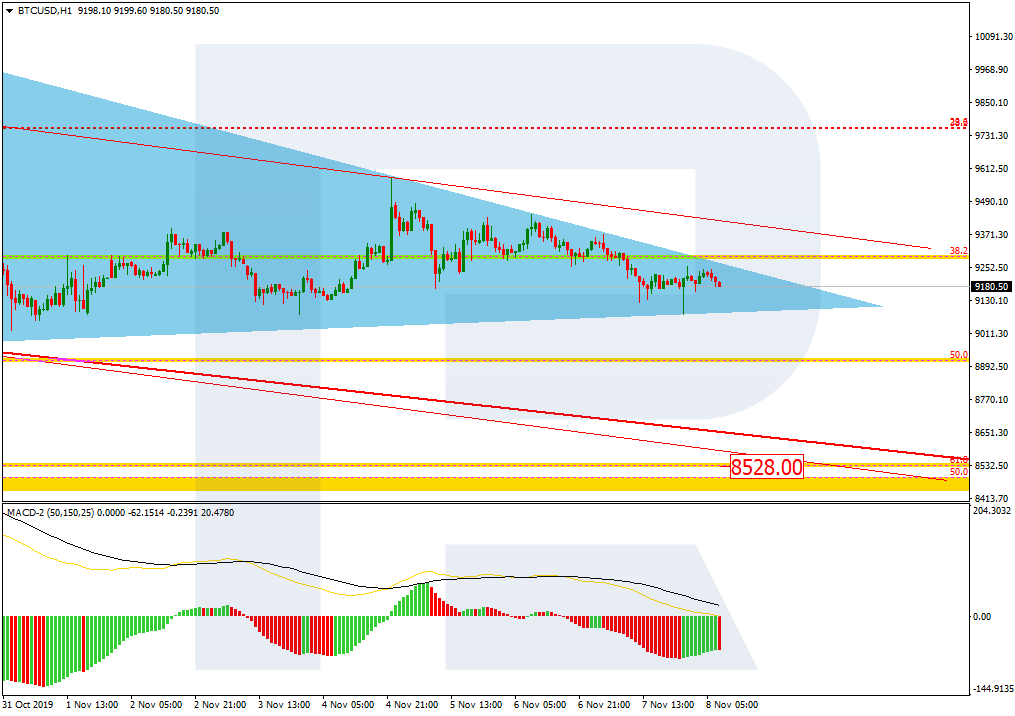
In the H1 chart, the current correction Triangle pattern is a descending one, which means that the decline may yet continue. By now, the pair has already reached 50.0% fibo. The next downside target may be 61.8% fibo at 8532.00. The resistance is the high at 10521.60.
ETHUSD, “Ethereum vs. US Dollar”
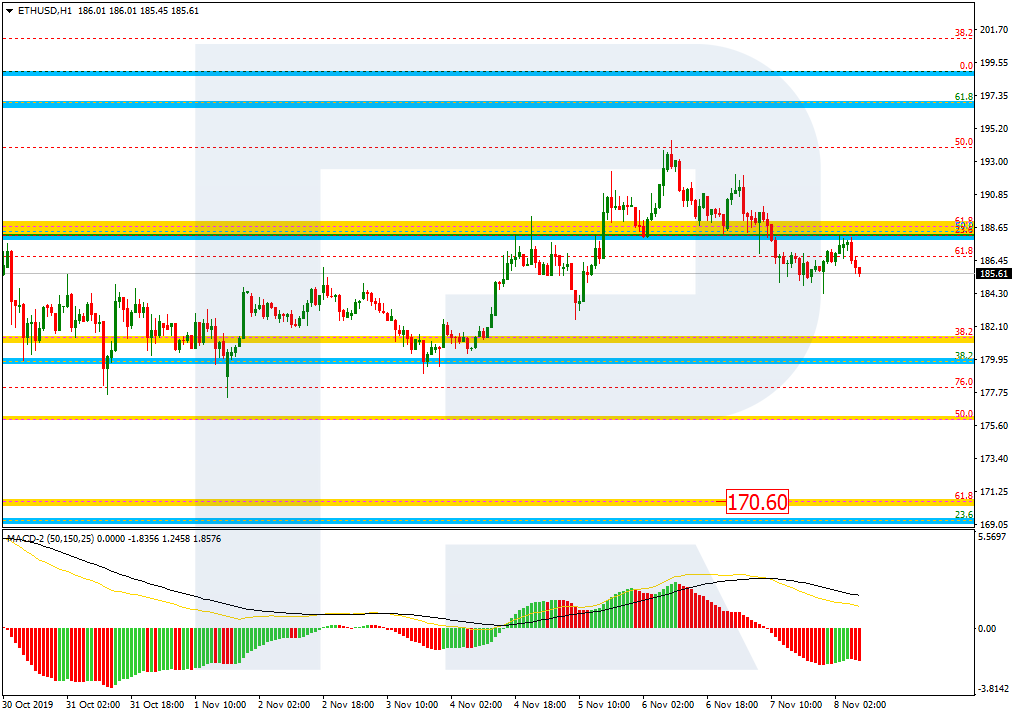
As we can see in the H4 chart, after reaching 50.0% fibo, ETHUSD is correcting upwards. If the price breaks the high at 198.94, the mid-term correction may continue towards 76.0% fibo at 207.04. However, if the price fails, the instrument may start a new descending wave towards 61.8% and 76.0% fibo at 170.60 and 164.00 respectively.
In the H1 chart, the instrument is forming a new short-term descending wave with the closest target at 61.8% fibo at 170.60.
Attention! Forecasts presented in this section only reflect the author’s private opinion and should not be considered as guidance for trading. RoboForex LP bears no responsibility for trading results based on trading recommendations described in these analytical reviews.
Bearish sentiment still prevails at the EUR/USD currency pair. The trading tool again updated local lows. The demand for USD remains at a high level due to the prospects for resolving the trade conflict between Washington and Beijing. The parties agreed to phase out the previously introduced duties. The European Commission has worsened the forecast for GDP growth in the eurozone from 1.2% to 1.1% this year. At the moment, EUR/USD quotes are consolidating in the range of 1.10350-1.10600. We do not exclude a further decline in the single currency. We recommend opening positions from key levels.
The Economic News Feed for 08.11.2019:
– Consumer Expectation and Sentiment Indices by University of Michigan (EU) – 17:00 (GMT+2:00);
Indicators signal the power of sellers: the price has fixed below 50 MA and 100 MA.
The MACD histogram is in the negative zone and below the signal line, which gives a strong signal to sell EUR / USD.
The Stochastic Oscillator is in the neutral zone, the %K line is above the %D line, which indicates bullish sentiment.
Trading recommendations
Support levels: 1.10550, 1.10250, 1.10000
Resistance levels: 1.10750, 1.10900, 1.11200
If the price consolidates below the level of 1.10550, expect the quotes to fall toward 1.10200-1.10000.
Alternatively, the quotes could rise toward 1.11000-1.11200.
The GBP/USD currency pair
Technical indicators of the currency pair:
Prev Open: 1.28528
Open: 1.28130
% chg. over the last day: -0.25
Day’s range: 1.28045 – 1.28224
52 wk range: 1.1959 – 1.3385
GBP/USD quotes continue to show a negative trend. The GBP hit 1.28 USD. The Bank of England, as expected, kept its key interest rate unchanged at 0.75%. At the same time, two members of the monetary policy committee voted to reduce it. At the moment, the GBP/USD currency pair is consolidating in the range of 1.28000-1.28350. The trading instrument has the potential to further decline. We recommend opening positions from key levels.
Today, the news background on the UK economy is calm.
The price fixed below 50 MA and 100 MA, which signals the power of sellers.
The MACD histogram is in the negative zone but above the signal line, which gives a weak signal to sell GBP/USD.
The Stochastic Oscillator is in the neutral zone, the% K line crossed the% D line. There are no signals at the moment.
Trading recommendations
Support levels: 1.28000, 1.27600
Resistance levels: 1.28350, 1.28600, 1.28900
If the price consolidates below the round level of 1.28000, expect a further descend toward 1.27700-1.27500.
Alternatively, the quotes could grow toward 1.28500-1.28700.
The USD/CAD currency pair
Technical indicators of the currency pair:
Prev Open: 1.31822
Open: 1.31734
% chg. over the last day: -0.04
Day’s range: 1.31716 – 1.31914
52 wk range: 1.2727 – 1.3664
An ambiguous technical pattern has developed on the USD/CAD currency pair. CAD is trading in a flat. Investors expect additional drivers. At the moment, the key support and resistance levels are 1.31600 and 1.32000, respectively. USD/CAD has prospects for growth. Today, financial market participants will evaluate important economic data from Canada. We also recommend paying attention to the dynamics of oil quotes. Open positions from key levels.
The Economic News Feed for 08.11.2019 is calm.
– Real Estate Market Report (CAD) – 15:30 (GMT+2:00);
– Labour Market Report (CAD) – 15:30 (GMT+2:00);
The price fixed above 50 MA and 100 MA, which signals the power of buyers.
The MACD histogram is in the positive zone, which gives a signal to buy USD/CAD.
The Stochastic Oscillator is in the overbought zone, the %K line crossed the %D line, which indicates a bearish sentiment.
Trading recommendations
Support levels: 1.31600, 1.31400, 1.31150
Resistance levels: 1.32000, 1.32300, 1.32500
If the price consolidates above 1.32000, expect the quotes to grow toward 1.32300-1.32500.
Alternatively, the quotes could decrease toward 1.31400-1.31200.
The USD/JPY currency pair
Technical indicators of the currency pair:
Prev Open: 108.962
Open: 109.277
% chg. over the last day: +0.28
Day’s range: 109.148 – 109.408
52 wk range: 104.97 – 114.56
Purchases prevail on USD/JPY currency pair. The trading instrument reached semi-annual highs. Demand for safe haven currencies remains at a rather low level against the backdrop of the prospects for resolving the trade conflict between the US and China. At the moment, USD/JPY quotes are consolidating. The local support and resistance levels are 109.150 and 109.500, respectively. We do not exclude further growth of the USD/JPY currency pair. Open positions from key levels.
During the Asian trading session Japan published a positive report on household spending
Indicators signal a bullish mood: the price has fixed above 50 MA and 100 MA.
The MACD histogram is in the positive zone, but below the signal line, which gives a weak signal to buy USD/JPY.
The Stochastic Oscillator is in the neutral zone, the %K line is above the %D line, which indicates bullish sentiment.
Trading recommendations
Support levels: 109.150, 108.850, 108.650
Resistance levels: 109.500, 109.800, 110.000
If the price consolidates above 109.500, expect further growth to 109.750-110.000.
Alternatively, the quotes could fall toward 108.900-108.700.
China wants Trump re-elected in 2020 to achieve medium-term and long-term economic objectives, affirms the CEO of one of the world’s largest independent financial advisory organizations.
The comments from Nigel Green, chief executive of deVere Group, come after China fuelled hopes that a deal can be reached to end its trade war with the U.S. after agreeing with Washington to roll back on some tariffs.
The deal to reduce trade tensions could encourage the International Monetary Fund (IMF) to revise up global growth forecasts next year.
Mr Green notes: “There has been an argument that in regard to the trade war, China was holding out, playing the long game and waiting for President Trump to leave office, before dealing with another administration.
“Whilst this argument might have held water before, I now believe this is not the case – and it is what is fueling recent developments in the trade war negotiations.”
He continues: “It is likely that China is currently fueling hopes to reach a phased agreement in the trade dispute with the U.S. and cancel tariffs as soon as possible because it will help President Trump’s re-election.
“His re-election would suit them for two major reasons.
“First, because they will assume that reaching a deal with Trump to end the damaging trade war will probably be easier than with some others. These include Elizabeth Warren, the potential Democratic rival, who could, say many supporters, win next year’s presidential election.
“Ms Warren can be expected to be even tougher with China than Trump, and not only on trade, but on other difficult issues, including climate change and human and labor rights.
“And second, despite the trade war, Trump’s policies and rhetoric have proven to be strategically helpful to China in achieving its longer-term goals.
“In many respects, President Trump has undermined Washington’s global credibility, international governance bodies and key alliances, and has been indifferent if not antagonistic towards major trading agreements.
“This all compromises America’s standing as the world’s primary superpower and it provides China with openings and opportunities it has previously never had in terms of global influence and setting international trade conventions.”
The deVere CEO concludes: “The positive signs coming from Beijing and Washington on the trade talks between the world’s two largest economies have been welcomed by stock markets – some reaching all-time highs this week.
“Investors’ exuberance will grow further still should the deal be cemented, and also should Trump be re-elected.
“However, U.S. investors should perhaps also question whether Mr Trump’s administration has, in fact, handed China a great strategic opportunity that could damage America’s preeminent superpower status in the longer-term and, therefore, its economic dominance.”
About:
deVere Group is one of the world’s largest independent advisors of specialist global financial solutions to international, local mass affluent, and high-net-worth clients. It has a network of more than 70 offices across the world, over 80,000 clients and $12bn under advisement
French and German trade balanced for September were weaker than expected. Will the EURUSD decline?
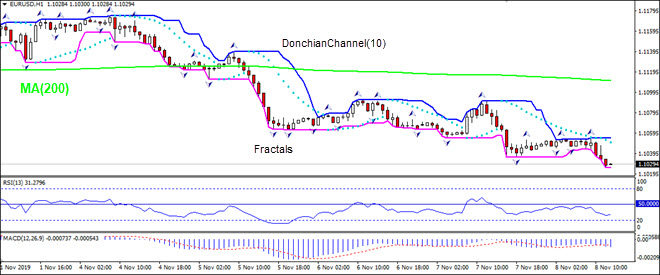
The price chart on 1-hour timeframe shows EURUSD: H1 is trading sideways. The price fell below the 200-period moving average MA(200) which is falling. And the RSI oscillator is below 50 level and has not reached the oversold zone. There is no trend yet formed, traders have to decide when it would be a best time to enter the market.
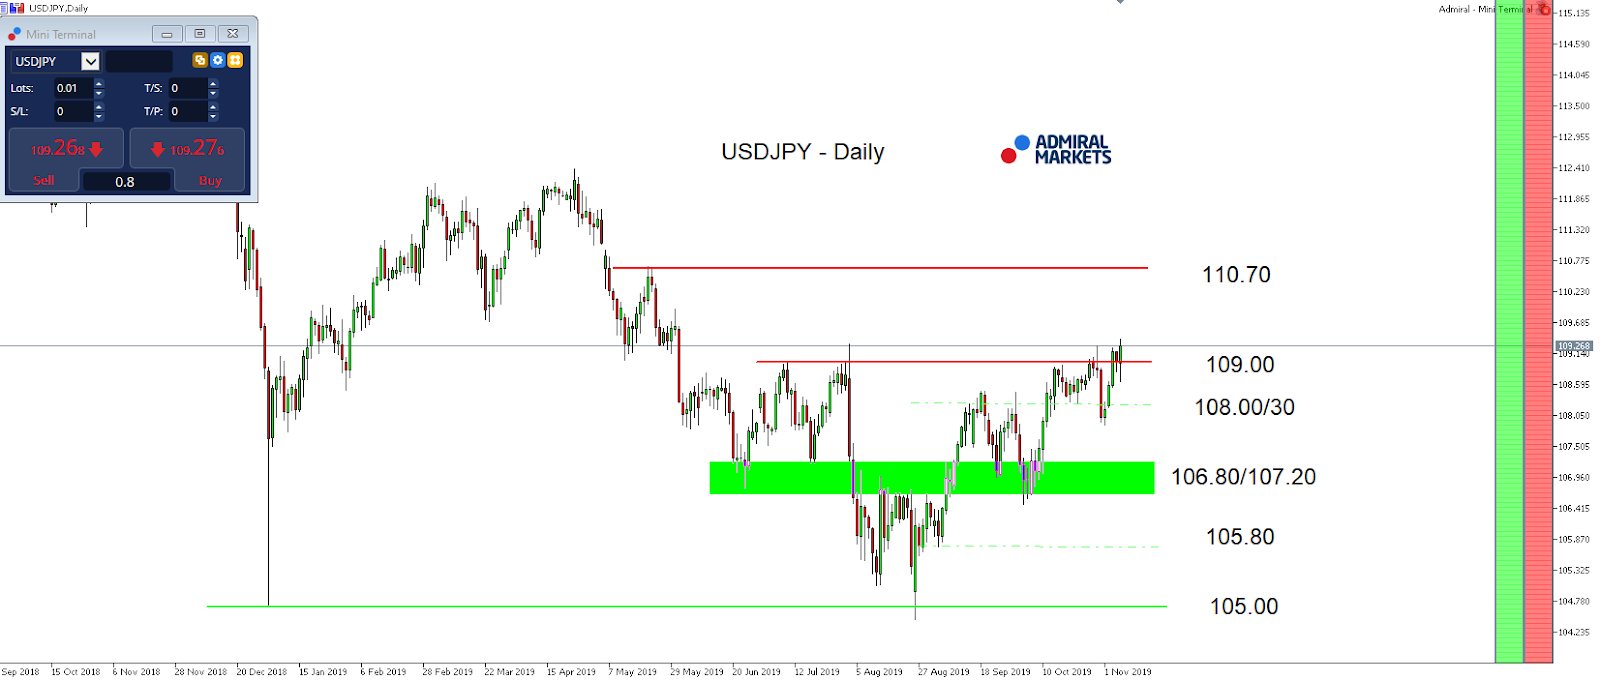
Into the weekly close, we want to have a look at USDJPY again. A potential trigger for volatility in the currency pair could be delivered by the Michigan Consumer Sentiment being publish today.
The data set is expected to continue the positive development of the last two months after the big disappointment in July with data coming in at the lowest level since 2016.
But what’s probably of higher importance is the development around 10-year US yields over the past days, which drove the currency pair back towards 109.00.
10-year US Treasury yields took on bullish momentum into the start of November, gaining over 20 basis points, driving the positively correlated USDJPY higher, too.
This could change if the next economic projection from the US (like today’s US Michigan Consumer Sentiment) comes in worse than expected, but also if tensions between the US and China start to re-gain momentum in regard to their current Phase-1 trade-deal negotiations.
On Thursday, the Chinese Commerce Ministry said that China and the US have agreed to cancel existing tariffs in different phases and if China and the US reach a Phase-1 Trade Deal, both sides must cancel existing tariffs at the same time with the same proportion based on the agreement.
Still, we have the feeling that especially the rising pressure on US president Trump in regards to the current impeachment developments, could result in the Chinese using these developments as a tool to put further pressure on the US and Trump, telling them to give up on all already imposed tariffs, or else they won’t negotiate on the Phase-1 deal, or anything that may follow.
That said, rising rate-cut speculation and/or risk-off-fears could result in any spikes above 109.00/30 in USDJPY to be not sustainable, but instead being a fake out, resulting in USDJPY go for another stint to the region around 108.00.
Source: Admiral Markets MT5 with MT5SE Add-on USDJPY Daily chart (between 21 September 2018 to 07 November 2019). Accessed: 07 November 2019 at 10:00 PM GMT
Please note: Past performance is not a reliable indicator of future results, or future performance.
In 2014, the value of USDJPY increased by 13.7%, in 2015, it increased by 0.5%, in 2016 it fell by 2.8%, in 2017 it fell by 3.6%, in 2018 it fell by 2.7%, meaning that after five years, it was up by 5.1%.
Disclaimer: The given data provides additional information regarding all analysis, estimates, prognosis, forecasts or other similar assessments or information (hereinafter “Analysis”) published on the website of Admiral Markets. Before making any investment decisions please pay close attention to the following:
This is a marketing communication. The analysis is published for informative purposes only and are in no way to be construed as investment advice or recommendation. It has not been prepared in accordance with legal requirements designed to promote the independence of investment research, and that it is not subject to any prohibition on dealing ahead of the dissemination of investment research.
Any investment decision is made by each client alone whereas Admiral Markets shall not be responsible for any loss or damage arising from any such decision, whether or not based on the Analysis.
Each of the Analysis is prepared by an independent analyst (Jens Klatt, Professional Trader and Analyst, hereinafter “Author”) based on the Author’s personal estimations.
To ensure that the interests of the clients would be protected and objectivity of the Analysis would not be damaged Admiral Markets has established relevant internal procedures for prevention and management of conflicts of interest.
Whilst every reasonable effort is taken to ensure that all sources of the Analysis are reliable and that all information is presented, as much as possible, in an understandable, timely, precise and complete manner, Admiral Markets does not guarantee the accuracy or completeness of any information contained within the Analysis. The presented figures refer that refer to any past performance is not a reliable indicator of future results.
The contents of the Analysis should not be construed as an express or implied promise, guarantee or implication by Admiral Markets that the client shall profit from the strategies therein or that losses in connection therewith may or shall be limited.
Any kind of previous or modeled performance of financial instruments indicated within the Publication should not be construed as an express or implied promise, guarantee or implication by Admiral Markets for any future performance. The value of the financial instrument may both increase and decrease and the preservation of the asset value is not guaranteed.
The projections included in the Analysis may be subject to additional fees, taxes or other charges, depending on the subject of the Publication. The price list applicable to the services provided by Admiral Markets is publicly available from the website of Admiral Markets.
Leveraged products (including contracts for difference) are speculative in nature and may result in losses or profit. Before you start trading, you should make sure that you understand all the risks.
On Thursday the 7th of November, trading on the euro closed down. Volatility was high during the European session. The rise to 1.1092 was brought about by news from China, while the subsequent drop to 1.1036 was caused by the Bank of England meeting.
China and the US have agreed to phase out the tariffs imposed over the course of the trade conflict. This was announced by the Chinese trade minister. The news increased the market’s appetite for risk. The meeting between the US and Chinese presidents Donald Trump and Xi Jinping has been pushed back to next month.
The Bank of England left interest rates at their current level of 0.75%. Two members of the MPC (Saunders and Haskell) out of 9 voted to reduce rates by 25 base points. This came as a shock to many. The GBPUSD pair dropped by 73 pips to reach 1.2794, dragging down the other majors with it and cancelling out the effect of the news from China.
Day’s news (GMT+3):
10:00 Germany: trade balance (Sep).
16:30 Canada: unemployment rate (Oct), net change in employment (Oct).
18:00 US: Michigan consumer sentiment index (Nov).
Current situation:
Despite the positive news from China and the following rise to 1.1092, the pair missed our target from the 6th of November.
The euro is currently trading at 1.1051, with the 112th degree providing support. The current situation is similar to the 6th of November, so we’ve taken a similar formation as the basis for today’s forecast, in which we expect a rise to the LB balance line at 1.1070, followed by a drop to the 135th degree at 1.1017. The forecast is for Friday and Monday.
On the H4 and H8 timeframes, the indicators point towards an upwards correction, so we don’t expect to reach fresh lows today. If we look at futures on the euro (6EZ19), there are a lot of major sales on the market. There’s not much in the economic calendar today, so pay more attention to technical analysis.
Investors seek clarity on conflicting trade reports
Sterling sinks on dovish BOE
Gold hammered by risk-on sentiment
After 18 months of painful trade disputes between the United States and China, there is finally a glimmer of hope with both sides moving closer to a deal that could resuscitate global growth.
A wave of positivity initially flooded financial markets on news that the US and China agreed to roll back tariffs as part of the Phase I deal. However, this optimism was later tempered by reports that the White House’s plan to rollback China tariffs was facing fierce internal opposition. Although most remain cautiously optimistic that a trade deal is still on the horizon, conflicting messages between both sides could strain investor confidence and dampen global sentiment.
This is already being reflected in Asian markets on Friday morning with mixed performance as investors attempt to gain clarity on the current trade developments. The cautious mood from Asia has the potential to infiltrate into European markets later this morning.
Dovish Bank of England compounds to Sterling’s woes
Buying sentiment towards the British Pound deteriorated on Thursday after the Bank of England’s Monetary Policy Committee surprised investors with two dissenters calling for rate cuts, the first time this has happened since July 2016.
Although it was widely expected that interest rates will be left unchanged in November, the gloomy growth outlook and two dissents fueled expectations over a possible interest rate cut during the first quarter of 2020. Given how the Bank of England downgraded growth forecast for 2020 to 1.2% from 1.3%, and to 1.8% in 2021 from 2.3%, the British Pound could see more pain and punishment down the line. While the prospects of lower interest rates in the UK should also compound to Sterling’s woes, investors are clearly more concerned with the fate of Brexit.
Will the United Kingdom be able to confirm a Brexit deal before the January 2020 deadline or is a no-deal Brexit back on the horizon? As Parliament has been dissolved ahead of the General Election on December 12, more Pound volatility will certainly be on the cards for the rest of 2019 as traders monitor the latest election polls.
Focusing on the technical picture, the GBPUSD looks weak on the weekly charts with prices struggling to keep above the 1.2800 support level. A close below this point should encourage a decline towards 1.2700 in the near term.
Commodity spotlight – Gold
It has been a painfully bearish trading week for Gold thanks to renewed optimism over US-China trade talks and improving market mood. Investors have been injected with renewed sense of confidence this week, ultimately reducing appetite for safe haven assets like Gold. The precious metal has shed over 2.8% over the past 5 days and could weaken further if trade hopes fuel the risk-on sentiment.
With regard to the technical picture, Gold is bearish on the daily charts. A breakdown below $1470 should encourage a move towards $1460 and $1450.
Disclaimer: The content in this article comprises personal opinions and should not be construed as containing personal and/or other investment advice and/or an offer of and/or solicitation for any transactions in financial instruments and/or a guarantee and/or prediction of future performance. ForexTime (FXTM), its affiliates, agents, directors, officers or employees do not guarantee the accuracy, validity, timeliness or completeness, of any information or data made available and assume no liability as to any loss arising from any investment based on the same.
The short-term outlook for the Canadian company is provided in a CIBC report.
In an Oct. 25 research note, CIBC analyst Oscar Cabrera wrote that Lundin Mining Corp. (LUN:TSX) “continues to offer investors an attractive combination of a strong balance sheet, operating execution and financed brownfield growth.”
This view comes after the metals producer posted “strong operating performance” in Q3/19, “supporting completion of expansion projects” and CIBC adjusted its model accordingly, Cabrera added.
Upcoming near- and medium-term catalysts for Lundin Mining are development progress at Candelaria and Neves Corvo and expansion progress at Chapada via exploration. Lundin has a site visit scheduled at Chapada on Nov. 8, Cabrera reported.
The analyst commented that how Lundin Mining next allocates capital, whether to continued growth or to shareholders, “will be important to rerate” the company’s shares. Further, expansion potential at Chapada should improve Lundin’s valuation that currently trails that of its peers.
CIBC has an Outperformer rating and a CA$8 per share target price on Lundin, whose stock is currently trading at around CA$7.33 per share.
Disclosure: 1) Doresa Banning compiled this article for Streetwise Reports LLC and provides services to Streetwise Reports as an independent contractor. She or members of her household own securities of the following companies mentioned in the article: None. She or members of her household are paid by the following companies mentioned in this article: None. 2) The following companies mentioned in this article are billboard sponsors of Streetwise Reports: None. Click here for important disclosures about sponsor fees. 3) Comments and opinions expressed are those of the specific experts and not of Streetwise Reports or its officers. The information provided above is for informational purposes only and is not a recommendation to buy or sell any security. 4) The article does not constitute investment advice. Each reader is encouraged to consult with his or her individual financial professional and any action a reader takes as a result of information presented here is his or her own responsibility. By opening this page, each reader accepts and agrees to Streetwise Reports’ terms of use and full legal disclaimer. This article is not a solicitation for investment. Streetwise Reports does not render general or specific investment advice and the information on Streetwise Reports should not be considered a recommendation to buy or sell any security. Streetwise Reports does not endorse or recommend the business, products, services or securities of any company mentioned on Streetwise Reports. 5) From time to time, Streetwise Reports LLC and its directors, officers, employees or members of their families, as well as persons interviewed for articles and interviews on the site, may have a long or short position in securities mentioned. Directors, officers, employees or members of their immediate families are prohibited from making purchases and/or sales of those securities in the open market or otherwise from the time of the interview or the decision to write an article until three business days after the publication of the interview or article. The foregoing prohibition does not apply to articles that in substance only restate previously published company releases.
Disclosures from CIBC, Lundin Mining Corp., October 25, 2019
Analyst Certification: Each CIBC World Markets Corp./Inc. research analyst named on the front page of this research report, or at the beginning of any subsection hereof, hereby certifies that (i) the recommendations and opinions expressed herein accurately reflect such research analyst’s personal views about the company and securities that are the subject of this report and all other companies and securities mentioned in this report that are covered by such research analyst and (ii) no part of the research analyst’s compensation was, is, or will be, directly or indirectly, related to the specific recommendations or views expressed by such research analyst in this report.
Analysts employed outside the U.S. are not registered as research analysts with FINRA. These analysts may not be associated persons of CIBC World Markets Corp. and therefore may not be subject to FINRA Rule 2241 restrictions on communications with a subject company, public appearances and trading securities held by a research analyst account.
Potential Conflicts of Interest: Equity research analysts employed by CIBC World Markets Corp./Inc. are compensated from revenues generated by various CIBC World Markets Corp./Inc. businesses, including the CIBC World Markets Investment Banking Department. Research analysts do not receive compensation based upon revenues from specific investment banking transactions. CIBC World Markets Corp./Inc. generally prohibits any research analyst and any member of his or her household from executing trades in the securities of a company that such research analyst covers.Additionally, CIBC World Markets Corp./Inc. generally prohibits any research analyst from serving as an officer, director or advisory board member of a company that such analyst covers.
In addition to 1% ownership positions in covered companies that are required to be specifically disclosed in this report, CIBC World Markets Corp./Inc. may have a long position of less than 1% or a short position or deal as principal in the securities discussed herein, related securities or in options, futures or other derivative instruments based thereon.
Recipients of this report are advised that any or all of the foregoing arrangements, as well as more specific disclosures set forth below, may at times give rise to potential conflicts of interest.
Important Disclosure Footnotes for Lundin Mining Corp. (LUN)
· CIBC World Markets Inc. expects to receive or intends to seek compensation for investment banking services from Lundin Mining Corp. in the next 3 months.