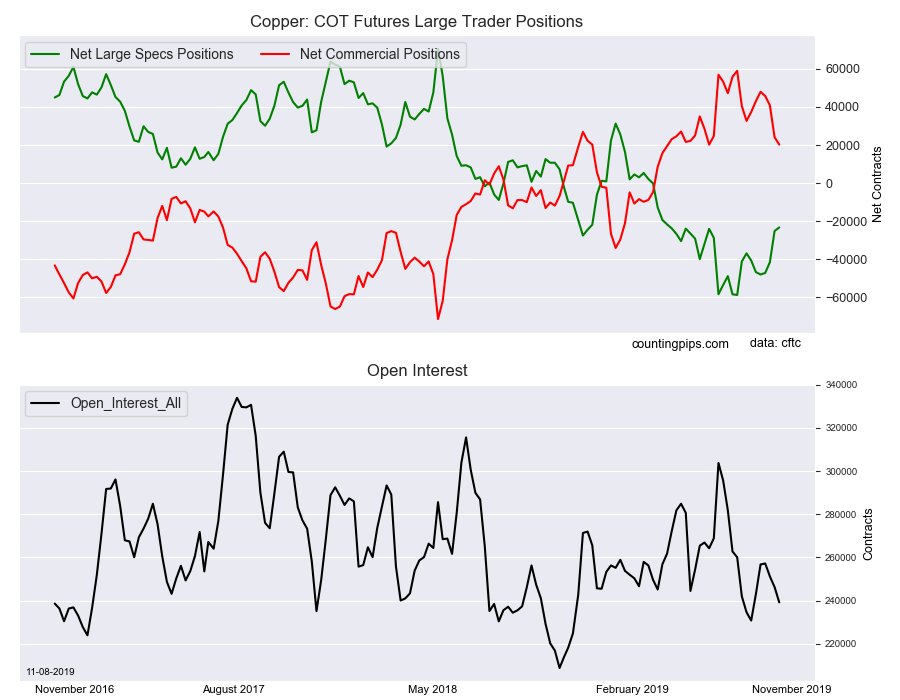
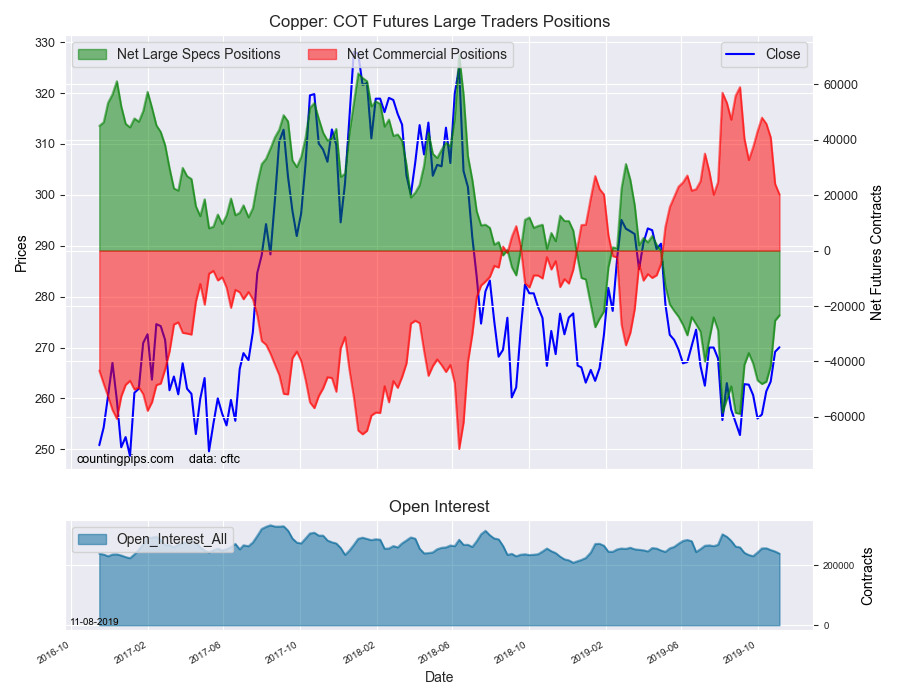
Large precious metals speculators once again cut back on their bearish net positions in the Copper futures markets this week, according to the latest Commitment of Traders (COT) data released by the Commodity Futures Trading Commission (CFTC) on Friday.
The non-commercial futures contracts of Copper futures, traded by large speculators and hedge funds, totaled a net position of -23,311 contracts in the data reported through Tuesday November 5th. This was a weekly change of 1,914 net contracts from the previous week which had a total of -25,225 net contracts.
The week’s net position was the result of the gross bullish position (longs) gaining by 4,838 contracts (to a weekly total of 81,652 contracts) while the gross bearish position (shorts) rose by a lesser amount of 2,924 contracts for the week (to a total of 104,963 contracts).
Copper speculators continued to reduce their bearish bets for the fourth straight week and now by a total of 24,782 contracts over these past four weeks. The current bearish position (-23,311 contracts) is now less than half of the recent record high bearish position that was recorded on September 3rd at a total of -58,841 contracts.
Copper Commercial Positions:
The commercial traders position, hedgers or traders engaged in buying and selling for business purposes, totaled a net position of 20,249 contracts on the week. This was a weekly decline of -3,845 contracts from the total net of 24,094 contracts reported the previous week.
Copper Futures:
Over the same weekly reporting time-frame, from Tuesday to Tuesday, the Copper Futures (Front Month) closed at approximately $270.05 which was an uptick of $0.90 from the previous close of $269.15, according to unofficial market data.
*COT Report: The COT data, released weekly to the public each Friday, is updated through the most recent Tuesday (data is 3 days old) and shows a quick view of how large speculators or non-commercials (for-profit traders) as well as the commercial traders (hedgers & traders for business purposes) were positioned in the futures markets.
The CFTC categorizes trader positions according to commercial hedgers (traders who use futures contracts for hedging as part of the business), non-commercials (large traders who speculate to realize trading profits) and nonreportable traders (usually small traders/speculators).
Welcome to this week’s Market Wrap Podcast, I’m Mike Gleason.
Coming up, David Jensen of Jensen Strategic joins me for a revealing conversation on why he believes we’ve passed the point of no return when it comes to monetary policy, how the recent injection of liquidity by the Fed will NOT be able to reverse the problems it’s been creating, and why the explosion in palladium prices is a foreshadowing some BIG developments in the gold and silver markets. So stick around for a must-hear interview with David Jensen, coming up after this week’s market update.
A rising U.S. dollar is putting downward pressure on precious metals prices this week.
On Thursday, gold and silver markets took a beating under a confluence of adverse forces. In addition to dollar strength versus foreign currencies, trade optimism and rising bond yields drew investors out of precious metals.
As of this Friday recording, gold is settling lower by $46 or 3.2% for the week to come in at $1,468 per ounce. Silver, meanwhile, re-tested the $17.00 level during Thursday’s selling. The white metal now at $17.02 an ounce and is registering a whopping weekly decline of $1.18 or 6.5%.
Turning to the PGMs, platinum is down similarly to silver, off $60 or 6.3% this week to trade at $894. And palladium is off 3.3% to come in at $1,756 per ounce.
Metals lost some of their safe-haven appeal after China and the United States reportedly reached an agreement to cancel some of the tariffs imposed by both sides in recent months. A ramping down of the trade war was deemed by investors to be good news for the U.S. economy, which has experienced a slowdown in the manufacturing sector.
Investors apparently perceive the risk of a recession to be waning, at least for now. That is being reflected in a steepening yield curve.
Back in August, the yield curve had inverted, meaning some longer-term Treasuries yielded less than shorter-term paper. Much talk about a looming recession followed in the media. One still may be coming. In the past, recessions have occurred several months to a year after an inversion.
Meanwhile, the Federal Reserve has cut short-term rates to try to stave off a recession. It has also committed hundreds of billions of dollars to repo and Treasury bill markets to keep overnight rates from rising above target.
This week, long-term bond yields spiked. The 30-year Treasury saw a yield above 2.4% for the first time since July. The 10-year yield jumped past 1.9% on Thursday in its biggest move since the day after Donald Trump was elected in November 2016.
Interest rate sensitive sectors of the stock market, including real estate and utilities, got clobbered as sector rotation took place. In favor were sectors included energy, technology, and cyclicals.
On the plus side for hard asset investors, industrial commodities including copper benefited from the “risk on” trade. Copper prices rose Thursday to a three and half month high.
If you’re bullish on the global economy in general – and perhaps the prospects for Trump’s trade policies boosting U.S. industries in particular – then copper may be a good play.
Rising demand for copper threatens to outweigh its supply. Miners are finding less copper on digs, and low spot prices have deterred development of new copper sources.
This year has seen copper prices make little progress. They have dipped into a trading range, but that trading range is now showing signs of resolving to the upside.
Physical copper can play a relatively small but vital role within a diversified investment portfolio. Like gold and silver, copper has been used in coinage and serves as a store of value over time.
In fact, U.S. pennies minted prior to 1982 are one of the handiest and most straightforward ways to own physical copper, including the lowest cost way to purchase the metal.
Money Metals Exchange also offers pure copper rounds, including our new copper President Trump round. They are .999 pure copper bullion and commemorate the 45th President of the United States, Donald J. Trump.
Money Metals sells these Trump Copper Rounds in full tubes of 20. They will serve as the perfect gift for anyone who loves our 45th president.
There’s no denying President Trump is one of the more controversial political figures in American history, so this type of commemorative item just may well be in high demand for a long time to come.
Of course, if you’re just looking to accumulate bullion while keeping a low profile and not drawing any unwanted negative attention to yourself, you might prefer to opt for a more politically neutral product.
Bullion bars are a plain but efficient way to accumulate any of the metals we offer – from copper to gold, silver, platinum, palladium, and even rhodium. Check out our complete product lineup and take advantage of the recent price dip by going to MoneyMetals.com.
Well now, without further delay, let’s get right to this week’s exclusive interview.
Mike Gleason: It is my privilege now to welcome in David Jensen of Jensen Strategic and a highly studied mining analyst and precious metals expert with close to two decades of experience in the mining industry. And it’s great to have him back on with us.
David, thanks so much for the time again today, and it’s nice to talk to you again. Welcome.
David Jensen: Thank you, Mike. It’s good to be back with you again.
Mike Gleason: Well, David, we had you back on at the beginning of the year and you shared some amazing insights on palladium, and we’ll get to that in a bit because that market is still very interesting. But first off, you’ve been watching the Fed balance sheet closely here and I wanted to get your comments about that to begin with. Now, after the extraordinary expansion, which followed the 2008 financial crisis and a few rounds of QE, the Fed began contracting the money supply in 2017. You’ve been making the case that the withdrawal of liquidity could trigger another catastrophe.
So, let’s start with the basics here. If you would, please explain the history of the Fed’s balance sheet, and why it is something investors should be carefully watching.
David Jensen: Yeah, I think that the root of it all, the reason we’re watching so closely is the tremendous imbalance between the amount of cash, liquid cash that’s in the system versus the amount of debt. And the Fed has run interest rates from around 20% in 1980 down to 0% or 0.25% here a couple of years ago. And what they’ve done is expanded the greatest debt bubble in history. The total debt in the U.S., now on all levels according to the Fed’s flow of funds report is about $72 trillion. And to serve as that $72 trillion of debt that’s in extent, there’s only $14 trillion of liquid currency in deposits and in physical cash. So, what we’re seeing now is that the Fed needs to continually to expand the money stock with the money supply. The money supply is the annual change or the addition to the outstanding money stocked addition to the $14 trillion that’s out every year. And they need to add a substantial amount so that the debt can be serviced and so that the economy can continue to move forward.
And what they’ve done in the last three years, since Q1 2017, they’ve contracted the money supply, which is, again, the year over year change, they’ve decreased that increase down to about 3% from roughly about 11% in Q4 2016. So really a precipitous drop.
And so what we’re seeing now is that the rise of the interest rates and the, and the cutoff of the money supply, they’ve basically withdrawn about a one and a half trillion dollars of additional liquidity, which would be here if it continued to run it at the same run rate as in Q4 2016. So, they’ve withdrawn or tightened a substantial amount. And as interest rates go up, it also, over time, generates a need for about another $2 trillion per annum in interest payments. So what they’ve done is they’ve really created a liquidity crisis here in the market. There’s not enough money to pay the debt that’s outstanding. And, of course, the most levered or the most unstable borrowers show the distress first when these things happen. And that’s what we saw in the repo market here in September, was that that market started to seize up because the capital wasn’t there to meet the needs.
Mike Gleason: Kind of leads me right into my next question. The Fed has really been pumping lots and lots of money into that repo market and they’ve extended it multiple times. You see this intervention in the repo markets as the “first domino to fall,” and what might be the next financial crisis. The Fed, is as usual, not bothering to explain itself, but we know that, we’re pretty sure, that it isn’t good. Give us some more of your insights on that repo market intervention and why it could be the signal of larger troubles ahead.
David Jensen: Yeah, it’s a signal of illiquidity in the financial market. So any borrower of size, a hedge fund or a money manager, a bank can step into that market and borrow in that market in return for providing collateral, whether it’s a treasury or some other type of security. And that market basically dried up because the liquidity was not there, it wasn’t available. But the issue that I really see is at the core of this, is that leverage loan market, which is the most highly indebted borrowers. And that market collapsed in Q1 2008 and kicked off the great financial crisis. And that market, now, there’s a tremendous decay in the credit worthiness of the borrowers in that market. So we’re seeing the signs here that there’s a collapse in the credit worthiness of the most highly leveraged in society.
And just to give you a sense of the repo market, Mike, it’s about a $5 trillion market and about three and a half to $4 trillion of that rolls on a nightly basis. So they’re just 24 hour loans. So any kind of a seizure in that market can cause great problems in the financial markets as a whole. But the greater question is, is why is this market seizing up to begin with? What is the problem here? And the problem that I maintain is this continual drying out of the economy and taking away liquidity from the economy that’s gone on ever since the beginning of 2017.
Mike Gleason: So, the Fed’s created a problem by contracting the money supply. Is there any chance that this sudden about-face, the repo market interventions and the new bond purchase program, that we’re not supposed to call Kiwi four, by the way, will that be enough to prevent disaster, David?
David Jensen: Well, you’re talking about a net shortfall that’s occurred now in the order of trillions of dollars. And it takes years for monetary policy changes to impact the economy as a whole. So, you’ve got many trillions and it has to basically infiltrate the economy, the money expansion as it occurs has to disperse throughout the economy and be utilized. And we’re at the point now where so many of the unstable bubble activities have been tripped out. I believe that they’re not going to be able to address this with monetary policy, it just takes too long and the drying out of the economy of monetary liquidity has gone on for too long to date. The damage is already done.
Mike Gleason: Yeah, we would agree. It’s going to be interesting to watch things continue to unfold there, but we know that we don’t know the full story, I think, when it comes to all this repo market stuff.
Well, turning to palladium now, we had you on back in January of this year. And we spoke quite a bit about the palladium situation. At the time, there was a major supply shortage in that market and since then, things haven’t changed too much and we’ve seen the price of palladium go from a little over $1,300 back in January to nearly $1,800 here today. So what’s the latest on palladium and why have we seen this amazing resilience? Because not many in the metals community would have expected the meteoric rise to continue and then see it remain so firm and never really show signs of cracking or experiencing any real pullback, to speak of. So what’s going on with palladium now, David?
David Jensen: Well, it’s a good old fashioned shortage. The conundrum or the question is, why is there a metal shortage when the auto industry is in free fall? About 80% of palladium is used in catalytic converters in automobiles. And you would think that the demand would decline along with the production of autos. But I think there’s another dynamic at play here, is that the Eurozone have been practicing very loose monetary policies, as many of the banks around the world. And I think that at the margins, these are very small markets compared to the amount of capital out there. All the gold in the world is worth just one or 2% of the total capital markets out there. So, what we’re seeing now with palladium, which is a fraction of the size of the gold market, I mean, the above ground stocks are nothing and annual production is in the order of about a 10th of the amount of gold.
But I think what’s happening here that’s driving the shortage, and since we talked in January, the lease rates have started to spike up again. We’re now seeing the lease rates, on average, in and around the 8% level. So in London where this metal is traded and where there’s actual delivery of metal, is insufficient metal there to meet the market demand. But I think that there’s demand, it’s not just auto demand that’s out there. I think that if you look back in 2016, the German government went negative with the bunds there for the first time, the market did. And I think what you have is just that at the margins, enough investors start to buy real assets, including these intrinsically valuable assets like palladium and platinum, gold and silver.
But that the palladium market was already tight to begin with. We’d run over two years there where there was visible shortage and lease rate spikes in the market. The gold, silver, platinum, palladium market, they all trade promissory notes, not the metal. So, the pricing can be anywhere. But when you have metal shortages, with palladium, you can’t manipulate the market with paper anymore. You try to sell a load of paper, a promissory note as these spot contracts are these unallocated spot contracts. When you have physical metal shortage, those that you’ve sold the contracts to say, “Okay, we’d like to take delivery of the bars now.” And you have a default situation arising.
So the games can’t be played in the market when you have shortage as you do with rhodium, which is a sister metal. It’s not traded on exchanges, same applications as a palladium. It’s gone up nine times now in the last three years and palladium has roughly tripled in price. So, there’s been really tremendous price moves here, driven by good old-fashioned supply and demand dynamics. Pushing aside paper pricing, using these unallocated promissory notes in the COMEX and especially in London, which is the primary physical exchange.
Mike Gleason: So, how might all this affect gold and silver, which are obviously the much bigger markets and the precious metals that most of us pay more attention to. What kind of spillover effect might the situation in palladium have on the money metals? And what can we portend, potentially, as this relates to gold and silver?
David Jensen: Well, the, the spillover effect, I think, really comes from the central banks. They’ve run monetary policy now that has been, I think, wild is the kindest way to describe it, over the last 50 years especially. But they’ve run the debt market up so high and the bond market up so high. And this monetary inflation has been parked in these financial markets, especially in the bond markets. Now, what the Fed has done by choking off the money supply, they’ve, in essence, lit a fire in the bond market. Because when you trip the economy into a gross contraction, what happens is that you run enormous deficits. And in the end, you will not be able to have the demand in the market for the treasuries or whatever government security that you’re selling, and it leads to financing just by monetizing the debt.
So in essence, Mike, the demand comes from the central bank money supply or looseness of their monetary policy. It’s hidden for a very long time because the financial markets climb. They get their rulers out and they project for decades how high they’ll go. But eventually, you get to the point where you can’t stimulate the markets higher anymore because of the tremendous distortion built into the economy.
And as I maintain, really the crisis that we’re going to have now from the credit limitation that’s gone on for the last three years here. So, those holding the paper assets like bonds and other securities see that we’re in for a growth slowdown with even more gross money printing by the central banks. And that’s when you start seeing the movement from the paper holders into real assets of intrinsic value. And I think, then, what you have is just a tremendous vault in the price of these metals. But I think it will probably lead to some sort of a of a dislocation at these exchanges, which are so heavily papered and have only a tiny fraction of the amount of metal there for the number of contracts which are held in the spot markets there.
Mike Gleason: Yeah. Obviously the palladium market seems to be a market right now where supply and demand fundamentals do exist and it’s driving the price. And wouldn’t it be something if maybe that finally happened with silver, which unfortunately can be pushed around with all the paper that they seem to create there.
David Jensen: It will come. It will come to the silver market. It’ll come to the platinum and gold market. It just takes a little bit longer because they’re not quite as tight as the palladium market.
Mike Gleason: Well finally, David, as we begin to wrap up, give us an early 2020 outlook, if you would, what kind of a year do you expect it to be in the markets and the metals, specifically? And then also comment on anything else that you’re going to be watching most closely as you continue to analyze the state of the financial world.
David Jensen: Yeah. Well, I mean anything can happen in the metals market in terms of price wise. But at some point, the basic papering of the market is going to fail. Now people have been calling for that for decades. But I do think, Mike, what’s very different here is the fact that the Fed has acted as radically as it has over the last three years in contracting the money supply to the level that is well known to have caused the prior three crises. And if your listeners go to @RealDavidJensen on Twitter, the first thing that’s posted in there as a chart of the money supply, how that’s contracted and how that led to crises the last three times. So my sense is that we’re going to have a breakage at some point in these markets and the printing is going to be enormous. But also that there’ll be a sizeable amount of chaos and carnage.
So not good news. The last thing you want is metals to go up because you have a tremendous crisis on your hands. But I think that’s what the Fed really has created here. The narrative that we’re getting from the financial media is that it’s about Trump and trade. And so many of the comments are about Trump this and Trump that. And really, the core of it all, the essence of it all is the central bank, the failure of money, money printing, and the failure of using dilution of currency as a way to “stimulate” your economy. It’s never worked. It’s a complete fraud the way these systems are run and it’s time for a new monetary system.
Mike Gleason: Yeah, I couldn’t agree more and very well put. The next several years, figure to be very, very interesting, indeed. And we’ll see how will that all transpires and unfolds and look forward to having you back on to dissect it more. We’ll leave it there for today.
I thank you very much for your time and for coming back on and for sharing your insights. And I look forward to talking to you again down the road. Have a great weekend and take care, David.
David Jensen: Thanks Mike. It was my pleasure.
Mike Gleason: Well that will do it for this week. Thanks again to David Jensen of Jensen Strategic. You can follow David on Twitter @RealDavidJensen, be sure to check that out.
And check back here next Friday for our next Weekly Market Wrap Podcast. Until then, this has been Mike Gleason with Money Metals Exchange. Thanks for listening and have a great weekend, everybody.
The Money Metals News Service provides market news and crisp commentary for investors following the precious metals markets.
The company is moving ahead with uranium exploration in the high-grade Athabasca Basin amid a changing supply and demand paradigm.
Uranium development company Skyharbour Resources Ltd. (SYH:TSX.V; SYHBF:OTCQB) holds six projects in the Athabasca Basin in northern Saskatchewan, home of the highest grade depository of uranium in the world.
The company has been actively exploring and drilling the flagship Moore Lake project over the last several years and is planning an upcoming program that holds the potential to be a key catalyst in the near term. It acquired the project from the company’s largest shareholder and strategic partner, Denison Mines. Denison CEO David Cates sits on Skyharbour’s board.
For its other five projects, Skyharbour employs prospect generation, bringing in partner companies to advance and fund exploration. Currently Skyharbour has deals on two projects. Orano, France’s largest uranium mining and nuclear company, is spending up to $8 million to earn up to a 70% interest on the Preston project. That project is located next to Fission Uranium and Nexgen’s high-grade properties. Plans for a 2020 exploration program are expected to be announced shortly. “Orano has been pretty aggressive with the exploration carrying out several drill and work programs over the past few years. They are a large company with a long history in the Athabasca Basin making them a great strategic partner to have,” Skyharbour CEO Jordan Trimble told Streetwise Reports.
Skyharbour’s other partner is Azincourt Energy, which is smaller, and in a 2017 deal, the company can earn in 70% of the East Preston project by spending $3.5 million. Azincourt recently announced a 2,500-meter drill program slated to start later this year or early next year. “Azincourt has conducted a lot of reconnaissance work over the last few years to get these targets. So it’s an important program for both them and us,” Trimble stated.
At Skyharbour’s flagship, high-grade Moore Lake project, the company plans on initiating a 2,500-meter drill program early in the new year. “This could very well be our most important drill program on the project and the reason for that is we are now primarily testing basement-hosted targets that have been refined by new geophysical techniques,” Trimble said. “When you look at most of the major discoveries that have been made recently in the Athabasca BasinDenison, NexGen, Fissionthese are all high-grade uranium deposits that are hosted in the underlying basement rocks.”
Historically, a lot of the drilling and exploration was focused in the overlying Athabasca sandstone or at the unconformity, the unconformity being the border between the sandstone and the basement rock. But now the basement rocks are showing some of the highest uranium grades.
“What’s exciting about Moore Lake and the upcoming drill program is there was very little historical drilling and work done testing the basement targets, which host the feeder zones. This is the source of the high-grade mineralization, up to 21% U3O8, that we have at our Maverick zone, which is hosted in the sandstone and at the unconformity,” Trimble said.
One of the new techniques Skyharbour has employed is geophysics using drones, which gives the company more pinpoint accuracy of its specific targets. Not only is it less expensive than flying fixed wing airplanes or helicopters, it gives better images because drones can fly closer to the tree line and provides tighter line spacing. “We are looking for cross-cutting structures that have broken up the main corridor and have allowed the fluids to come up,” Trimble stated.
“Thanks to the geophysics, and further geological analysis, we now have a much more accurate idea of the zones we want to drill into,” Trimble noted. The company has three targets, with the main one being the basement rock to the east of the Maverick zone, to follow up on one of the last holes the company drilled in the previous program, which intercepted high-grade mineralization.
“We think this drill hole just nicked the top of a much larger, higher-grade zone, so we are going to drill down plunge,” Trimble explained.
Another target is further to the northeast on the same corridor where geophysics have identified another cross cutting structure. The third target is in the Otter Grid, which is a completely separate corridor where Skyharbour discovered uranium mineralization earlier in the year.
Skyharbour is led by an experienced team. President and CEO Jordan Trimble is an entrepreneur in the resource industry, having worked with several companies, including Bayfield Ventures, which was acquired by New Gold in 2014. Jim Pettit, the company’s chairman, was the CEO of Bayfield and has over 30 years of experience in the resource sector. Director Richard Kusmirski, the head geologist, has over 40 years of exploration experience in North America and overseas, and directed Cameco’s uranium exploration projects in the Athabasca Basin as exploration manager. Director David Cates serves as the president and CEO of Denison Mines and Uranium Participation Corp.
Skyharbour is well structured with 64 million shares outstanding and several large, notable shareholders in addition to management and insiders include Denison Mines, the KCR Fund, Sachem Cove and OTP Fund Management.
Skyharbour is conducting exploration against the backdrop of the Section 232 ruling, which was brought by U.S. uranium producers that asked for quotas or other protections for the U.S. uranium mining industry. In July, President Trump declined to impose any trade measures, but set up a Nuclear Fuel Working Group to examine the current state of nuclear fuel production in the U.S. The Working Group is due to present its report by mid-November, but the U.S. government has no obligation to enact any of its recommendations.
“The Section 232 investigation and ruling process has created a lot of uncertainty in the uranium market,” Trimble stated. “There are several U.S. nuclear utility companies that have been putting off contracting until this Section 232 and Working Group overhang is cleared up. Many of the current long-term contracts are at higher prices of $40 to $70/lb of uranium so there is an impasse right now between the producers and buyers given the current low spot price of $24/lb. Uranium miners won’t sign long-term contracts at today’s low, uneconomic prices, and utility companies are reluctant to sign contracts at higher prices right now. But I expect that will change.”
“With the highly anticipated decision of the Section 232 investigation, and the price of uranium in the spot market rising from the low $20s to $29/lb, shares of uranium companies rose. But when no action was taken, and the spot price pulled back, share prices have fallen,” Trimble explained.
“The 232 decision was perceived by investors who had come into the market over the last year and a half as a negative outcome, and the price of most uranium stocks have pulled back. But something to note is that the actual outcome for non-U.S. companies in the long run is positive, because it means we aren’t going to have millions of pounds of forced production coming out of the U.S. over the next five to seven years,” Trimble stated.
Furthermore, many uranium producers have cut supply because they cannot produce profitably at current uranium prices. Cameco has shuttered its McArthur River Mine and is buying large quantities of uranium in the spot market.
“Cameco needing to buy uranium in the spot market to make up for lost supply at McArthur is one of the most prominent potential catalysts in the near term,” Trimble said. “Cameco’s purchases in 2018 helped propel the spot price higher and I expect to see similar price action in the coming months.”
A deficit is forming in uranium’s supply-demand equation. “There’s over 192 million pounds of demand with only about 136 million pounds of primary mine supply, so we’re eating away at secondary supply very quickly right now,” Trimble stated.
The World Nuclear Association, at its September symposium in London, released its bi-annual report that had some bullish takeaways for uranium miners. For the first time since Fukushima, the report projected notable increasing demand across all three of its upper, mid and lower cases.
“With climate change as such hot topic issue globally, it’s important to realize that nuclear energy is complementary with renewable energy sources and will play a very important role in solving this problem going forward. It’s the only source of baseload, CO2 emission-free, low-cost, reliable electricity. It’s not intermittent electrical generation like wind and solar,” Trimble stated.
Disclosure: 1) Patrice Fusillo compiled this article for Streetwise Reports LLC and provides services to Streetwise Reports as an employee. She or members of her household own securities of the following companies mentioned in the article: None. She or members of her household are paid by the following companies mentioned in this article: None. 2) The following companies mentioned in this article are billboard sponsors of Streetwise Reports: Skyharbour Resources. Click here for important disclosures about sponsor fees. 3) Comments and opinions expressed are those of the specific experts and not of Streetwise Reports or its officers. The information provided above is for informational purposes only and is not a recommendation to buy or sell any security. 4) The article does not constitute investment advice. Each reader is encouraged to consult with his or her individual financial professional and any action a reader takes as a result of information presented here is his or her own responsibility. By opening this page, each reader accepts and agrees to Streetwise Reports’ terms of use and full legal disclaimer. This article is not a solicitation for investment. Streetwise Reports does not render general or specific investment advice and the information on Streetwise Reports should not be considered a recommendation to buy or sell any security. Streetwise Reports does not endorse or recommend the business, products, services or securities of any company mentioned on Streetwise Reports. 5) From time to time, Streetwise Reports LLC and its directors, officers, employees or members of their families, as well as persons interviewed for articles and interviews on the site, may have a long or short position in securities mentioned. Directors, officers, employees or members of their immediate families are prohibited from making purchases and/or sales of those securities in the open market or otherwise from the time of the interview or the decision to write an article, until one week after the publication of the interview or article. As of the date of this article, officers and/or employees of Streetwise Reports LLC (including members of their household) own securities of Skyharbour Resources, a company mentioned in this article.
New Zealand gets an early start to the trading week on Sunday evening with the release of some key consumer sentiment data that can move the markets.
Electronic Card Retail Sales is the stand-in for a monthly measure of consumer sentiment. It gives us some important insights into potential future inflation changes.
This time around, the data is especially interesting because next week we have the last meeting of the RBNZ for the year. There isn’t a clear consensus on whether the central bank will cut rates or not, with the latest survey showing a 50/50 change of action.
So any data that might give some insights or incline the bank in either direction in the lead up to the meeting could have an exaggerated effect.
What We Are Looking For
For market reaction, we generally want to focus on the monthly figure. The consensus is for Electronic Card Retail Sales for October to remain flat compared to the prior month, where they rose 0.4%.
This is not exactly a good sign, even though it’s within the range for the last several months. While consumer spending isn’t terribly seasonal, October is moving into the more active part of the year. It usually boasts around a 1% growth in retail spending.
The annualized figure is better, with a projection to grow by 2.2% over the last twelve months. This is compared to just 0.3% reported previously. A result like this would be one of the smallest increments for October since at least 2017.
Low Rates, but No Spending
One of the primary reasons that the RBNZ is cutting the cash rate is to spur the economy with increased spending, both among businesses and consumers.
Consumers have to be buying in order for businesses to be able to sell. With lower reference rates, it should be cheaper and easier for New Zealanders to borrow money on their credit cards and increase spending.
But consumer confidence has been shaky so far this year. And the projections don’t show much room for improvement. Does that mean the RBNZ should double down on its rate slashing policy and cut more?
Some members of the bank have mentioned in passing concerns about cutting too far. They’ve said that negative rates aren’t desirable. However, the collective view seems to hold that more policy easing is the solution to poor economic numbers.
The Kiwi Dollar
Last week’s poor performance in the employment numbers didn’t really dent the recent strength in the NZD.
Some analysts argue that the results could have been worse if it weren’t for the drop in participation, as many older workers opted to retire early. Usually, this is a sign of a weakening economy. And it’s not all that auspicious of a sign for currency strength!
Perhaps ironically, the better performance in the NZD has likely been driven by external factors.
With the increased positivity about a potential reduction in tariffs between the US and China, risk appetite has returned and supported commodity currencies.
More action by the RBNZ to stimulate the economy would push the currency in the other direction, however. So, kiwi bulls will be hoping for a better than expected print with electronic card retail sales to help convince the central bank to hold off on pulling the trigger.
By CentralBankNews.info Peru’s central bank lowered its monetary policy rate for the second time this year amid low inflation but said this decision didn’t necessarily imply further rate cuts and it’s board would pay close attention to inflation and its determinants when assessing the future monetary policy stance. The Central Reserve Bank of Peru (BCRP) cut its reference rate by 25 basis points to 2.25 percent and has now cut it by 50 basis points this year following a cut in August, its first cut since March 2018. Inflation in Peru rose slightly to 1.88 percent in October from 1.85 percent in September and excluding food and energy, inflation rose to 2.34 percent from 2.16 percent. However, excluding one-off increases in water, electricity and transportation rates, the monthly inflation rate would have been negative, said BCRP, which targets inflation of 2.0 percent, plus/minus 1 percentage point. Inflation is expected to remain within the target range and close to 2.0 percent within the forecast horizon but with a downside bias due to the possibility of a lower than expected increase in domestic demand. Economic conditions point toward a narrowing of the output gap, with a recovery in non-primary industries partly offsetting a weak performance by primary industries in the first 9 months of the year and a slowdown in public investment expected to reverse in the rest of the year. BCRP added business conditions had improved slightly in October and risks to global growth had also decreased on a moderation of trade tensions. Peru’s economy slowed to growth of only 1.2 percent in the second quarter of the year from 2.4 percent in the first quarter. BCRP has forecast growth this year of 2.7 percent and 3.8 percent in 2020. Peru’s sol has been relatively steady in recent years and was trading around 3.34 to the U.S. dollar today, up 1.2 percent this year.
The Central Reserve Bank of Peru issued the following statement:
“1. The Board of Directors of the Central Reserve Bank of Peru (BCRP) decided to cut the reference rate from 2.50 to 2.25 percent, in light of the following developments:
Year-on-year inflation is expected to remain within the target range close to 2.0 percent over the forecast horizon, with a downside bias due to the possibility of a lower-than expected increase in domestic demand.
Monthly inflation was 0.11 percent in October, bringing up year-on-year inflation to 1.88 percent, from 1.85 percent in September. With monthly inflation excluding food and energy at 0.23 percent in October, the year-on-year figure increased to 2.34 percent, from 2.16 percent in September due to a transitory increase in water, electricity, and transportation rates. Monthly inflation would have been negative without these items.
One-year ahead expected inflation as of October remains at 2.2 percent.
Primary industries’ weak performance in January-September was partially offset by a recovery in non-primary industries. The slowdown in public investment over the same period is expected to revert in the remainder of the year. Business conditions expectations improved slightly in October. Economic activity indicators point to a more gradual closure of the output gap.
Global growth risks decreased as trade tensions moderated.
2. This decision does not necessarily imply additional reductions in the policy rate. The BCRP Board pays close attention to new information on inflation and its determinants in assessing future changes in the monetary policy stance. 3. The Board also decided to reduce the interest rates on BCRP off-auction credit and deposit operations in domestic currency with financial entities.
Overnight deposits: 1.00 percent per year.
Direct security/currency repo and rediscount operations: i) 2.80 percent per year for financial entities’ first 10 operations over the last 12 months; and ii) the rate fixed by the BCRP Monetary and Foreign Exchange Operations Committee for operations other than financial entities’ first 10 operations over the last 12 months.
Dollar swaps: a fee equal to a minimum annual effective cost of 2.80 percent.
4. The BCRP Board’s next monetary policy session will take place on December 12, 2019.” www.CentralBankNews.info
FX traders are always on the search to find a tool or a method that could give them an edge in the markets. This is true, not just for the forex markets but also just about any market where one could speculate.
Therefore, the number of various technical trading indicators that one can choose from is tremendous. Among the many technical indicators, a few stand out.
Among these, is the ADX indicator. Known as the Average Directional Index, the ADX is a trend strength indicator. The main purpose of the ADX is to measure the strength of a trend.
When trading, it can be difficult to say whether the trend will continue or not. Under such circumstances, the ADX is a wonderful indicator that can visually give you some input. This, in turn, can be used either in developing a technical trading strategy or just to fine-tune an existing trading system.
Some FX traders also consider the ADX to be the ultimate trend indicator. The trend, as you might already know, is often said to be a forex trader’s best friend. Thus, an indicator that can measure the trend strength, no doubt, is widely accepted.
In this article, we will not get into the details of how the ADX works. But rather, we will see whether the forex indicator can stand out from other custom indicators in its group.
ADX Indicator depicting trend strength
Are there any Alternatives to the ADX Indicator?
The answer to this first depends on how the ADX indicator works. Firstly, the average directional index indicator highly depends on inputs from the moving average. The moving average, as you know is merely a moving average of the price of the security.
The general consensus is that when prices are rising, it tends to pull up the average price as well. This leads to an upward-sloping moving average. Conversely, when prices are falling, they tend to push the moving average price lower as well.
The ADX indicator uses this information to plot three lines. The DI+ line and the DI- line measures the highs and the lows in the price. Based on the trend, you will find the DI+ line crossing above the DI- line and vice versa.
The ADX moves between fixed values of 0 to 100.
In addition to this, there is also the ADX line. The ADX measures the momentum. Thus, when momentum is high and the DI+ is above DI-, it can mean that the strength of the trend is strong.
The same can be said when the DI- is above the DI+ line and the DMI line is rising. It signals that the downtrend is strong.
As you can see already, the ADX indicator requires quite a bit of reading to understand the trend strength. When there are three variables in the indicator it can lead to various scenarios.
In the larger scope of things, it can make things a bit difficult for forex traders.
Therefore, it is not uncommon to see some FX traders use only the DMI line while using other indicators to measure the trend.
Alternatives to the ADX Indicator
One of the other most commonly used forex indicators aside from the ADX is the Aroon oscillator. The Aroon oscillator works on similar concepts with two lines indicating whether the uptrend or the downtrend is higher.
The deeper you dig, the more you are bound to find more custom forex indicators.
But this begs the question as to whether the ADX is a good indicator or if one should merely use some of the other modified versions for it.
The bottom line is that forex traders tend to search for the Holy Grail indicator. And the hunt to find something better than the ADX might sound appealing. At the end of the day, forex trading is not just about using the best indicators but requires a mix of risk management and understanding of the FX markets.
If you are stuck on whether the ADX is a good indicator to use, then you should possibly introspect more into understanding the need for finding the next best indicator.
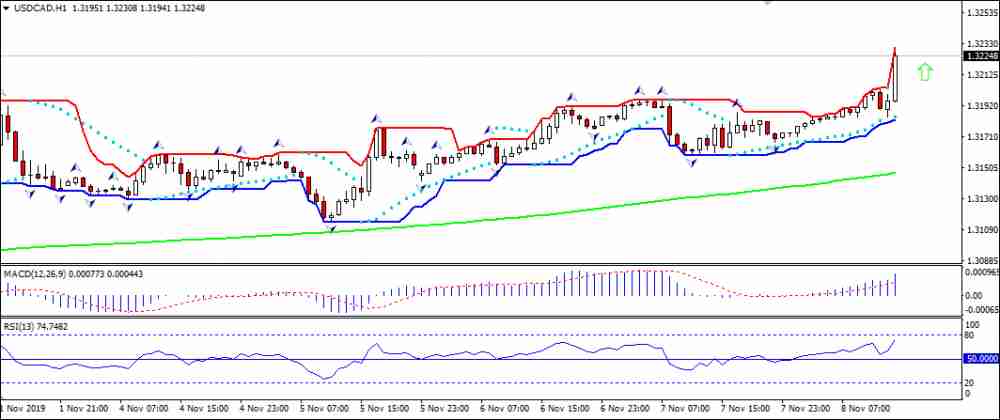
Lower than expected Canada housing starts bullish for USDCAD
Housing starts declined in Canada in October. Will the USDCAD rise?
The price chart on 1-hour timeframe shows USDCAD: H1 is in uptrend. The price is rising above the 200-period moving average MA(200) which is rising. The RSI oscillator is above 50 level but has not reached the overbought zone.
The yellow metal has been firmly lower this week as a resurgent US dollar has taken the shine out of gold demand.
Earlier in the week, the USD saw renewed buying as the latest ISM Non-Manufacturing reading showed a recovery in the services sector over October.
Following the three-year lows hit in September, traders were relieved to see a strong recovery over the last month. This saw USD immediately higher. The data comes shortly after the Fed indicated a preference to keep rates on hold in the near term.
At last week’s FOMC meeting, the Fed cut rates for the third time this year. The bank noted that it will now revert to a data dependant stance while it monitors the progress of the economy. In the near term, any further data beats will likely drive USD higher, pulling gold down, as traders further reduce their easing expectations.
The ongoing US-China trade negotiations have also weighed on gold prices this week.
The market is more and more expectant of a deal going through this month. As a result, equities prices have been surging higher.
In the US, SPX500 continues to trade into fresh record highs. This has obliterated safe have inflows for gold, keeping the yellow metal weighed down. Reduced Brexit uncertainty has also seen gold prices lower this week as the latest delay to Brexit, as well as the upcoming UK election, are reducing the risks of a no-deal Brexit.
Technical perspective
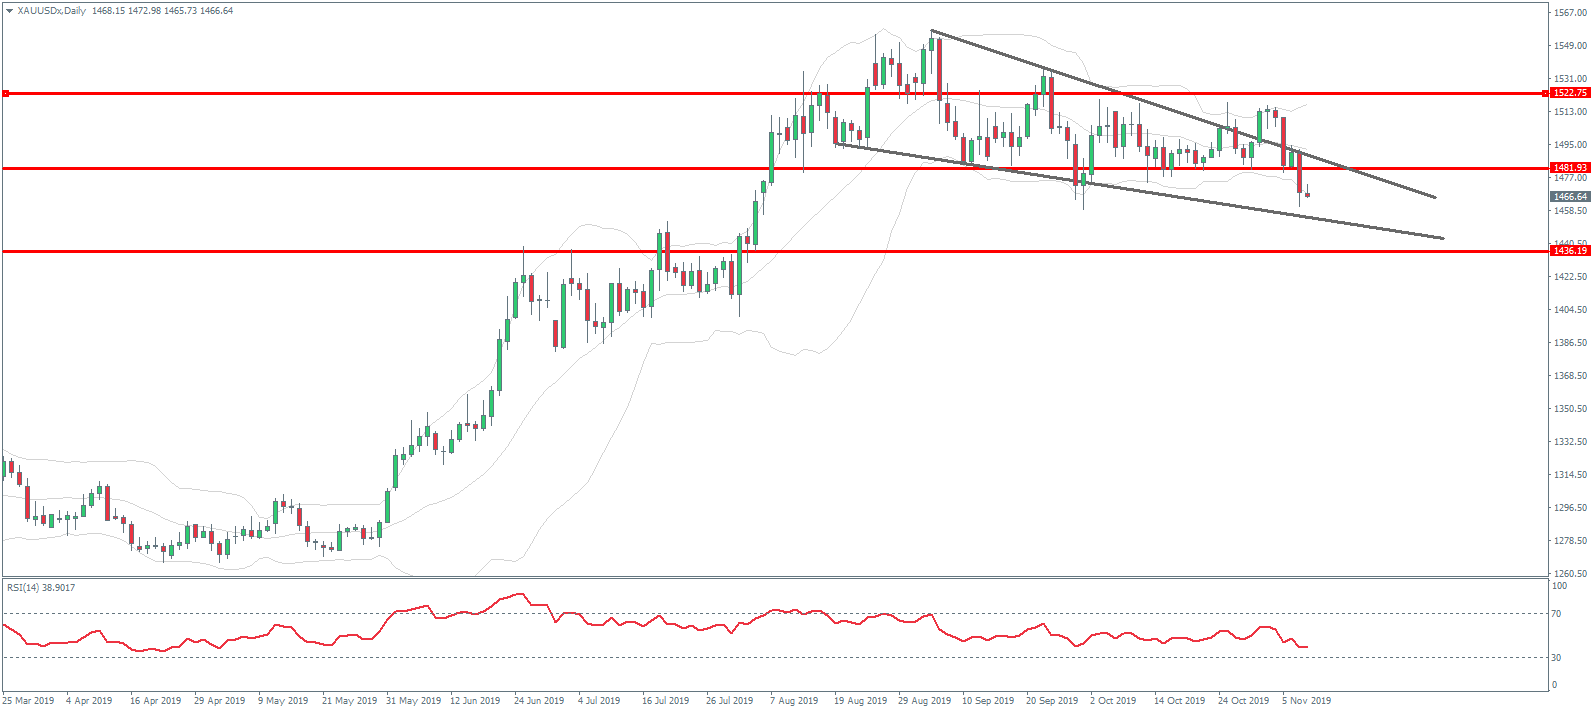
Gold prices failed on the breakout above the falling wedge pattern and are now trading back under the upper line of the structure.
The recent 1481.93 level, which has underpinned gold prices over the last three months, has now been broken and focus is now on a test of the 1436.19 level next with the lower trend line of the falling wedge pattern coming in just above.
Should we see a further rotation higher, the key level to watch in the short term is the 1522.75 level. This is a major long-term pivot for gold. Above here, focus will be on a move back up to the recent 1554.69 level.
Silver
Silver prices have tracked the moves seen in gold this week with the market crashing lower as the US dollar enjoys a firm recovery.
While silver prices are likely to remain lower in the near term, the prospect of a US-China trade deal could help silver going forward.
Increased industrial demand would likely underpin prices, offsetting the downside from a lack of safe-haven demand for precious metals. However, with gold likely to head lower, its correlation with silver should weigh on the market further.
Technical Perspective
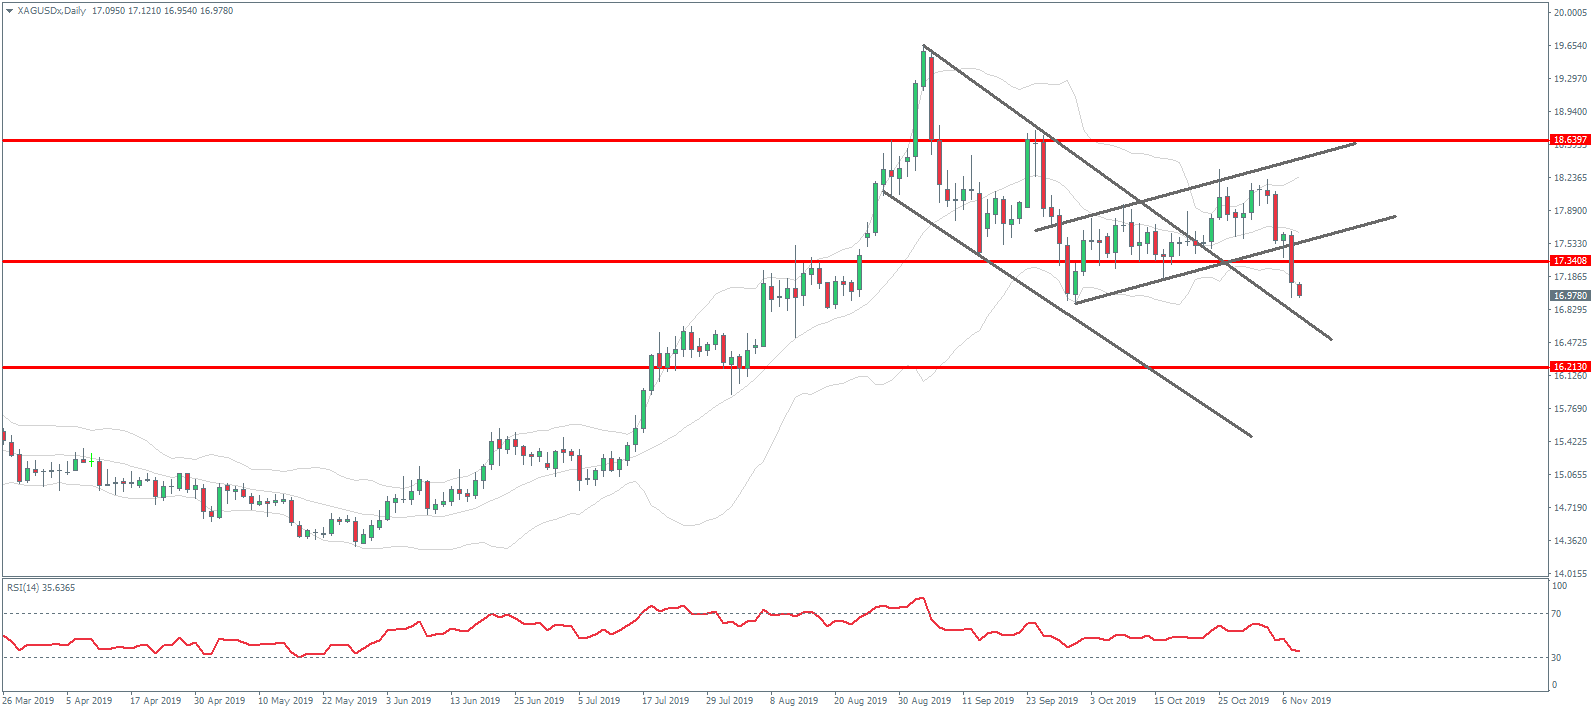
Silver prices rose off the 17.3408 support to break above the bull flag pattern. However, the move has since reversed and price has broken back below the structural support level.
Below 17.3408, the next major support level is down at 16.2130. This also holds the retest of the broken long term bearish trend line. To the topside, the 18.6397 level remains the key marker to break.
Germany’s private sector activity contraction was less than forecast in October. Will the DE30 stock index continue advancing?
German data lately were positive on balance: the services sector expansion accelerated in October and contraction in manufacturing sector slowed. Markit’s services PMI rose to 51.6 from 51.4 while the manufacturing PMI inched up to 42.1 from 41.7 in September. Readings above 50 indicate expansion, below 50 mark contraction. Composite PMI edged up to 48.9 from 48.5 in September, indicating slowing contraction in private sector activity for October. And factory orders rose 1.3% on month in September after 0.4% decline in August. At the same time construction PMI rose to 51.5 from 50.1 in September. And on the consumer end retail sales rose 3.4% over year in September after 3.1% growth in August. Improving data are bullish for Germany’s stock market index.
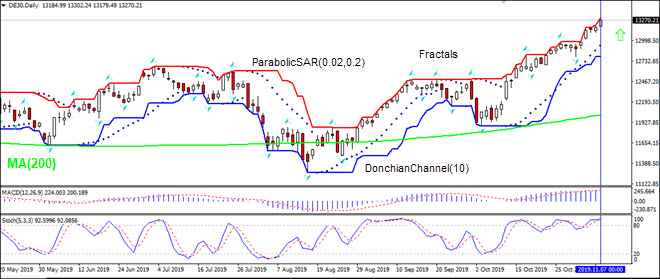
On the daily timeframe DE30: D1 is rising above 200-day moving average MA(200) which is also rising.
The Donchian channel indicates uptrend: it is widening up.
We believe the bullish momentum will continue as the price breaches above the upper boundary of Donchian channel at 13206.55. This level can be used as an entry point for placing a pending order to buy. The stop loss can be placed below the lower Donchian boundary at 12742.60. After placing the order, the stop loss is to be moved every day to the next fractal low, following Parabolic signals. Thus, we are changing the expected profit/loss ratio to the breakeven point. If the price meets the stop loss level (12792.60) without reaching the order (13206.55), we recommend cancelling the order: the market has undergone internal changes which were not taken into account.
The US dollar has continued higher over the final trading day of the week leaving the USD index to finish the week in the green. Better US data earlier in the week has seen reduced easing expectations for December, keeping USD supported here. Speaking yesterday, Fed’s Evans said he feels the US economy is in a good place following the October cut. This is reinforcing the view that the Fed will remain on hold over the remainder of the year. USD index trades 98.07 last.
EUR Down Again
EURUSD is lower again over the European morning so far today, with price fighting to hold above the week’s lows. A dismal set of EU economic projections yesterday highlights the issues facing the single market economy and supports the view that the ECB will be forced to ease further in the coming months. EURUSD trades 1.1040 last.
GBP Lower On BOE
GBPUSD has had a quiet session today with price remaining very constrained around the 1.2810 mark. Yesterday, the BOE kept rates on hold as expected, though with two members voting in favor of a cut, the meeting was notably more dovish than last time around. This is the first time that BOE policymakers have voted in favor of a cut since 2016. The dovish message was further emphasized by a lowered set of growth and inflation projections which the BOE attributed to Brexit uncertainty.
Risk Sentiment Weaker on Friday
Risk assets have been a little softer today in light of the USD rally. The SPX500 pushed further into new record highs over the week though momentum has paused for now on the back of stronger US data. With expectations of a US/China trade deal intact, however, the outlook remains bullish. SPX500 trades 3083.68 last.
Gold Lower, JPY Higher
Safe havens have had a mixed session so far today with gold lower against USD while JPY trades higher.Reduced US rate cut expectations are keeping gold pressured while a softer tone to equities is diverting flows back into JPY. USDJPY trades 109.33 last, sitting just off the week’s highs. XAUUSD trades 1466.78 last having broken back below the key 1481.93 support level which had been underpinning price action over the last three months.
Crude Crumbles on USD Rally
Oil has been weaker today on the back of the USD strength seen over recent days. On Wednesday, the EIA reported a large surplus in US crude inventories. This came a day after OPEC released its latest World Oil Outlook in which it heavily cut its demand forecasts over the near, medium and long term. However, while the US/China trade deal remains in focus, crude is likely to find support. Crude trades 56.29 last.
Loonie Makes Lift-Off
USDCAD has been higher today as a result of a stronger US dollar and a weaker Canadian dollar. Looking ahead to today’s US session we have the final tier one data of the week with the Canadian Unemployment rate due, expected to remain unchanged at 5.5%. USDCAD is challenging the 1.3207 level once again as of writing.
AUD Lower Following RBA SoMP
AUDUSD has been lower today, extending yesterday’s losses as the USD rally gathers pace. AUDUSD trades .6867 last, challenging the week’s lows. In its Statement on Monetary Policy (SoMP) released overnight the RBA downgraded its growth forecasts and noted that it is prepared to ease policy further if necessary.