US stocks extended gains on Thursday despite mixed reports about opposition in Washington to a new agreement with Beijing to cancel mutual tariffs in stages. The S&P 500 gained 0.3% to 3085.18. The Dow Jones industrial average rose 0.7% to 27674.80. Nasdaq composite index added 0.3% to 8434.52. The dollar strengthening accelerated as data showed initial jobless claims were below forecast. The live dollar index data show the ICE US Dollar index, a measure of the dollar’s strength against a basket of six rival currencies, rose 0.2% to 98.13 but is lower currently. Futures on US stock indices point to mixed openings.
DAX 30 leads European indexes gains
European stock market advanced fifth straight session on Thursday on progress in US-China trade talks despite European Central Bank’s downgrade of euro-zone’ economic growth estimate for the second half of 2019. Both EUR/USD and GBP/USD accelerated their declines with both pairs lower currently. The Stoxx Europe 600 index ended 0.4% higher led by mining and auto shares. Germany’s DAX 30 rallied 0.8% to 13289.46. France’s CAC 40 gained 0.4% and UK’s FTSE 100 added 0.1% to 7406.41.
Hang Seng leads Asian indexes losses
Asian stock indices are mostly retreating today after reports bilateral rollback of tariffs agreed upon as part of a “phase one” US-China trade deal faced “fierce internal opposition” within the White House. Nikkei rose 0.3% to 23391.87 despite resuming yen climb against dollar. Chinese stocks are falling despite a report China’s exports fell less than feared in October: the Shanghai Composite Index is down 0.5% and Hong Kong’s Hang Seng Index is 0.7% lower. Australia’s All Ordinaries Index slipped another 0.04% despite resumed Australian dollar decline against the greenback.
Brent futures prices are edging lower today. Prices ended higher yesterday after news China and the US agreed to cancel tariffs after a phase one trade deal: January Brent crude rose 0.9% to $62.29 a barrel on Thursday.
Note: This overview has an informative and tutorial character and is published for free. All the data, included in the overview, are received from public sources, recognized as more or less reliable. Moreover, there is no guarantee that the indicated information is full and precise. Overviews are not updated. The whole information in each overview, including opinion, indicators, charts and anything else, is provided only for familiarization purposes and is not financial advice or а recommendation. The whole text and its any part, as well as the charts cannot be considered as an offer to make a deal with any asset. IFC Markets and its employees under any circumstances are not liable for any action taken by someone else during or after reading the overview.
ProMIS’ preclinical treatment could possibly outshine Biogen’s candidate.
Finding an effective treatment for Alzheimer’s disease has been elusive as many seemingly promising avenues of research did not prove out in clinical trials. Biogen Inc. (BIIB:NASDAQ) appeared to be going down the same path after it pulled the plug on its phase 3 aducanumab trials in March. But, in a stunning reversal, Biogen recently announced that, after looking at a more complete set of phase 3 data that included patients receiving the highest dosage, it has concluded the treatment was effective after all.
A small-cap firm, ProMIS Neurosciences Inc. (PMN:TSX; ARFXF:OTCQB), believes its Alzheimer’s treatment currently in development, PMN310, will run circles around Biogen’s, and is developing treatments for Parkinson’s, ALS and other neurodegenerative diseases, all of which are caused by the progressive death of nerve cells.
Noble Capital Markets has seconded this view. Analyst Cosme Ordonez, in an October 24 report, wrote, “We believe ProMIS’ PMN310 is a superior drug. . .Although PMN310 is still in preclinical development, we believe it has the potential to become the preferred antibody for the treatment of Alzheimer’s.”
“In our opinion, ProMIS’ preclinical results validate the hypothesis that PMN310 has the potential to become an efficacious drug for the treatment of Alzheimer’s disease. Despite recent setbacks in the Alzheimer’s area, we believe that ProMIS will be successful as the company has developed a unique, distinctive therapeutic approach,” Ordonez concluded.
Today no effective treatment that attacks the root cause of the disease is available for chronic neurodegenerative diseases; the treatments that do exist merely temporarily slow down symptoms without any effect on disease progression.
“When Biogen stopped its aducanumab trial in March,” ProMIS CEO Elliot Goldstein, MD, told Streetwise Reports, “it got tremendous negative attention; people felt that the science must be wrong, that targeting amyloid beta wasn’t the right thing to do. Investors left the sector in droves.”
“But I believe Biogen was targeting the wrong kind of amyloid beta; it comes in several forms and most are harmless,” Goldstein explained. “The target is the small clumps of amyloid beta called oligomers that when they misfold are highly toxic and kill neurons. Most of the failed studies were using compounds designed to mainly knock out plaque or other normal, non-toxic forms of amyloid, and while these treatments can have some effect on the toxic form, they weren’t selective and specific for it.”
When Biogen received more data from its study, “especially from patients who had been receiving the highest dosage, it turns out that the EMERGE study was unequivocally positive. At the highest dose of 10 milligrams per kilogram body weight aducanumab was blocking enough of the toxic form of amyloid beta to make a significant difference. But the dosage can’t be increased further because of toxic side effects, most notably swelling of the brain, also called edema. About 35% of the patients in Biogen’s trials had this dose limiting side effect,” Goldstein noted.
“We like to say that aducanumab is approvable but certainly improvable; it’s not selective enough for the toxic oligomers that are the root cause of Alzheimers. If a lot of the treatment goes to bust harmless plaques, you are wasting a lot of the ammunition on the wrong target,” Goldstein stated.
It’s not easy to develop antibodies against these toxic oligomers because they are “shape shifters,” Goldstein said. “Misfolded oligomers have unstructured regions, so you can’t isolate them using the usual physical techniques for making antibodies. To solve this challenge, we used our proprietary thermodynamic algorithms that run on supercomputers to compute exactly where they’re misfolding, and the shape of the misfolding, and then we create, test and validate antibodies that work selectively against that specific toxic form.”
That one antibody targeting toxic oligomers of amyloid will work only against the misfolded protein that leads to Alzheimer’s, but the principle is the same for some of the other neurodegenerative diseases. Small misfolded clumps of the protein called alpha-synuclein are a root cause of Parkinson’s disease. When the protein called TDP-43 forms misfolded toxic clumps, it leads to amyotrophic lateral sclerosis (ALS). ProMIS has candidate antibody therapies for all three diseases.
“Selectivity for the toxic oligomer is very important,” Goldstein stressed. “You want to aim at the right target so that you don’t waste ammunition and cause damage and side effects. By avoiding side effects, you can raise the dosage so that it can be more effective.”
Goldstein is pleased with Biogen’s success. “First, we believe Biogen has a strong likelihood of receiving FDA approval for aducanumab, and that means hope at the end of the tunnel for Alzheimer’s patients and their caregivers.”
For ProMIS, Goldstein sees his company’s PMN310 antibody becoming the next generation, best-in-class treatment for Alzheimer’s. “We have preclinical evidence that PMN310 selectively targets and neutralizes the neurotoxicity without binding to normal, non-toxic forms of amyloid, such as plaque.”
PMN310 is in the late preclinical stage of development. Final steps to an IND file include completing the scale up manufacturing of PMN310, followed by start of the clinical trial program.
To raise the funds to proceed, ProMIS is in discussion with “more than five and less than 10” pharmaceutical companies, some at the term sheet stage, Goldstein stressed. “Because we have distinct antibody programs running simultaneously for Alzheimer’s, Parkinson’s, ALS and frontotemporal dementia (FTD), there could potentially be more than one deal in the offing in the next three to twelve months.”
ProMIS has approximately 261 million shares outstanding, and around 25% are owned by insiders. The company plans to uplist to the NASDAQ when conditions become favorable.
Noble Capital Markets opined on October 24, “We believe ProMIS’s currently deflated share price does not reflect the potential of its lead drug PMN310 and unique mechanism of action targeting the true culprit of Alzheimer’s disease, which makes it potentially superior to aducanumab. We are reiterating our Outperform rating and $1.00 target price on the stock.” The stock is currently trading at CA$0.16.
Disclosure: 1) Patrice Fusillo compiled this article for Streetwise Reports LLC and provides services to Streetwise Reports as an employee. She or members of her household own securities of the following companies mentioned in the article: None. She or members of her household are paid by the following companies mentioned in this article: None. 2) The following companies mentioned in this article are billboard sponsors of Streetwise Reports: None. Click here for important disclosures about sponsor fees.
3) Comments and opinions expressed are those of the specific experts and not of Streetwise Reports or its officers. The information provided above is for informational purposes only and is not a recommendation to buy or sell any security. 4) The article does not constitute investment advice. Each reader is encouraged to consult with his or her individual financial professional and any action a reader takes as a result of information presented here is his or her own responsibility. By opening this page, each reader accepts and agrees to Streetwise Reports’ terms of use and full legal disclaimer. This article is not a solicitation for investment. Streetwise Reports does not render general or specific investment advice and the information on Streetwise Reports should not be considered a recommendation to buy or sell any security. Streetwise Reports does not endorse or recommend the business, products, services or securities of any company mentioned on Streetwise Reports. 5) From time to time, Streetwise Reports LLC and its directors, officers, employees or members of their families, as well as persons interviewed for articles and interviews on the site, may have a long or short position in securities mentioned. Directors, officers, employees or members of their immediate families are prohibited from making purchases and/or sales of those securities in the open market or otherwise from the time of the interview or the decision to write an article until three business days after the publication of the interview or article. The foregoing prohibition does not apply to articles that in substance only restate previously published company releases. As of the date of this article, officers and/or employees of Streetwise Reports LLC (including members of their household) own securities of ProMIS, a company mentioned in this article. 6) This article does not constitute medical advice. Officers, employees and contributors to Streetwise Reports are not licensed medical professionals. Readers should always contact their healthcare professionals for medical advice.
The producer’s Q3/19 financial and operating results are reviewed in an iA Securities report.
In an Oct. 31 research note, iA Securities analyst Michael Charlton reported that Whitecap Resources Inc.’s (WCP:TSX) Q3/19 production was a beat and its new joint venture adds potential upside.
In Q3/19, Whitecap produced about 68,255 barrels of oil equivalent per day (68,255 boe/d), which surpassed iA Securities’ estimate and was within guidance, Charlton noted. This resulted from Whitecap spending less capital than expected. The company is on pace to meet its average annual production of 70,00072,000 boe/d with capital spending at about $400 million.
“The quarter was active as Whitecap drilled 104 (89.9 net) wells, advancing all its core areas and enhancing and expanding its assets to maximize shareholder value, supportive of its long-term dividend and growth model,” Charlton commented.
As for Q3/19 cash flow, it was about $154.3 million, or $0.37 per share, reflecting a sequential decrease of about 12% “but tight (within 1%) to our forecasts,” indicated Charlton. This resulted from, one, lower realized prices of $52.76 per barrel of oil equivalent (boe), down about 10% from Q2/19. Lower netbacks was a second contributor. They dropped by about 15% to $27.92 per boe due to reduced realized prices and slightly higher operating and transportation costs.
Looking forward, Whitecap’s 2020 budget is between $360 and $380 million, annual production guidance is about 71,00072,000 boe/d and plans are to drill about 150 wells, Charlton pointed out. “With the 2020 capital budget set, Whitecap remains well positioned to post modest production growth and free cash flow, which is anticipated to be split between debt reductions and a return of capital to shareholders,” he wrote.
Finally, Charlton summarized Whitecap’s recent joint venture with a private Montney exploration firm. During the two-year earn-in period, Whitecap will garner up to a 65% working interest in 34 (21.5 net) sections in the oil window of the Montney with about 144 possible drilling locations. After the earn-in, the company will operate about 88% of the lands and have a 65% working interest in those as well as a 50% working interest in the lands it will not operate.
IA Securities has a Strong Buy recommendation and a target price of CA$7.75 per share on Whitecap Resources, whose stock is currently trading at about CA$4.05 per share.
Disclosure: 1) Doresa Banning compiled this article for Streetwise Reports LLC and provides services to Streetwise Reports as an independent contractor. She or members of her household own securities of the following companies mentioned in the article: None. She or members of her household are paid by the following companies mentioned in this article: None. 2) The following companies mentioned in this article are billboard sponsors of Streetwise Reports: None. Click here for important disclosures about sponsor fees. 3) Comments and opinions expressed are those of the specific experts and not of Streetwise Reports or its officers. The information provided above is for informational purposes only and is not a recommendation to buy or sell any security. 4) The article does not constitute investment advice. Each reader is encouraged to consult with his or her individual financial professional and any action a reader takes as a result of information presented here is his or her own responsibility. By opening this page, each reader accepts and agrees to Streetwise Reports’ terms of use and full legal disclaimer. This article is not a solicitation for investment. Streetwise Reports does not render general or specific investment advice and the information on Streetwise Reports should not be considered a recommendation to buy or sell any security. Streetwise Reports does not endorse or recommend the business, products, services or securities of any company mentioned on Streetwise Reports. 5) From time to time, Streetwise Reports LLC and its directors, officers, employees or members of their families, as well as persons interviewed for articles and interviews on the site, may have a long or short position in securities mentioned. Directors, officers, employees or members of their immediate families are prohibited from making purchases and/or sales of those securities in the open market or otherwise from the time of the interview or the decision to write an article until three business days after the publication of the interview or article. The foregoing prohibition does not apply to articles that in substance only restate previously published company releases.
Disclosures from iA Securities, Whitecap Resources Inc., Research Update, October 31, 2019
Conflicts of Interest: The research analyst and or associates who prepared this report are compensated based upon (among other factors) the overall profitability of iA Securities, which may include the profitability of investment banking and related services. In the normal course of its business, iA Securities may provide financial advisory services for the issuers mentioned in this report. iA Securities may buy from or sell to customers the securities of issuers mentioned in this report on a principal basis.
Analyst’s Certification: Each iA Securities research analyst whose name appears on the front page of this research report hereby certifies that (i) the recommendations and opinions expressed in the research report accurately reflect the research analyst’s personal views about the issuer and securities that are the subject of this report and all other companies and securities mentioned in this report that are covered by such research analyst and (ii) no part of the research analyst’s compensation was, is, or will be directly or indirectly, related to the specific recommendations or views expressed by such research analyst in this report.
Analyst Trading: iA Securities permits analysts to own and trade in the securities and or the derivatives of the issuer under their research coverage, subject to the following restrictions. No trades can be executed in anticipation of coverage for a period of 30 days prior to the issuance of the report and 5 days after the dissemination of the report to our clients. For a change in recommendation, no trading is allowed for a period of 24 hours after the dissemination of such information to our clients. A transaction against an analyst’s recommendation can only be executed for a reason unrelated to the outlook of the stock for the issuer and with the prior approval of the Director of Research and the Chief Compliance Officer.
The Industrial Alliance Securities Inc. research analyst(s) who cover the issuer discussed, members of the research analysts household, research associate(s) or other individual(s) involved directly or indirectly in producing this report: a. have a long position in its common equity securities.
The analyst has visited the issuers operations. No payment or reimbursement was received from the issuer for the associated travel costs.
Aquestive Therapeutics shares traded 20% higher today after the firm reported Q3/19 earnings and raised its FY/19 guidance. The firm states it expects to complete its NDA for Libervant buccal film near the end of this month.
Yesterday afternoon, specialty pharmaceutical company Aquestive Therapeutics Inc. (AQST:NASDAQ), which focuses on the development and commercialization of differentiated products in order to meet unmet patient needs and solve therapeutic problems, reported third quarter financial results for the period ending September 30, 2019. In the release, the company also provided an update on recent business and pipeline developments.
Aquestive’s CEO Keith J. Kendall commented, “The third quarter was an important one in our evolution. We successfully completed the crossover study requested by the U.S. Food and Drug Administration (FDA) for Libervant compared to the reference listed rectal gel. We also completed our proof-of-concept study for epinephrine, AQST-108, for the treatment of allergic reactions including anaphylaxis, and requested a pre-IND meeting with the FDA. In addition, we advanced the commercialization of Sympazan with more than 50% growth of shipments to retailers since the end of the second quarter.”
In the report the company stated that it is “building a portfolio of differentiated medicines that can offer physicians and patients, who have difficulty using currently available treatment options, improved clinical and usability features based on the Company’s PharmFilm technology.”
The firm advised that “Aquestive is expected to complete its rolling NDA submission for Libervant (diazepam) Buccal Film around the end of November 2019, after having filed the CMC portion in September 2019. Libervant has the potential to be the first oral therapy approved by the FDA for the management of seizure clusters in the population of 1.2 million refractory epilepsy patients and the first diazepam based treatment usable by and delivering a consistent predictable dose to virtually all patients to whom it is prescribed.”
The company further noted that “positive data reported from Phase 1 dose escalation proof-of-concept study in healthy subjects for AQST-108, a “first in class” oral sublingual film formulation of epinephrine, demonstrated the ability to deliver systemic epinephrine using Aquestive’s proprietary PharmFilm formulation.”
In addition, the firm pointed out that the “adoption of Sympazan (clobazam) oral film for the treatment of seizures associated with Lennox-Gastaut syndrome (LGS) continues to grow, with shipments to retailers increasing over 50% as compared to the quarter ended in June.”
The company reported that total revenues were $12.4 million in Q3/19, compared to $13.3 million in Q2/18. The firm advised that as expected the year-over-year decrease reflected lower license and royalty revenue in 2019.
Aquestive’s reported a net loss for Q3/19 of $18.4 million, or $0.74 loss per share compared to a net loss of $15.0 million, or $0.64 loss per share in Q3/18. The firm advised that “the year-over-year change in net loss was driven primarily by higher investments in 2019 in the commercialization of Sympazan, and in the development of Libervant and AQST-108.” The company listed that as of Cash and cash equivalents as of September 30, 2019 were $20.9 million.
The company noted that it is raising its full-year 2019 revenue and earnings guidance and updating its financial outlook for 2019. Aquestive indicated that for FY/19, it expects “total revenues of $45-47 million; Non-GAAP gross margins of 67-69%; Non-GAAP adjusted EBITDA loss of $49-50 million; and Cash burn of approximately $60-65 million.”
Aquestive Therapeutics is headquartered in Warren, N.J., and is a specialty pharmaceutical company focused on the development of treatments for diseases related to the central nervous system (CNS). The firm’s CNS product pipeline includes Libervant, a buccal soluble film formulation of diazepam for the treatment of recurrent epileptic seizures, and Sympazan, an oral soluble film formulation of clobazam for the treatment of seizures associated with a rare, intractable form of epilepsy known as Lennox-Gastaut Syndrome. The company also has complex molecule programs used in the treatment of anaphylaxis and neuroendocrine tumors, and the firm also has a pipeline of products under partner programs for treatment of opioid dependence and Parkinson’s disease.
Aquestive Therapeutics has a market capitalization of around $105.9 million with approximately 25 million shares outstanding. AQST shares opened slightly higher today at $4.33 (+$0.10, +2.36%) over yesterday’s $4.23 closing price. The stock has traded today between $4.33 and $5.74/share and is currently trading at $5.10 (+$0.87, +20.57%).
Disclosure: 1) Stephen Hytha compiled this article for Streetwise Reports LLC and provides services to Streetwise Reports as an independent contractor. He or members of his household own securities of the following companies mentioned in the article: None. He or members of his household are paid by the following companies mentioned in this article: None. 2) The following companies mentioned in this article are billboard sponsors of Streetwise Reports: None. Click here for important disclosures about sponsor fees. 3) Comments and opinions expressed are those of the specific experts and not of Streetwise Reports or its officers. The information provided above is for informational purposes only and is not a recommendation to buy or sell any security. 4) The article does not constitute investment advice. Each reader is encouraged to consult with his or her individual financial professional and any action a reader takes as a result of information presented here is his or her own responsibility. By opening this page, each reader accepts and agrees to Streetwise Reports’ terms of use and full legal disclaimer. This article is not a solicitation for investment. Streetwise Reports does not render general or specific investment advice and the information on Streetwise Reports should not be considered a recommendation to buy or sell any security. Streetwise Reports does not endorse or recommend the business, products, services or securities of any company mentioned on Streetwise Reports. 5) From time to time, Streetwise Reports LLC and its directors, officers, employees or members of their families, as well as persons interviewed for articles and interviews on the site, may have a long or short position in securities mentioned. Directors, officers, employees or members of their immediate families are prohibited from making purchases and/or sales of those securities in the open market or otherwise from the time of the interview or the decision to write an article until three business days after the publication of the interview or article. The foregoing prohibition does not apply to articles that in substance only restate previously published company releases. 6) This article does not constitute medical advice. Officers, employees and contributors to Streetwise Reports are not licensed medical professionals. Readers should always contact their healthcare professionals for medical advice.
The British Pound weakened against almost every single G10 currency on Thursday after the Monetary Policy Committee surprised investors with two dissenters calling for rate cuts.
Although the Bank of England’s decision to leave monetary policy unchanged in November was widely expected, the gloomier growth outlook fuelled speculation over a possible rate cut next year. Given how the central bank expects the United Kingdom to grow by 1% less over the next three years, the British Pound could be instore for further pain. While the prospects of lower interest rates in the UK should also compound to Sterling’s woes, investors are clearly more concerned with Brexit. Will the United Kingdom be able to secure a Brexit deal before the January 2020 deadline or is a no-deal Brexit on the horizon? Given how Parliament has been dissolved ahead of the General Election on December 12th, more Pound volatility will certainly be on the cards for the rest of 2019.
Focusing on the technical picture, the GBPUSD is wobbly on the weekly charts with prices struggling to keep above the 1.2800 support level. A weekly close below this point should encourage a decline towards 1.2700 in the near term.
Commodity spotlight – Gold
Gold fell out of favour with investors as risk-on swept through financial markets. Renewed optimism over US-China trade talks has boosted investor confidence and global risk sentiment – ultimately sending Gold prices tumbling over 1% to trade around $1463.50 as of writing. Should trade hopes and rising equity markets fuel the positive market mood, Gold and other safe-haven assets are likely to weaken further.
In regards to the technical picture, Gold is bearish on the daily charts with bears back in the driving seat. The breakdown below $1470 should encourage a move towards $1460 and $1450.
Disclaimer: The content in this article comprises personal opinions and should not be construed as containing personal and/or other investment advice and/or an offer of and/or solicitation for any transactions in financial instruments and/or a guarantee and/or prediction of future performance. ForexTime (FXTM), its affiliates, agents, directors, officers or employees do not guarantee the accuracy, validity, timeliness or completeness, of any information or data made available and assume no liability as to any loss arising from any investment based on the same.
We wrote a very telling research article on October 24th, 2019. We never published it because we had other articles scheduled to be published over the next few weeks in the queue and because our subscribers get our trade alerts before the general public. At this point, we are sharing that past article as well as some current research for Natural Gas that should be very interesting to you.
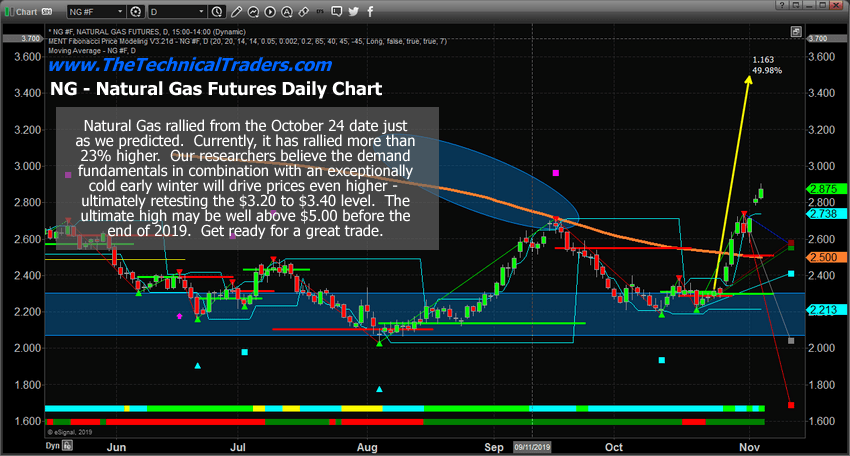
Pay very close attention to the original October 24th article, below, and our prediction that the $2.75 to $2.85 level would be a likely target for the upside price rally from the basing level below $2.30. Currently, Natural Gas is trading at $2.87 – reaching our initial target level.
If our research is correct, strong demand and limited supply globally may push Natural Gas well above the $3.20 to $3.40 level after a very brief pause happens near $3.00. In fact, Natural Gas may be getting ready to rally past 2018 highs ($4.93) if the situation presents itself for such an incredible price rally. What would it take for a rally like that to happen? Much stronger demand for natural gas because of an early, extreme winter and extended global demand.
Price reacts to supply/demand imbalances. In this case, if the demand far exceeds the supply capacities headed into the end of 2019, we could easily see Natural Gas rally above $4.00 very quickly. Could it rally even higher and take out the $5.00 level? Absolutely it could if the proper dynamics continue related to supply and demand globally.
Current Daily Natural Gas Chart
Remember to read the link from October 5th. We’ve been warning of this move for more than 60+ days and have authored multiple research posts attempting to keep our followers aware of this setup. This trade setup was telegraphed for us many months ago. All you had to do was follow our research and stay aware of the trends as this momentum base setup in October near $2.25.
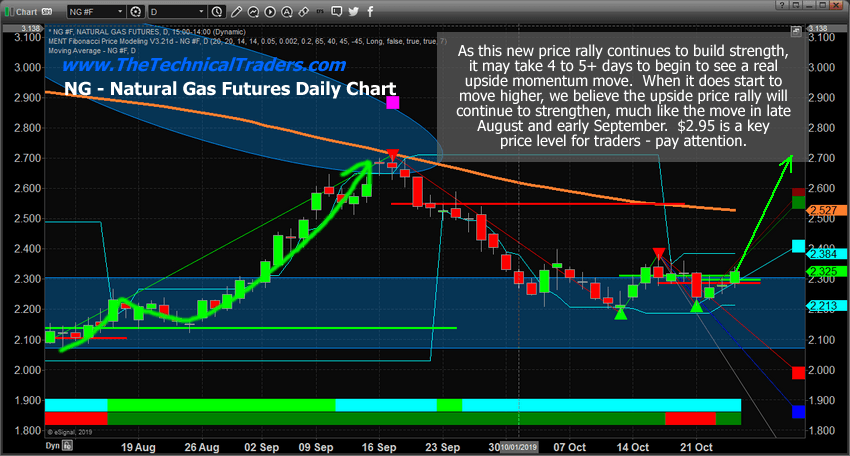
Natural Gas moved higher by nearly 2% on October 24th as our researchers predicted nearly a month ago. This incredible momentum base below $2.30 seems to be a very strong support level for Natural Gas. We believe this next rally may be bigger than the last rally which reached a high near 2.70. Our Fibonacci price modeling system is suggesting a target price of $2.95 to confirm a new upside price trend. This means the price would have to rally more than +26.5% from current levels to confirm a potentially much bigger upside price move. Can you imagine seeing Natural Gas climb to above $4.50 again – like last year?
Near the end of October 2018, Natural Gas began an upside price move that really excited investors. The first upside price leg began in mid-September, near $2.75 and rallied to a level near $3.35 – a +21.6% upside price move. After a brief 12 to 15 day pause, another price rally began in early November 2018 near $3.23 and continued very aggressively over the next 11+ days to rally up to $4.93 – a +57% rally.
We issued a natural gas trade using UGAZ to members and this week we locked in 38.7% profit on a portion of our position and there is still a lot of upside potential left.
Is the same type of price advance could be setting up for an early November price rally from the $2.30 level to somewhere above $3.50? This would result in a +50% price rally from recent lows without using any leverage which would be just amazing.
Our proprietary Fibonacci price modeling system is suggesting the $2.95 price level is critical for any further upside price action to continue above $3.00. The price must cross above the $2.95 level on a strong closing price basis before we could consider any higher price levels to become valid. Our researchers believe that suggests the $2.75 to $2.85 level becomes a very real upside price target for skilled traders to pull some profits and protect any open long positions.
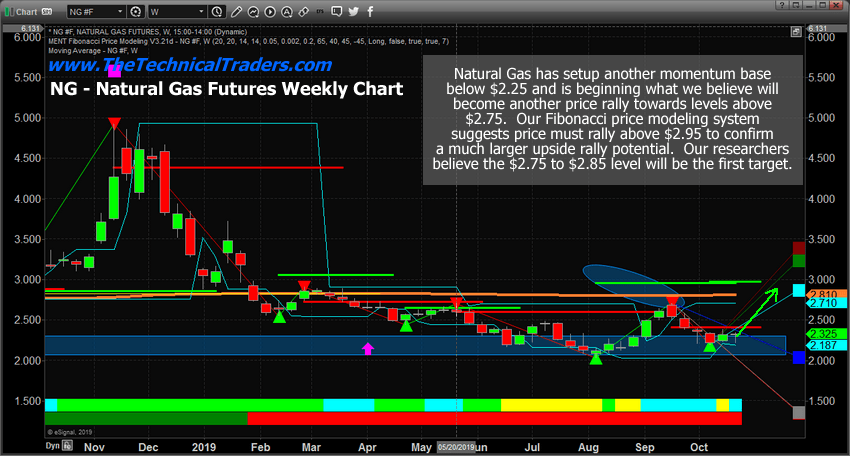
Previous Natural Gas Forecast Weekly Chart
This Weekly Natural Gas chart highlights our Fibonacci price modeling system’s results and the Bullish Trigger Level near $2.95 (The GREEN LINE). Pay very close attention to how quickly Natural Gas moved higher in November 2018. If another move happens like that in 2019, we could be setting up for a big gap higher followed by about 10 to 15+ days of incredible upside price action.
Currently, the price of Natural Gas has crossed the Daily Fibonacci price modeling system’s Bullish Price Trigger level near $2.29. This suggests that we are now in a confirmed bullish trend as long as the price stays above the $2.26 level on a closing price basis. We would expect a continued moderate price rally from these levels to move price away from the momentum base level over time – before any breakout upside price move may begin.
This could become one of the best trades, besides Silver and Gold, headed into the end of 2019. Get ready for some big volatility in Natural Gas as winter weather takes over much of North America.
November will be the month of breakouts and breakdowns and should spark some trades. I feel the safe havens like bonds and metals will be turning a corner and starting to firm up and head higher but they may not start a big rally for several weeks or months.
October was a boring month for most major asset classes completing their consolidation phase. Natural gas was the big mover in October and subscribers and I took full advantage of the bottom and breakout for a 15-22% gain and its till on fire and trading higher by another 3% this week already.
The global financial market is in a period of turmoil, and as such investors need to be constantly thinking ahead to how they can find new, more stable investment options so as to better manage their risk. With the global doom and gloom following the UK’s Brexit debacle, the USA’s potential impeachment of its Twitter-loving president and global economic uncertainty, it can be easy to think that you should batten down your investment hatches and focus all of your time and energy on tried-and-tested markets and asset classes. However, as London’s Forex trading market booms and global investors come around to the benefits of this often overlooked market, there has never been a better time to consider moving into the Forex market.
What Is Forex Trading?
Forex trading involves trading on the foreign exchange market, where currency is bought and sold and the relative value of global currencies is set. A decentralised, online market, the Forex market supports practically every business in the world, as such it is a vast market where savvy traders can achieve incredible success. Open 24 hours a day, five days a week, the Forex market is a global space where currency can be exchanged and trades can be undertaken in a variety of ways, including spread betting, futures trading and forward trading. The most common way to trade in currency is to choose a currency pair, then decide which way you expect the exchange rate to move. Then you wait, and should your prediction prove right you can close your trade on a profit. As an asset class, currency is perfect for hedging a portfolio, as earnings can be made from both the difference in value between two currencies and by holding a specific currency until its value rises, meaning that traders always have options even as the market fluctuates.
Why You Should Consider Forex Trading
If you’ve found success trading in another market or asset class then it can be difficult to see why moving into a new trading market, particularly one that’s notoriously tough for beginners, is a wise idea. However, as financial markets around the world continue to struggle, economic downturn worsens and predictions of a future recession become more likely, it’s of vital importance that investors safeguard their money by investing it strategically. One of the best ways to ensure that your portfolio will survive a recession is to diversify and make sure that you’ve got money invested in a variety of different asset classes and markets. As currency remains a staple asset even through a recession, it is ideal for those who fear the worst and want to make sure that their portfolio is protected. After all, even during a recession money still exists, and whilst some trades may close on a loss, intelligent traders can use a recession to their advantage in the Forex market by predicting which countries will struggle and which will prosper and investing accordingly.
Incorporating Forex Trading Into Your Portfolio
Trading on the Forex market is extremely flexible, and trades can be made for either the long or short-term, depending on your investment strategy. As such, intelligent traders can make the Forex market work for them and use its versatility to their advantage. You can further diversify your portfolio by investing across a variety of different global currencies, so that should one struggle, you’ve still got other trades going that could potentially bring you a profit. When trading on the Forex market it’s vital that you keep up to date with the latest market developments, and are well-informed about how the market is currently operating, so follow the market intently before you decide to move into it so that you’re completely prepared for when you do decide to invest.
How To Go About Trading On Forex
Once you’ve decided to start investing in the Forex market, the first and most important decision to make is what broker to work with. Many new traders entering the Forex market make basic mistakes, so it’s important that you work with an experienced broker who can help you not only to access the best trades on the market, but also navigate the pitfalls and challenges that it offers. Whether you want a full-service broker to provide you with advice and support or a discount broker to just give you access to the best trades in the Forex market, you need to find the perfect broker to help you to achieve the returns you want. To make the decision easier, use a dedicated broker review platform like FX Scouts to find out more about a wide range of different brokers and select the one that’ll help you to move into making money trading on the Forex market.
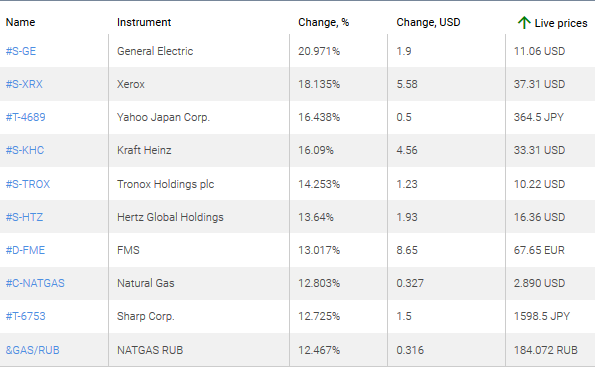
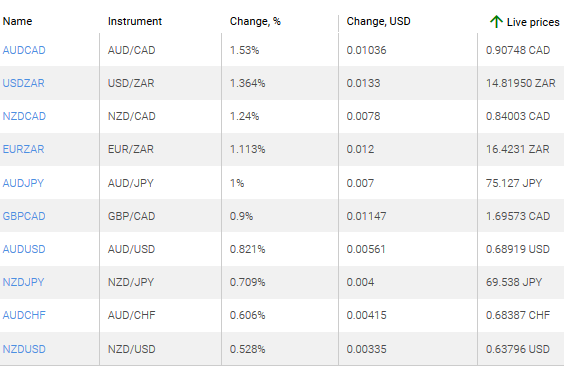
1. AUDCAD, NZDCAD – an increase of these charts indicates a weakening of the Canadian dollar against the Australian and New Zealand dollars.
2. USDZAR, EURZAR – an increase of these charts indicates weakening of the South African rand against the US dollar and the euro.
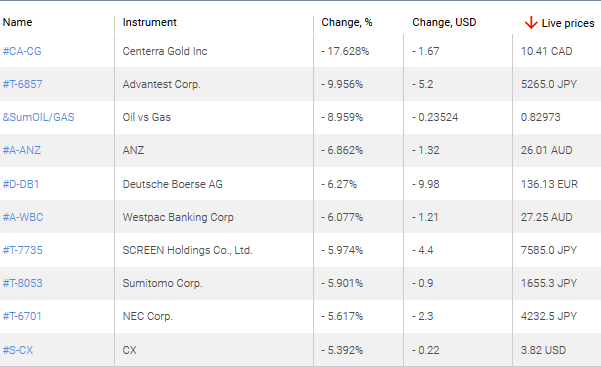
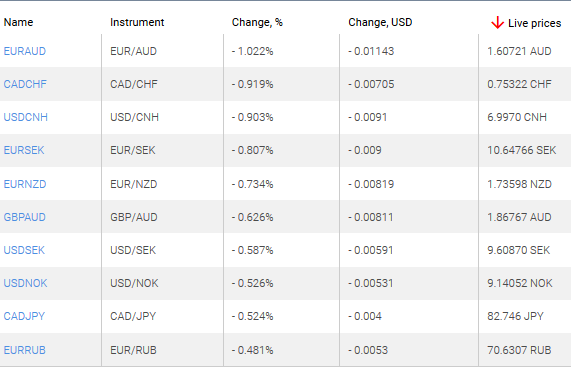
Top Losers – Foreign Exchange Market (Forex)
1. EURAUD, CADCHF – a decrease in these charts shows the weakening of the euro against the Australian dollar and the Canadian dollar against the Swiss franc.
2. USDCNH, EURSEK – a decrease in these charts shows the weakening of USD against RMB and euro against Swedish krona.
Note: This overview has an informative and tutorial character and is published for free. All the data, included in the overview, are received from public sources, recognized as more or less reliable. Moreover, there is no guarantee that the indicated information is full and precise. Overviews are not updated. The whole information in each overview, including opinion, indicators, charts and anything else, is provided only for familiarization purposes and is not financial advice or а recommendation. The whole text and its any part, as well as the charts cannot be considered as an offer to make a deal with any asset. IFC Markets and its employees under any circumstances are not liable for any action taken by someone else during or after reading the overview.
With gold prices above $1,500/ounce, Thibaut Lepouttre of Caesars Report runs the numbers to see whether this mine might be worth taking another look at.
Introduction
When the gold price started its move during the summer, someone asked us, “Do you know any ‘old and forgotten’ projects that aren’t very appealing at $1,250 gold but have a lot of leverage on the gold price that would make it viable at $1,500 gold?” An interesting question.
As a lot of projects get recycled during good years in the mining sector, you tend to see the same projects again and again and again. Sometimes the projects have a different name, sometimes the focus is on a different commodity, sometimes there is a new management team with a genuine desire to look at something with a different perspective. Quite often projects get recycled for a quick promotion tour and subsequent pump to offload paper into the hands of unsophisticated shareholders.
But sometimes projects are just gathering dust on the shelvesforgotten by investors and placed on the backburner by management teams while waiting for better market conditions. One of those projects that is “okay but not appealing” at $1,250 gold is the Wind Mountain project in northwestern Nevada, owned by Bravada Gold Corp. (BVA:TSX.V).
Revisiting the Wind Mountain project at $1,500 gold and $17 silver
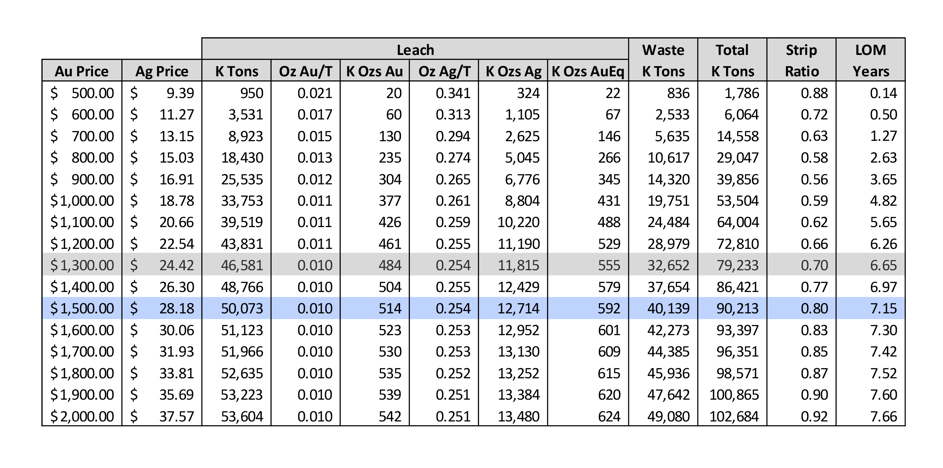
As the market still isn’t too keen on funding pure exploration stories, perhaps Bravada Gold could also revisit its Wind Mountain project, a relatively small, past-producing silver-gold project in Nevada. There is an existing NI-43-compliant resource (containing a total of 900,000+ ounces gold (Au) and 25 million ounces of silver (Ag), divided into 570,000 ounces Au and almost 15 million ounces (15 Moz) Ag in the indicated resource category, and 355,000 ounces gold and 10.1 Moz Ag in the inferred resource category). Of the total resource, approximately 450,000 ounces gold and just over 11 Moz silver are deemed to be pit-constrained.
More work needs to be done to bring in more ounces in an in-pit mineable resource, and although the project is already decently sized, it could use a few additional hundred thousand ounces in a mine plan to make it a well-sought-after heap-leach project. Perhaps using a lower cut-off grade (compared to the 0.155 g/t used in the 2012 mine plan) could help to add a few ounces to the mine plan, but this should only be considered if the current low strip ratio of 0.71:1 could be maintained.
We think it’s time to take the dust off the Wind Mountain project. The preliminary economic assessment (PEA) was completed in 2012 and is definitely outdated by now, but as we were curious to figure out the economics at the current gold and silver price, we decided to build our own economic model using the currently appropriate mining and processing costs.
We prefer the 20,000 tonnes per day (tpd) operation, as this would unlock the economies of scale necessary to make the project successful (thanks to these economies of scale the mining cost is 15% lower and the processing cost is 35% lower than in a 5,000 tpd scenario). Looking at the pit optimization results in the original technical report we see that the optimized open pit would contain around 50 million tonnes of rock at an average grade of 0.30 g/t and 7.9 g/t silver. Those 50 million tonnes would represent a 7-year mine life, and we will use this in our base case scenario.
Note: The seven-year mine life could potentially be increased by an additional 1.5 years should Bravada decide to process the historical waste dumps. For now, we are not taking that into consideration at all.
The average recovery rate of the gold is around 60% (which is lower than the 69% recovery rate when Amax Gold was operating the project, so it’s not impossible Bravada could see a boost of a few percent in the recovery rate) while only 15% of the silver is being recovered. This is one of the negative features of running a heap leach operation: leaching the gold works well but it’s pretty useless for silver as the recovery rates tend to be just 1040%. We will apply a recovery rate of 63% for the gold and 17% for the silver.
Since the PEA was completed in 2012, the USA has completed a reform of the tax structure. The normal corporate tax rate has decreased to 21% (which should definitely help a U.S.-based mining operation). There also is a specific Nevada mining tax of 5% on the operating profit (which we will assume is the EBITDA [earnings before interest, taxes, depreciation and amortization) if a mining operation generates in excess of $4 million ($4M) in operating profit. Additionally, there is a 2% NSR (net smelter return) on the property, which could be reduced to 1%.
We will assume a normalized corporate tax rate of 25% (consisting of 21% federal corporate taxes, with the balance related to the Nevada mining tax, which is based on the operating profit rather than the revenue or pre-tax income). The “real” tax pressure should be lightly lower (around 23.524%), but we will be using 25% to have an additional margin of safety.
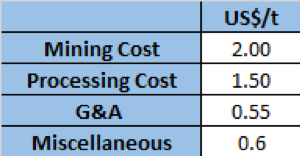
For the operating expenses, these are the inputs we will be using:
The miscellaneous cost per tonne includes the reclamation and haulage costs per tonne. We will also use an average annual sustaining capex of $3M, which will help us to calculate the taxable income. We also used a processing cost of $1.50/tonne ($1.50/t), which is lower than the $2.80 used by Integra Resources Corp. (ITR:TSX.V; IRRZF:OTCQB). Considering Fiore Gold Ltd. (F:TSX.V; FIOGF:OTCQB) has a processing cost of $1.24/t and SSR Mining Inc.’s (SSRM:NASDAQ) Marigold mine has a processing cost of $1.22/t, we feel the processing cost may be exaggerated in the old Bravada Gold PEA and the recent Integra Resources PEA. By using $1.50/t we are already applying a 20% higher cost estimate than Fiore Gold.
Step 1: Calculating the operating cost and revenue per tonne
Applying a strip ratio of 0.7:1, Wind Mountain requires 1.7 tonnes of rock to be mined for every 1 tonne of pay dirt. This means that the operating cost per tonne of rock is $3.4 + $1.50 + $0.55 + $0.60 = $6.05. That’s indeed quite low and that’s predominantly due to the low strip ratio. Adding the $0.41/t in sustaining capex increases the net operating cost to $6.46/t.
Now we have established the production cost per tonne of pay dirt, we should also figure out the recoverable rock value. Applying a 63% recovery rate to the 0.30 g/t gold grade results in a recoverable rock value of $9.12/t at $1,515 gold. Using the aforementioned recovery rates for the silver and a silver price of $18/ounce, the recoverable value of the silver is approximately $0.78/t, resulting in a recoverable rock value of $9.90/t. This means the margin per tonne of rock processed at Wind Mountain is approximately $3.44/t.
Step 2: Applying the taxes
The initial capex of the project was estimated at $45M. We will apply a cost inflation of 2% per year and assume an initial capex of $52M. We will assume a linear depreciation over the seven-year mine life. This means the annual depreciation charges will be around $7.5M per year.
At a processing rate of 7.3 million tonnes per year (20,000 tonnes per day), the depreciation charges represent approximately $1.03/t, which means the taxable operating margin will be $2.41/t. Applying the 25% total tax rate means the total tax cost will be around $0.60/t.
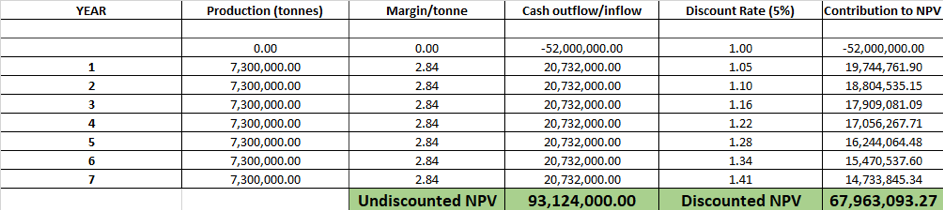
This means the total net cash flow per processed tonne of rock will be approximately $2.84/t using the current tax situation as base case scenario.
Step 3: A discounted cash flow model
Now that we have established all the parameters above, we can put everything into a simplified DCF (discounted cash flow) model. We will apply a 5% discount rate which is pretty standard for gold projects in Tier-1 mining jurisdictions. The following table shows the after-tax net present value (NPV) 5%.
As you can see, the after-tax NPV5% of Wind Mountain would be approximately US$68M at a gold price of $1,515/oz.
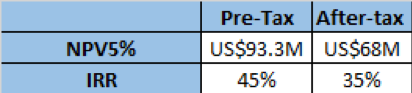
We also ran the numbers on a pre-tax basis (as both Bravada and a potential acquirer of the project may have a pool of tax losses it could apply). The next table summarizes the post-tax and pre-tax NPV5% and internal rate of return (IRR) of Wind Mountain, based on a gold price of $1,515/oz.
Conclusion
Bravada Gold is still focusing on its exploration activities, but at $1,500 gold and $18 silver, it may be an interesting idea to take the dust off the PEA-stage Wind Mountain project again. It won’t be a big money maker due to the current limited size of the project, but with an after-tax IRR of 35% at $1,515 gold, it could make sense to give Wind Mountain another look, as the current heap-leach operating scenario combined with the search for the feeder zone could make Wind Mountain appealing again.
Thibaut Lepouttre is the editor of the Caesars Report, a newsletter and mining portal based in Belgium that covers several junior mining companies with a special focus on precious metals and base metals. Lepouttre has a Bachelor of Law degree and two economics masters degrees that have forged his analytical approach to the mining sector. Considered a number cruncher, Lepouttre focuses on the valuations of companies and is consistently on the lookout for the next undervalued mining company.
Disclosure: 1) Thibaut Lepouttre: The author has a long position in Bravada Gold. The author’s company has a financial relationship with Bravada Gold. The author determined which companies would be included in this article based on his research and understanding of the sector. Additional disclosures are available here. 2) The following companies mentioned in this article are billboard sponsors of Streetwise Reports: None. Click here for important disclosures about sponsor fees. 3) Statements and opinions expressed are the opinions of the author and not of Streetwise Reports or its officers. The author is wholly responsible for the validity of the statements. The author was not paid by Streetwise Reports for this article. Streetwise Reports was not paid by the author to publish or syndicate this article. Streetwise Reports requires contributing authors to disclose any shareholdings in, or economic relationships with, companies that they write about. Streetwise Reports relies upon the authors to accurately provide this information and Streetwise Reports has no means of verifying its accuracy. 4) This article does not constitute investment advice. Each reader is encouraged to consult with his or her individual financial professional and any action a reader takes as a result of information presented here is his or her own responsibility. By opening this page, each reader accepts and agrees to Streetwise Reports’ terms of use and full legal disclaimer. This article is not a solicitation for investment. Streetwise Reports does not render general or specific investment advice and the information on Streetwise Reports should not be considered a recommendation to buy or sell any security. Streetwise Reports does not endorse or recommend the business, products, services or securities of any company mentioned on Streetwise Reports. 5) From time to time, Streetwise Reports LLC and its directors, officers, employees or members of their families, as well as persons interviewed for articles and interviews on the site, may have a long or short position in securities mentioned. Directors, officers, employees or members of their immediate families are prohibited from making purchases and/or sales of those securities in the open market or otherwise from the time of the interview or the decision to write an article until three business days after the publication of the interview or article. The foregoing prohibition does not apply to articles that in substance only restate previously published company releases.
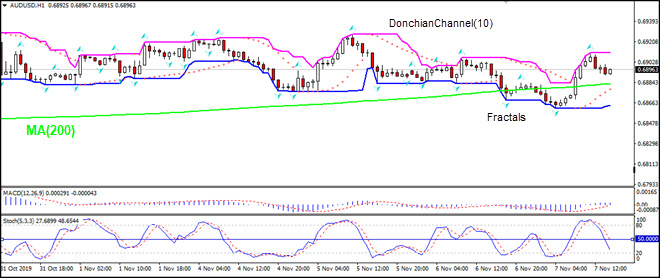
Australia’s trade surplus widened to A$7.2 billion September, up from A$6.6 billion in August. Will the AUDUSD rise?
The price chart on 1-hour timeframe shows AUDUSD: H1 is trading sideways. The price is rising above the 200-period moving average MA(200) which is rising. And the Stochastic oscillator is below 50 level and has not reached the oversold zone. There is no trend yet formed, traders have to decide when it would be a best time to enter the market.