The ZEW Indicator of Economic Sentiment for Germany improved substantially in November compared with the previous month. Will the EURUSD rise?
On 1-hour timeframe EURUSD: H1 is in downtrend, below the 200-period moving average MA(200) which is falling. The RSI indicator is below 50 level but has not reached the oversold zone.
Risk sentiment is rising as investors decipher the mixed signals on the US-China trade war. The US dollar index fell for the first time in six days while equity markets were poised for a decline after four consecutive sessions.
The trade war has become the major narrative behind the markets.
Euro Catches a Bid as Dollar Weakens
The declines in the US dollar index saw the euro rising modestly on Monday, as economic data from the eurozone was sparse.
Germany’s wholesale prices fell 0.1% on the month missing estimates of a 0.2% increase. This marks a decline from 0.4% previously. Italy’s industrial production also fell by 0.4%, in line with expectations.
EURUSD Could be Testing for Resistance
The current reversal in the currency pair comes following the declines. However, prices turned around, just shy of the lower support area at the 1.1000 region.
If the current bullish momentum holds, then the EURUSD should be testing the price level of 1.1075 – 1.1062. If this level holds as resistance then the declines could resume.
Sterling Jumps as Odds of Johnson Staying Rise
The pound sterling got a boost after UK bookmakers raised the odds that PM Johnson will continue on post-election.
This comes after the Brexit Party said that it will not contest the seats that are currently held by the Conservative party. The move is aimed to give Johnson’s party a majority in the parliament.
The UK will be heading to the polls on December 12th.
GBPUSD Back at Resistance
Cable managed to rally, but the gains stalled near the price level of 1.2856. If this level holds, then it would mark a retest of the previously held support area.
A decline off this level will see the bearish trend resuming. The lower support at 1.2582 remains key to the downside.
Oil Markets on the Backfoot as Trade Euphoria Clears
Crude oil prices were on the backfoot following the weekend comments from President Trump. The President dismissed reports of an early rollback of tariffs as reported last week.
However, Trump said that the trade talks were progressing smoothly. The initial euphoria of progress on the trade talks looks to be putting pressure on oil prices as well.
WTI Crude Oil Consolidating Near Current Highs
Oil prices are pulling back from the intraday lows. However, the gains look to be stuck near the resistance area of 57.87 – 57.64.
A reversal off the resistance level could trigger short term declines. The minor support at 56.28 will be key in the near term. A close below this level will, however, see oil prices retreating again.
The H4 chart shows a new descending tendency. After forming several reversal patterns, such as Doji, EURUSD is trading close to the channel’s downside border. We may assume that later the price may reverse and then resume growing to reach 1.1110 in order to continue the descending channel. However, one shouldn’t exclude a possibility that the price may continue falling towards 1.1011.
USDJPY, “US Dollar vs. Japanese Yen”
As we can see in the H4 chart, the ascending tendency continues. After completing the correction, USDJPY has already formed another reversal pattern, Doji, in the middle of the channel. Later, the pair may reverse and resume growing towards the channel’s upside border at 109.65 to continue forming the ascending tendency. At the same time, the pair may choose another scenario and start a new decline to reach 108.65.
Attention! Forecasts presented in this section only reflect the author’s private opinion and should not be considered as guidance for trading. RoboForex LP bears no responsibility for trading results based on trading recommendations described in these analytical reviews.
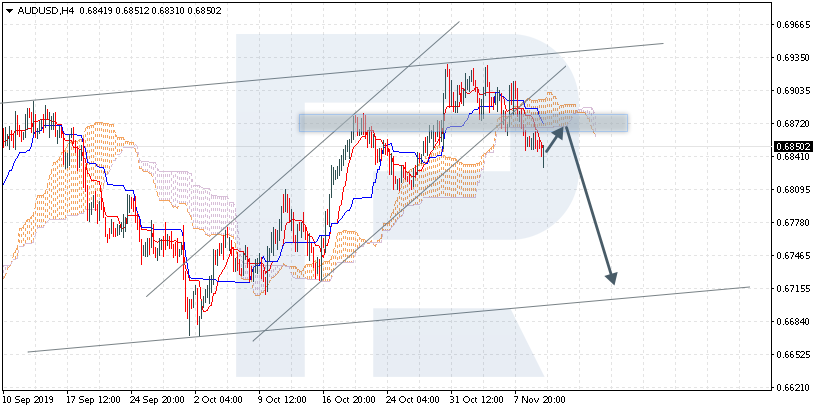
AUDUSD is trading at 0.6850; the instrument is moving below Ichimoku Cloud, thus indicating a descending tendency. The markets could indicate that the price may test the cloud’s downside border at 0.6870 and then resume moving downwards to reach 0.6715. Another signal to confirm further descending movement is the price’s rebounding from the rising channel’s downside border. However, the scenario that implies further decline may be canceled if the price breaks the cloud’s upside border and fixes above 0.6930. In this case, the pair may continue growing towards 0.7025.
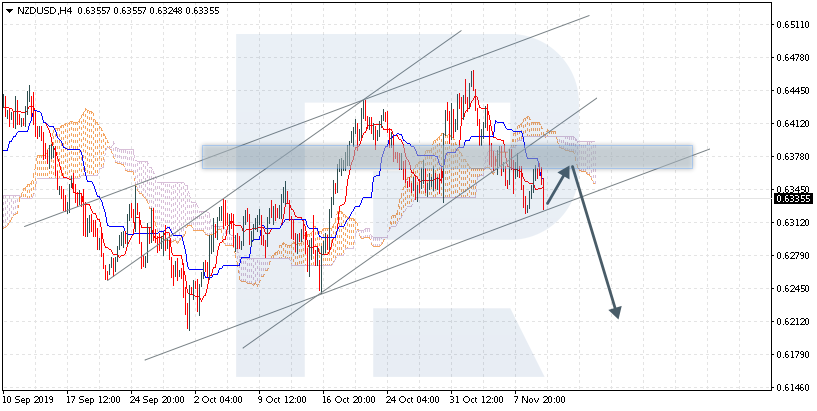
NZDUSD, “New Zealand Dollar vs US Dollar”
NZDUSD is trading at 0.6335; the instrument is moving below Ichimoku Cloud, thus indicating a descending tendency. The markets could indicate that the price may test the cloud’s downside border at 0.6355 and then resume moving downwards to reach 0.6215. Another signal to confirm further descending movement is the price’s rebounding from the resistance level. However, the scenario that implies further decline may be canceled if the price breaks the cloud’s upside border and fixes above 0.6420. In this case, the pair may continue growing towards 0.6515. After breaking the rising channel’s downside border and fixing below 0.6295, the price may continue moving downwards.
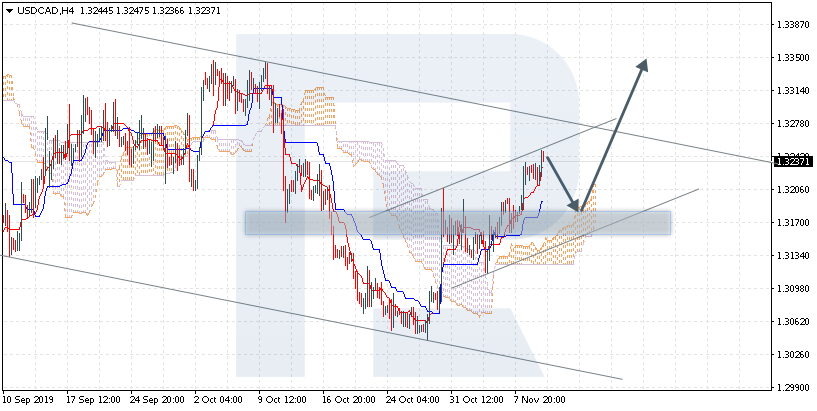
USDCAD, “US Dollar vs Canadian Dollar”
USDCAD is trading at 1.3237; the instrument is moving above Ichimoku Cloud, thus indicating an ascending tendency. The markets could indicate that the price may test the cloud’s upside border at 1.3190 and then resume moving upwards to reach 1.3350. Another signal to confirm further ascending movement is the price’s rebounding from the support level. However, the scenario that implies further growth may be canceled if the price breaks the cloud’s downside border and fixes below 1.3105. In this case, the pair may continue falling towards 1.3015.
Attention! Forecasts presented in this section only reflect the author’s private opinion and should not be considered as guidance for trading. RoboForex LP bears no responsibility for trading results based on trading recommendations described in these analytical reviews.
The US dollar does not change a lot against a basket of currency majors. The dollar index (#DX) closed yesterday’s trading session in the red zone (-0.17%). Investors expect news regarding China-US trade relations. It should be recalled that US President Donald Trump first said that the negotiations were “going well,” and then said that it was still unknown whether the United States would cancel tariffs for China. Trump’s trade adviser Peter Navarro also said that canceling tariffs was not part of the “phase one” agreement. Investors expect Trump’s speech at a meeting of the Economic Club of New York.
The situation in Hong Kong, where massive protests have been continuing for more than five months, is in the focus of attention. Hong Kong police have started using military weapons and tear gas against demonstrators. Protesters have started blocking roads and metro lines. These events support the demand for safe-haven currencies.
The British pound has been growing against the US currency. On the eve of the December 12 elections, the position of Prime Minister Boris Johnson was improved, as Brexit Party leader Nigel Farage announced that he and his party would not run in seats won by conservatives in 2017. Instead, he intends to focus on not allowing officials who argued against Brexit to gain a majority in parliament.
The “black gold” prices have been growing. Currently, futures for the WTI crude oil are testing the $57.05 mark per barrel.
Market Indicators
Yesterday, there was a variety of trends in the US stock markets: #SPY (-0.19%), #DIA (+0.03%), #QQQ (-0.13%).
The 10-year US government bonds yield is at the level of 1.93-1.94%.
The Economic News Feed for 12.11.2019:
– Data on the labor market in the UK at 11:30 (GMT+2:00);
– German ZEW economic sentiment index at 12:00 (GMT+2:00).
We also recommend paying attention to the speech by US President Donald Trump and FOMC representatives.
On Monday the 11th of November, trading on the EURUSD pair ended in growth. The price recovered from 1.1017 to 1.1043. Growth was limited by the fall of the EURGBP. Sterling has strengthened throughout the market after Nigel Farage’s statements ahead of the general election that his Brexit Party will not run candidates in areas held by the ruling Conservatives. Also on Tuesday, the United Kingdom released third-quarter GDP data, which confirmed that the economy managed to avoid falling into technical recession.
It was a public holiday in the USA. We attribute the fall in activity in the American session to the holiday.
Bulls fought back from the 135th degree, but the price has not yet left the reversal zone (1.1014-1.1043). Since Monday was a public holiday in America, market activity is set to recover today.
The price is on the balance line. We believe that upward movement will come in three waves. Almost all the euro crosses are in the black, except for EURGBP and EURAUD. The euro will immediately accelerate upwards if we get an upwards correction on the EURGBP pair. The downwards correction from 1.1043 made up 61.8% of the increase.
According to Friday’s forecast, the target was 1.1060. If the three impulse waves will be approximately equal, and bears do not defend positions near 1.1050, then bulls will be able to reach 1.1060. If sales follow from 1.1050, then be prepared to see a new low. 1.1017. The conditions for growth are met. The resistance level is set at 1.1050.
From the statistics, it is worth highlighting the report on the UK labour market, as well as ZEW indices in Germany and the Eurozone.
The EUR/USD currency pair stabilized after a significant drop last week. The trading instrument is currently consolidating. There is no defined trend. EUR/USD quotes test local support and resistance levels at 1.10150 and 1.10400, respectively. In the near future, technical correction of the EUR is not ruled out. Investors expect important statistics from Germany and the eurozone. We recommend opening positions from key levels.
The Economic News Feed for 12.11.2019:
– ZEW Economic Sentiment Index (EU) – 12:00 (GMT+2:00);
– ZEW Economic Sentiment Index (GER) – 12:00 (GMT+2:00);
We also recommend you to pay attention to the speeches of FOMC representatives.
Indicators do not provide accurate signals: the price has crossed 50 MA.
The MACD histogram is near the 0 mark.
The Stochastic Oscillator is in the neutral zone, the %K line is above the %D line, which indicates a possible correction of the EUR/USD currency pair.
Trading recommendations
Support levels: 1.10150, 1.10000, 1.09600
Resistance levels: 1.10400, 1.10600, 1.10900
If the price consolidates below 1.10150, expect the quotes to fall toward 1.09800-1.09700.
Alternatively, the quotes could correct toward 1.10600-1.10800.
The GBP/USD currency pair
Technical indicators of the currency pair:
Prev Open: 1.27937
Open: 1.28516
% chg. over the last day: +0.47
Day’s range: 1.28443 – 1.28665
52 wk range: 1.1959 – 1.3385
Yesterday, aggressive purchases were observed on the GBP/USD currency pair. The quotes grew by to more than 80 points. Demand for the pound rose after reports that the Brexit Party will not dispute the seats currently held by the conservative party in the December 12 elections. Currently, GBP/USD quotes are consolidating. The local support and resistance levels are: 1.28450 and 1.28750, respectively. A trading instrument has the potential for further growth. We look forward to important economic releases from the UK. Open positions from key levels.
At 11:30 (GMT+2:00) expect a report on the labor market in the UK.
The price fixed above 50 MA and 100 MA, which signals the strength of buyers.
The MACD histogram is in the positive zone, but below the signal line, which gives a weak signal to buy GBP/USD.
The Stochastic Oscillator is in the neutral zone, the %K line is above the %D line, which also indicates bullish sentiment.
Trading recommendations
Support levels: 1.28450, 1.28200, 1.27900
Resistance levels: 1.28750, 1.29000, 1.29300
If the price consolidates above 1.28750, expect further growth of GBP/USD quotes 1.29000-1.29300.
Alternatively, the quotes could decrease toward 1.28000.
The USD/CAD currency pair
Technical indicators of the currency pair:
Prev Open: 1.32184
Open: 1.32318
% chg. over the last day: +0.05
Day’s range: 1.32223 – 1.32492
52 wk range: 1.2727 – 1.3664
The USD/CAD currency pair continues to show a steady upward trend. The trading tool again updated the local highs. CAD is currently consolidating. The key support and resistance levels are 1.32150 and 1.32500, respectively. We do not exclude further growth of the USD/CAD quotes. We recommend that you pay attention to the dynamics of oil prices. Open positions opened from key levels.
The Economic News Feed for 12.11.2019 is calm.
The price fixed above 50 MA and 100 MA, which signals the power of buyers.
The MACD histogram is in the positive zone and above the signal line, which gives a strong signal to buy USD/CAD.
The Stochastic Oscillator is in the neutral zone, the %K line is below the %D line, which indicates a bearish sentiment.
Trading recommendations
Support levels: 1.32150, 1.31900, 1.31600
Resistance levels: 1.32500, 1.32700, 1.33000
If the price consolidates above 1.32500, expect the quotes to grow toward 1.32700-1.32300.
Alternatively, the quotes could decrease toward 1.31900-1.31700.
The USD/JPY currency pair
Technical indicators of the currency pair:
Prev Open: 109.195
Open: 109.052
% chg. over the last day: -0.15
Day’s range: 108.984 – 109.290
52 wk range: 104.97 – 114.56
An ambiguous technical pattern has developed on the USD/JPY currency pair. The trading instrument is in lateral movement. Investors expect additional drivers. At the moment, USD/JPY quotes are testing the supply zone at 109.300-109.500. The 108.900 mark is a key support. We recommend that you keep track of current information regarding the settlement of the trade conflict between the United States and China. The USD/JPY currency pair has the potential for further growth. Positions must be opened from key levels.
The Economic News Feed for 12.11.2019 is calm.
The price fixed above 50 MA and 100 MA, which signals the power of buyers.
The MACD histogram has started to rise, indicating the development of bullish sentiment.
The Stochastic Oscillator is in the overbought zone, the %K line crossed the %D line. There are no signals at the moment.
Trading recommendations
Support levels: 108.900, 108.650, 108.500
Resistance levels: 109.300, 109.500, 109.800
If the price consolidates above 109.300, expect further growth toward 109.600-109.800.
Alternatively, the quotes could descend toward 108.700-108.600.
Two decades ago, the BRIC economies were projected to surpass the advanced G6 economies by the early 2030s. Today, the huge potential of the BRICs prevails, but the pace has slowed and country trajectories have diverged. China and India are on track, Brazil and Russia are not, thanks to geopolitics.
In the early 2000s, Goldman Sachs projected that the four largest emerging economies – Brazil, Russia, India and China, or the BRICs – would surpass the major advanced economies by the early 2030s.
When the first BRICS Summit took place in Yekaterinburg, Russia in 2009, the combined economic power of the BRIC countries amounted to barely 12 percent of the collective economic power of the major advanced economies, the Group of Six (G6); the US, Western Europe (Germany, UK, France, Italy), and Japan.
At the time, the US economy was some 2.5 times bigger than that of China but amid the worst asset-bubble burst since the Great Depression. Japan, the world’s second-largest economy, was coping with a second lost decade. Chancellor Merkel’s Germany and President Sarkozy’s France still led the ailing Europe, where the global recession would soon morph into a series of sovereign debt crises. In Brazil, President Lula drove a dramatic growth catch-up, while reducing historical income polarization. In Manmohan Singh’s India, growth was accelerating. In Russia, President Putin had multiplied the size of the economy by more than five-fold in one decade, thanks to rising energy prices.
But where are the BRICs today?
Projected Versus Actual Growth
To gain a better understanding of what has happened in the past two decades, let’s compare Goldman Sachs’s original BRIC projections in the 2000s, which rested on the economic development in the 1980s and 1990s, with the actual BRIC prospects today, which are the net effect of the past two decades.
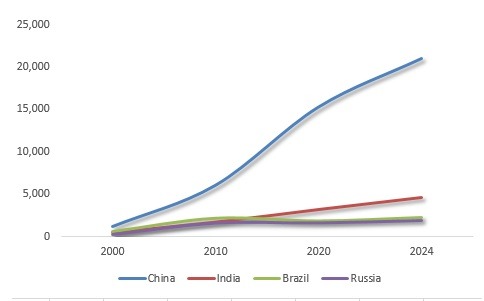
What Goldman Sachs projected was a dramatic expansion of China whose GDP was anticipated to grow more than 14-fold between 2000 and 2025. At the same time, India’s economy would increase by almost tenfold and was projected to grow relatively faster than China in the late 2010s. Brazil was expected to expand fivefold and Russia more than tenfold. In light of the fact that, in the same time period, the US, the largest advanced economy, was projected to expand more than twofold, these were stunning projections indicating solid catch-up growth in the largest emerging economies.
So what happened? Here’s the bottom line: If peaceful conditions prevail and trade protectionism can be kept in check, China could deliver more than expected, while India is on track as well. However, the potential of Brazil and Russia, respectively, has been undermined by geopolitics (Figure 1).
Figure 1Expansion by BRIC Economies, 2000-2024
Sources: IMF; Difference Group.
After China joined the World Trade Organization (WTO) in 2001, its economic expansion intensified dramatically, fueled by the export-led growth model. Since the early 2010s, that model has been morphing toward consumption and innovation. By the mid-2020s – again, assuming peaceful conditions and managed trade tensions – China’s economy could expand more than 17 times, relative to its size in 2000. It is set to surpass the size of the US economy in the 2030s, which may well be the key to the Obama military pivot to Asia in the early 2010s and to Trump tariff wars more recently.
While India’s growth trajectory has periodically slipped, it has been pushed harder by Prime Minister Narendra Modi, despite recent growth pains. If things go right, India’s economy could expand the projected tenfold by the mid-2020s. New Delhi is engaged in a cautious balancing act between economic development and rising prosperity, which is what the country needs, and geopolitics and rearmament, which is what Washington would prefer.
Under President Lula’s leadership, Brazil’s GDP grew even faster than expected by the original BRIC projection. But since the mid-2010s, the contested impeachment of President Rousseff and particularly the imprisonment of Lula, Brazil’s growth trajectory has plunged. The geopolitical soft coup, which critics claim paved the way to radical right’s President Bolsonaro and the dreams of a new military dictatorship, could result in a lost decade. By the mid-2020s, Brazil’s GDP may reach the level where it first was at the end of the Lula era, already in the early 2010s.
Instead of being almost a fifth of the US GDP by the mid-2020s, Brazil’s economy may prove to be less than 9 percent of the US (over half smaller than originally projected). The dreams of tens of millions of Brazilians of a better future have been undermined.
In Russia, President Putin was able to reverse the economy’s drastic fall in the 1990s and restore the growth trajectory in the 2000s, when Russian economic prospects were in line with the BRIC projections. As Stephen F. Cohen has argued, Washington initiated a “new Cold War” against Russia before the 2008 global crisis. Due to the continued softness in oil prices and particularly the still ongoing sanctions, the Russian economy could have been almost a fifth of the U.S. economy by 2025. Thanks to the new Cold War, the Russian economy could prove to be less than a tenth of the US GDP in the period. Thanks to the new Cold War, Russian economy could prove to be less than a tenth of the US GDP in the period.
Russian economy could increase by six to seven times, but it cannot deliver its full potential.
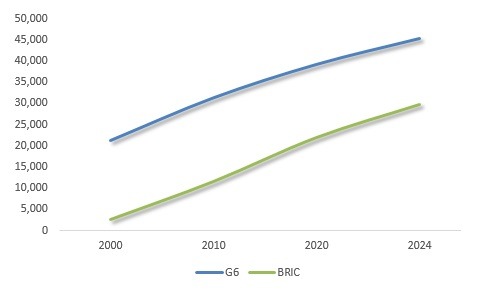
BRICspositioned to surpass G6 in early 2030s
The peak of the advanced economies’ global power was in the 1980s and ‘90s. In 2000, the economies of the major advanced nations of the “West,” as reflected by the G6, were still almost ten times bigger than the BRICs. But increasing debt, military overstretch and aging populations have hit hard the advanced West.
In 2010, the BRICs accounted for more than a third of the G6; and in the mid-2020s, that figure will be two-thirds of G6. The original Goldman Sachs projections suggested the BRICs would catch up with G6 by the late 2020s. Thanks to geopolitical interventions, the actual convergence is likely to take a 5-10 years longer (Figure 2).
Figure 2G6 Economies and the BRICs’ Catch-Up, 2000-2024
Sources: IMF; Difference Group.
Of course, if the six G6 countries would be compared with the six largest emerging economies – not just the four BRICs – Indonesia and Mexico could be added to the group. In that case, convergence would happen a few years earlier.
As International Monetary Fund reported in 2007, the large emerging economies have fueled global economic prospects since the 2000s. Recent efforts to undermine their economic potential reflect efforts at destabilization and regime change, critics argue. In the absence of significant policy U-turn, collateral damage is spreading.
As US pivot to Asia is promoting competition rather than cooperation, the economic promise of the Asian Century is threatened. The Trump tariff wars have played a key role in the plunge of world trade, the fall of world investment and rising migration barriers, which have caused the number of the globally displaced to soar to more than 70 million; far higher than they were after World War II. At the same time, global economic prospects continue to diminish in a way that could push major advanced economies into secular stagnation earlier than anticipated.
Spearheading the world’s largest emerging and developing economies, China, India, Brazil and Russia together pace global economic prospects. And as they go, so will the world economy.
About the Author:
Dr. Dan Steinbock is the founder of Difference Group and has served as research director at the India, China and America Institute (USA) and visiting fellow at the Shanghai Institutes for International Studies (China) and the EU Center (Singapore). For more, see http://www.differencegroup.net/
The original commentary was released by China-US Focus on November 10, 2019.
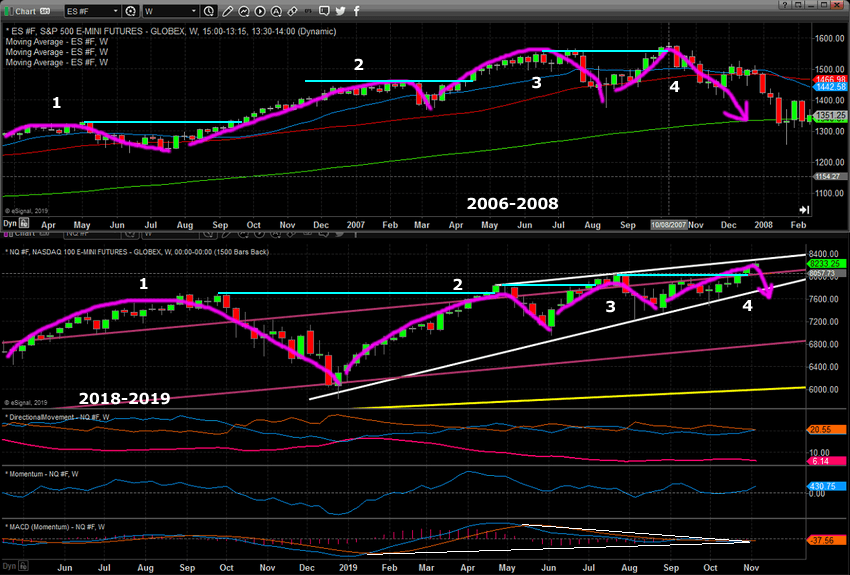
In Part I of this research post, we highlight how the ES and Gold reacted 24+ months prior to the 2007-08 market peak and subsequent collapse in 2008-09. The point we were trying to push out to our followers was that the current US stock market indexes are acting in a very similar formation within a very mature uptrend cycle.
We ended Part I with this chart, below, comparing 2006-08 with 2018-19. Our intent was to highlight the new price high similarities as well as the price rotation similarities between the two critical peaks in market price. We are terming the current market a “Zombie-land” because it appears global investors are somewhat brain-dead as to the total risks that are setting up in the global markets right now. But, wait before you continue reading make sure to opt-in to our free market trend signals newsletter.
Forward guidance is waning. Earning expectations are decreasing. Debt levels are skyrocketing all over the planet. Global banks are continuing to move into more Quantitative Easing measures to attempt to spark growth. The equity markets are 9+ years into a rally while the global central banks are 10+ years into some form of continued QE efforts. Global economic data suggests a moderate downturn in economic activity and growth for many foreign nations. We believe the next crisis will not originate in the US, but from outside the US. We believe the risks associated with the massive debt levels in the foreign markets will be the reason for another price decline. Quite possibly, a commodity price collapse (think OIL) will become the catalyst for this event.
If Oil were to fall below $45…
If Oil were to fall below $45 (eventually possibly flirting with the $30 price level) as our predictive modeling suggests, then we believe many foreign nations will suddenly become serious risk factor related to debt/credit and could potentially create a domino-process where the US/Global markets collapse on this new risk factor. Our last predictive model signal was for natural gas and we just close out the trade locking in 19% profits this week.
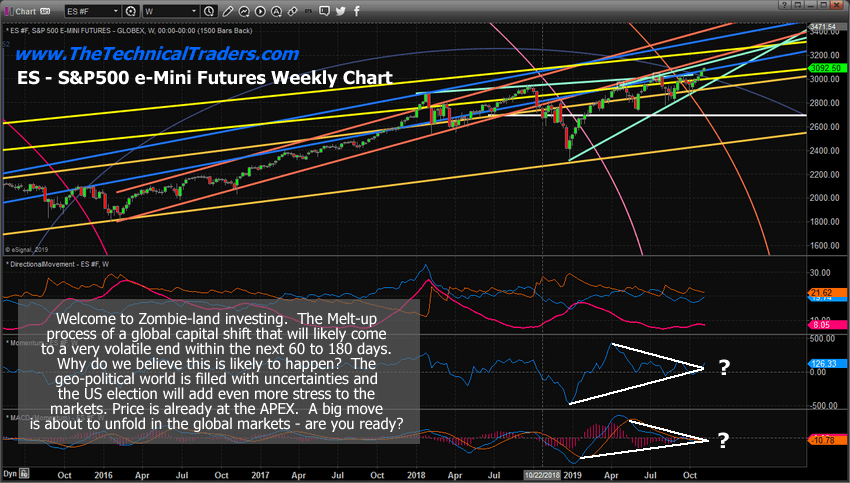
Is 2007 setting up all over again?
But what if this is 2007 setting up all over again? Take a look at the ES chart above – where a peak setup in May/June 2007, followed by a deep price correction. Follow that price move even further to see how price rallied to a new all-time high throughout July, August and most of September before setting up in a deeper price rotation in late September and carrying forward into October. Now, take a look at this current ES Weekly chart to see if there is any similarity between them.
Gold up 50% From Its Lows Already
Gold has already rallied nearly 49% from the 2015 lows and the recent price rotation is somewhat similar to what happened to Gold in 2006-2007. The extended base that set up between 2017 and 2018 could be interpreted as a similar type of base that set up in 2006-07. The current rally is somewhat similar to what happened in late 2007 and early 2008 when the US stock market began to collapse volatility expanded in a strong uptrend which was followed by a moderate price retracement before Gold began a rally totaling more than 250% from the base/bottom. Is this setup happening again right now?
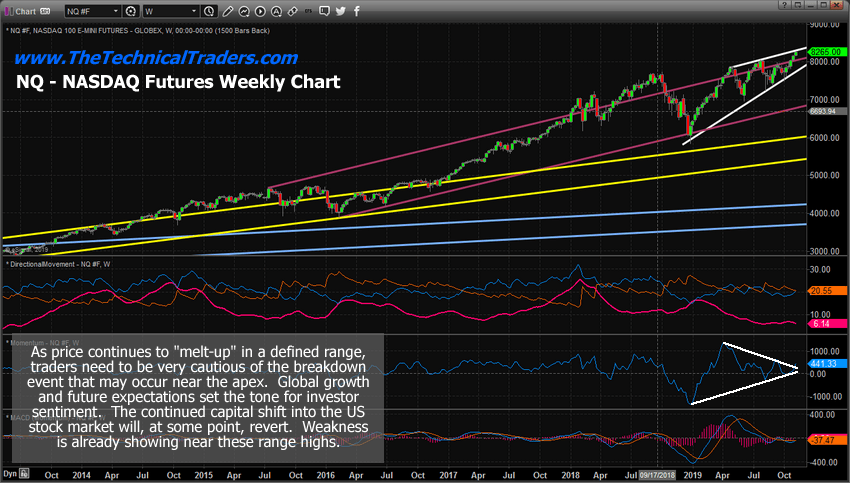
Weekly NQ chart shows the extended melt-up
This Weekly NQ chart shows the extended melt-up that is taking place after the October to December deep price rotation that took place in 2018. We believe this deep price rotation is similar to the deep price rotation that happened between July and September 2007. The subsequent “melt-up” process is a function of the “zombie-land” function of price and bias. Investors chase after security and returns by pushing the price higher and higher when fundamentals and expectations don’t align with these expectations. This same type of “zombie-land melt-up” happened in 2007 as well.
We understand the implications of this research post and want to warn all of our followers they need to be extremely cautious of the current market setup. Even though the US stock market may continue an upside bias within a melt-up process, we believe there are very strong underlying risks in the markets that could prompt a very deep price correction.
The US Fed is not lowering rates because …
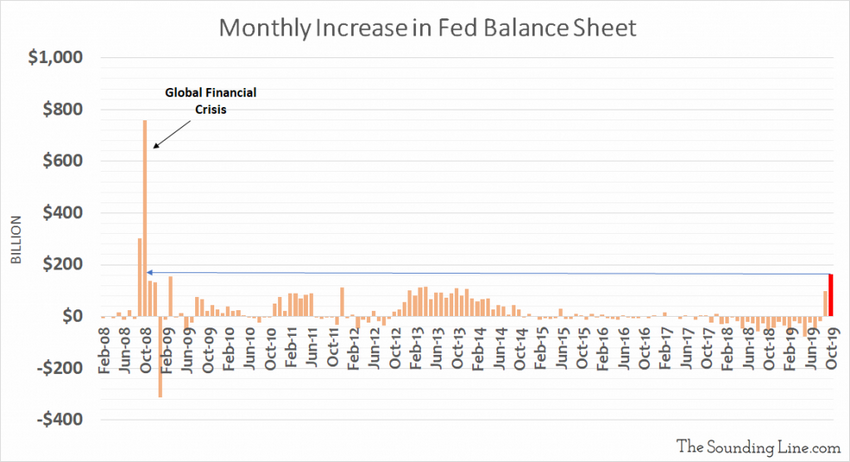
The US Fed is not lowering rates because of market strength and super strong forward guidance. They are lowering rates because they believe risks exist in the debt/credit market and are trying to stay ahead of a big problem – a potentially very big problem. The overnight REPO market has been a topic for our researchers for the past 45+ days as this temporary institutional debt tool has exploded recently. Now, the US Fed has actively decreased rates and has begun acquiring more debt on its balance sheet.. hmm. That seems strangely similar to another credit/debt crisis event.
We know many of our followers may consider this just another warning from a bunch of doom-sayers again. We’re not wishing for this outcome – trust us. We simply look at the technical data, determine a probable outcome and present our findings to our followers to try to keep them informed.
Too many similarities are starting to align to make this just some strange coincidence. Too many unknowns and uncertainties are aligning just 12 months before a US presidential election cycle. It seems strangely familiar to us that these same types of price events are unfolding now. If there is no correlation then we’ll likely be incorrect in our analysis. But if we are right and there is a major price reversion event setting up, we think it is wise to alert as many of our friends as possible.
Keep reading our research because our proprietary tools have been nailing all of these price targets and move many months in advance.
I urge you visit my ETF Wealth Building Newsletter and if you like what I offer, join me with the 1-year subscription to lock in the lowest rate possible and ride my coattails as I navigate these financial market and build wealth while others lose nearly everything they own during the next financial crisis. Join Now and Get a Free 1oz Silver Bar!
As a technical analysis and trader since 1997, I have been through a few bull/bear market cycles. I believe I have a good pulse on the market and timing key turning points for both short-term swing trading and long-term investment capital. The opportunities are massive/life-changing if handled properly.
On Monday, Alibaba’s Single’s Day broke all records. Chinese consumption and ecommerce signal not just continued resilience but evident strength.
By 5 pm on Monday Alibaba Group had already broken last year’s record of $31 billion. And at midnight, the new record soared to $38.3 billion – 25 percent higher than last year.
Despite the continuing – and misleading – international headlines about China’s “slowing economy” and “consumption collapse,” Alibaba’s 11th Single’s Day gala alone generated more revenues than US Black Friday and Cyber Monday combined.
Alibaba’s Singles’ Day shopping festival is not just the world’s largest of its kind. It is a vital barometer of Chinese consumption amid the US tariff wars.
Double 11 Is Regionalizing and Internationalizing
According to Alibaba, more than 200,000 brands participated in the 11th Singles D – ay promotion – or the “Double 11” as it is popularly known – with 1 million new products being offered and over 500 million users forecast to spend; that’s 100 million more than last year.
This year Alibaba deployed its highly popular online shopping platforms, Tmall and Taobao, but also business-to-business ecommerce platforms, like AliExpress, and Lazada, the shopping site favored in Southeast Asia. As business began, the top regions in mainland in terms of transactions were Guangdong, Zhejiang, Jiangsu, Shanghai and Shandong. However, Alibaba is also tapping regional, even international consumers.
In the early hours, the most active overseas buyers included Hong Kong, the US, Australia and Japan. Even before the festival on Monday, some 64 brands, such as Apple, Lancome, Dyson and L’Oreal, garnered millions of dollars in Alibaba pre-orders, with Estée Lauder garnering a record $143 million.
Double 11 is now a big win-win opportunity not just for China but for international exporters from advanced and developing countries alike.
Ecom Success Reflects Chinese Cost-Efficiency, Innovation
In China, ecommerce explosion began in the mid-2010s. But as business has mobilized in the past half a decade, transactions occur smoothly with smartphones and volumes are soaring.
Today Chinese consumers use smartphones to browse top online shopping sites, such as Alibaba’s Taobao.com, and submit orders. It is the net effect of 15-20 years of innovation by Chinese smartphones, mobile operators and ecommerce giants.
In the early 2000s, NTT DoCoMo probably had the best mobile services, but since the Japanese operator failed to internationalize, it lost its edge. The Finnish Nokia developed popular 2G, even 3G services, but moved too slowly into smartphones.
That’s how Apple’s iPhone captured the early lead in smartphones. Yet, it could not respond to a new generation of Chinese smartphones by Huawei and its peers – Xiaomi, Vivo, and Oppo – which now dominate 75 percent of the global smartphone market and are more cost-efficient and more innovative. Nor could the US companies, despite their early lead in the fixed-line Internet, match the co-innovation of Chinese operators and ecommerce giants, such as Alibaba.
That’s why Chinese pioneers are already launching 5G services, while pioneering 6G platforms. And that’s also why the White House keeps resorting to anti-competitive means seeking to undermine Huawei’s legitimate success.
Explosion of Chinese online consumption
Through the 16 months of US tariffs, international headlines have predicted doom and gloom in China. And yet, Chinese industrial production picked up in September, despite reduced export growth. Third-quarter data reflected resilience of consumption. And while US trade wars have made consumers cost-conscious, retail sales climbed to 7.8 percent, thanks to slate of policy supports.
Alibaba’s success and the new Double 11 record mimic the broader consumption trends in China. The same goes for urbanization. As the growth momentum in the mainland has been shifting from the coastal first-tier cities to lower-tiered cities, gains in purchasing power in small-and-medium size cities drove Double 11 sales.
When Alibaba’s ecommerce gala began on Monday, the China International Import Expo (CIIE) had just ended in Shanghai. In that bonanza, the value of intended deals exceeded $71 billion, up 23 percent from the first expo in 2018 – mimicking Alibaba’s sales triumph.
The Double 11 and Shanghai CIIE records and the consumption data in the past few quarters offer abundant evidence that Chinese consumption is far more resilient and stronger than ideological eadlines in the West presume.
About the Author:
The author is the founder of Difference Group. He has served at the India, China and America Institute (US), Shanghai Institutes for International Studies (China) and the EU Center (Singapore).