CNHRUB Analysis: Getting ready for the publication of significant statistics

By IFCMarkets

Getting ready for the publication of significant statistics

In this review, we suggest to consider the personal composite instrument (PCI) CNHRUB. It reflects the price dynamics of oil against the Canadian dollar. Will the CNHRUB quotations grow?

Such a movement on the chart is observed in case of the weakening of the ruble and strengthening of the yuan against the US dollar. The data on the industrial production growth and the GDP data for October 2019 was published in Russia on November 2019. According to forecasts, it will be less than 3% и 2%, observed in September. The data on retail sales and industrial product for October will come out on November 14, 2019 in China. The growth of given indicators is expected, if compared with September. The expectations of the decrease in the rate of Central Bank of Russia, which is now 6.5% can be an additional negative for ruble. In October, deflation was observed in Russia. The growth of consumer prices has slowed up to 3,8% in annual terms, if compared with 4% in September. The positive side for yuan can be the conclusion of the trade agreement between China and USA and the abolition or easing of mutual sanctions and tariffs.

CNHRUB

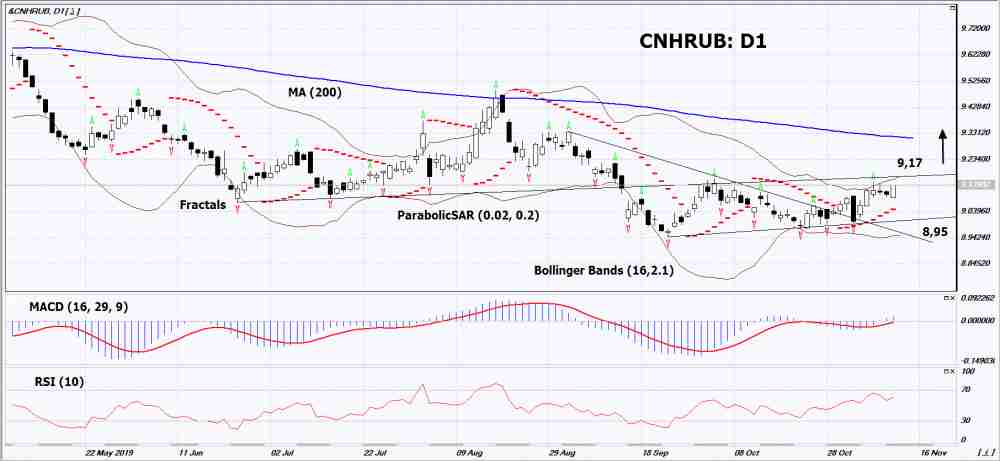
On the daily timeframe, CNHRUB: D1 has left the downtrend to move upwards. Before opening a buy position, it should breach the upper boundary of that rising channel. A number of technical analysis indicators formed buy signals. Further growth of quotations is possible in the case of positive macroeconomic and political data from China and statements about a rate cut by the Central Bank of the Russian Federation.

  • The Parabolic Indicator gives a bullish signal
  • The Bolinger bands narrowed, indicating a volatility decrease. Both Bollinger Lines Slope Up.
  • The RSI indicator is above 50. No divergence.
  • The MACD indicator gives a bullish signal.

The bullish momentum may develop in case of CNHRUB exceeds the upper Bollinger line and its last upper fractal: 9,17. This level can be used as an entry point. The initial stop lose should be placed below the last fractal low, the Parabolic signal, the minimum since March 2018 and the lower Bollinger line: 8,95. After opening the pending order, we shall move the stop to the next fractal low following the Bollinger and Parabolic signals. Thus, we are changing the potential profit/loss to the breakeven point. More risk-averse traders may switch to the 4-hour chart after the trade and place there a stop loss moving it in the direction of the trade. If the price meets the stop level (8,95) without reaching the order (9,17), we recommend to close the position: the market sustains internal changes that were not taken into account.

Summary of technical analysis

PositionBuy
Buy stopAbove 9,17
Stop lossBelow 8,95

Market Analysis provided by IFCMarkets

The EIA Is Grossly Overestimating U.S. Shale

By OilPrice.com

The prevailing wisdom that sees explosive and long-term potential for U.S. shale may rest on some faulty and overly-optimistic assumptions, according to a new report.

Forecasts from the U.S. Energy Information Administration (EIA), along with those from its Paris-based counterpart, the International Energy

Agency (IEA), are often cited as the gold standard for energy outlooks. Businesses and governments often refer to these forecasts for long-term investments and policy planning.

In that context, it is important to know if the figures are accurate, to the extent that anyone can accurately forecast precise figures decades into the future.

A new report from the Post Carbon Institute asserts that the EIA’s reference case for production forecasts through 2050 “are extremely optimistic for the most part, and therefore highly unlikely to be realized.”

The U.S. has more than doubled oil production over the past decade, and at roughly 12.5 million barrels per day (mb/d), the U.S is the largest producer in the world. That is largely the result of a massive scaling-up of output in places like the Bakken, the Permian and the Eagle Ford. Conventional wisdom suggests the output will steadily rise for years to come.

It is worth reiterating that after an initial burst of production, shale wells decline rapidly, often 75 to 90 percent within just a few years. Growing output requires constant drilling. Also, the quality of shale reserves vary widely, with the “sweet spots” typically comprising only 20 percent or less of an overall shale play, J. David Hughes writes in the Post Carbon Institute report.

After oil prices collapsed in 2014, shale companies rushed to take advantage of the sweet spots. That allowed the industry to focus on the most profitable wells first, cut costs and scale up production. But it also pushed off a problem for another day. “Sweet spots will inevitably become saturated with wells, and drilling outside of sweet spots will require higher rates of drilling and capital investment to maintain production, along with higher commodity prices to justify them,” Hughes says in his PCI report.

In addition, this form of “high-grading” does allow for rapid extraction, but it doesn’t necessarily mean that more oil is ultimately going to be recovered when all is said and done.

The same might be true for all of the highly-touted productivity gains, Hughes says. The industry has boosted productivity by drilling longer laterals, intensifying the use of water and frac sand, as well as increasing the number of fracking stages. These productivity improvements are “undeniable,” Hughes writes.

However, the “limits of technology and exploiting sweet spots are becoming evident, however, as in some plays new wells are exhibiting lower productivities,” Hughes says. “More aggressive technology, coupled with longer horizontal laterals, allows each well to drain more reservoir area, but reduces the number of drilling locations and therefore does not necessarily increase the total recovery from a play—it just allows the resource to be recovered more quickly.”

Already, some shale plays have seen production plateau while others are in decline.

In short, Hughes says that of the 13 major shale plays analyzed in the PCI report, the EIA has “extremely optimistic” outlooks for nine of them. Of the remaining four, three of them are “highly optimistic,” and only one – the Woodford Play in Oklahoma – is ranked as “moderately optimistic.”

He notes that in some instances, the EIA’s forecasts are so optimistic that the production volumes exceed the agency’s own estimates for proven reserves plus unproven reserves. The EIA also assumes that every last drop of proven reserves is produced, along with a high percentage of unproven reserves by 2050.

“Although the ‘shale revolution’ has provided a reprieve from what just 15 years ago was thought to be a terminal decline in oil and gas production in the U.S.,” Hughes writes, “this reprieve is temporary, and the U.S. would be well advised to plan for much-reduced shale oil and gas production in the long term.”

Regardless of the geology, climate policy and waning investor interest will likely result in a lot of oil being left in the ground. Hughes says that the EIA’s figures are optimistic, even without considering any mandates to cut greenhouse gas emissions. “If U.S. energy policy actually reflected the need to mitigate climate change…the EIA’s forecasts for tight oil and shale gas production through 2050 make even less sense.”

Link to article: https://oilprice.com/Energy/Crude-Oil/The-EIA-Is-Grossly-Overestimating-US-Shale.html

By Nick Cunningham of Oilprice.com


Dollar Attempts To Pare Losses

By Orbex

The US dollar index was trading in the green on Tuesday. This comes a day after prices fell, snapping a five-day gain.

Economic data from the United States was sparse. President Trump spoke late Tuesday at the Economic Club of New York. Besides a few references to the Fed, there wasn’t much about the trade talks.

German Investor Sentiment Rises in November

Investor sentiment in Germany rose more than expected in November. The ZEW economic sentiment index rose to -2.1, up from -22.8 from the previous month. The data also came out better than the forecasts of -13.2.

For the rest of the eurozone, the economic index rose to -1.0 from -23.5 previously.

EURUSD Testing Support

The EURUSD continued to decline. Price action remains weak, testing the support area of 1.1000.

However, on the 4-hour chart, the Stochastics oscillator is forming a bullish divergence. If price bounces to the upside, the common currency will test the resistance area of 1.1075 – 1.1062 level.

UK Unemployment Rate Falls to 3.8%

The latest labor market data in the United Kingdom saw the unemployment rate falling to 3.8%. The unemployment rate was better than the estimates of 3.9%.

However, the claimant count change rose to 33k, which was more than the estimates of 24.2k. Average hourly earnings dipped slightly to 3.6%.

GBPUSD Retesting Resistance

The pound sterling is retesting the resistance level of 1.2864. If prices breakout above this level, the currency pair will be rising to test the next level higher at 1.2960. Price action is likely to remain range-bound in the near term.

To the downside, GBPUSD will need to clear the minor support at 1.2808 for any declines.

OPEC Decides to Maintain Production Cuts

OPEC member nations and Russia confirmed that the current production cuts will continue through to next year. The report comes ahead of the OPEC meeting due in December.

The nations will take a review of the production cuts that will last until March 2020. The report dismisses earlier claims about efforts to cut production further. Oil prices were muted to the news.

WTI Crude Oil Trades Mixed Near the Top

Crude oil prices were trading mixed near the resistance area of the 57.64 – 57.87 region. Price action remains very choppy at the current levels. Failure to breakout above this level could signal a correction lower. This will bring oil prices back to the lower support at 54.71 – 54.42 level. The weekly crude oil inventory report is due to come out in two days.

By Orbex


Forex Technical Analysis & Forecast 13.11.2019 (EURUSD, GBPUSD, USDCHF, USDJPY, AUDUSD, USDRUB, USDCAD, GOLD, BRENT, BTCUSD)

Article By RoboForex.com

EURUSD, “Euro vs US Dollar”

After failing to break the descending channel, EURUSD has updated the low and may later continue the current wave to the downside; right now, it is consolidating around 1.1011. If later the price breaks this range to the upside at 1.1020, the market may resume moving upwards to reach 1.1044; if to the downside at 1.1000 – start a new decline with the target at 1.0988.

EURUSD
Risk Warning: the result of previous trading operations do not guarantee the same results in the future

GBPUSD, “Great Britain Pound vs US Dollar”

GBPUSD has completed the descending structure at 1.2815, thus forming a new consolidation range. If later the price breaks this range to the downside, the market may continue moving downwards to reach 1.2766; if to the upside – start another growth with the target at 1.2970.

GBPUSD
Risk Warning: the result of previous trading operations do not guarantee the same results in the future

USDCHF, “US Dollar vs Swiss Franc”

USDCHF has broken 0.9950; right now, it continues forming the second descending impulse with the target at 0.9905. Later, the market may start a new correction to reach 0.9950 and then resume trading downwards with the first target at 0.9892.

USDCHF
Risk Warning: the result of previous trading operations do not guarantee the same results in the future

USDJPY, “US Dollar vs Japanese Yen”

USDJPY continues consolidating around 109.06. Possibly, today the pair may fall to reach 108.67. Alter, the market may form one more ascending structure to return to 109.06 and then trade downwards with the target at 108.64.

USDJPY
Risk Warning: the result of previous trading operations do not guarantee the same results in the future

AUDUSD, “Australian Dollar vs US Dollar”

AUDUSD is still consolidating near the lows. Today, the pair may form one more ascending structure towards 0.6886 and then resume trading downwards to reach 0.6800.

AUDUSD
Risk Warning: the result of previous trading operations do not guarantee the same results in the future

USDRUB, “US Dollar vs Russian Ruble”

USDRUB is moving upwards; it has almost broken 64.04 to the upside. Possibly, today the pair may grow to reach 64.18 and then form a new descending structure towards 64.06. Later, the market may resume trading upwards with the target at 64.34.

USDRUB
Risk Warning: the result of previous trading operations do not guarantee the same results in the future

USDCAD, “US Dollar vs Canadian Dollar”

USDCAD has completed the descending impulse towards 1.3215 along with the correction at 1.3247. According to the main scenario, the price is expected to break this range downwards and start a new decline with the target at 1.3172.

USDCAD
Risk Warning: the result of previous trading operations do not guarantee the same results in the future

XAUUSD, “Gold vs US Dollar”

Gold has expanded the range towards 1445.55; right now, it is moving upwards to reach 1464.50. Later, the market may form a new descending structure with the target at 1440.84 and then resume growing towards 1482.50.

GOLD
Risk Warning: the result of previous trading operations do not guarantee the same results in the future

BRENT

Brent has reached the upside border of the range once again; right now, it is moving downwards. Possibly, the pair may break 62.10 and then continue falling with the target at 60.60. After that, the instrument may form one more ascending structure towards 64.40.

BRENT
Risk Warning: the result of previous trading operations do not guarantee the same results in the future

BTCUSD, “Bitcoin vs US Dollar”

After reaching 8535.00, BTCUSD has completed the ascending structure at 8806.00, thus forming a new consolidation range. If later the price breaks this range to the upside, the market may continue the correction to reach 9300.00; if to the downside – resume trading inside the downtrend with the target at 8050.00.

BITCOIN
Risk Warning: the result of previous trading operations do not guarantee the same results in the future

Article By RoboForex.com

Attention!
Forecasts presented in this section only reflect the author’s private opinion and should not be considered as guidance for trading. RoboForex LP bears no responsibility for trading results based on trading recommendations described in these analytical reviews.

Trump Tramples On Risk Appetite

By Orbex

Dollar Down Following Trump Comments

The US dollar has been lower over the European morning session so far on Wednesday as traders await the next key US data reading. October CPI will be released later today and will be closely watched by traders. On the back of recent data beats, a positive number could see USD upside reignited while any weakness could see a drop lower. USD index trades 98.16 as of writing.

EUR Rises on Weak USD

EURUSD has enjoyed some mild upside so far today as a result of the weaker US dollar though remains at the bottom of recent declines, trading 1.1014 last. The recent sell-off has seen price breaking back under the 1.1024 level and for now, the near term outlook remains bearish.

UK CPI Hits Three Year Lows

GBPUSD has had a volatile session so far today, making moves in both directions. UK CPI released this morning showed inflation hitting three-year lows at just 1.5% in October.  The data adds to the uncertain environment in the face of a further Brexit delay and puts focus back on possible BOE easing. GBPUSD trades 1.2844 last.

Risk Appetite Weaker

Risk assets have had a weaker start to the day with the SPX500 softening from recent highs to trade 3079.68 last. Speaking at the Economic Club of New York yesterday, Trump disappointed traders as he failed to offer any new insight on US/China trade talks ahead of the potential signing of a deal this weekend.

JPY & Gold Higher

Safe havens have been firmer this morning with both JPY and gold rising against USD in light of the pull-back in equities.  US data later today could see further gains if any weakness materialises. XAUUSD trades 1465.03 last, recovering off yesterday’s lows. USDJPY trades 108.90 last, sitting just off yesterday’s lows.

Crude Lower, EIA on Watch

Oil prices have been lower again today on the back of Trump’s comments yesterday (or lack of) which have raised uncertainty around the prospect of a US/China trade deal being agreed this weekend. Looking ahead today, traders are waiting on the weekly EIA report for the latest update on US crude inventory levels. Crude trades 56.35 last.

Loonie Eyeing Next Resistance

USDCAD has been a little softer today, retreating from yesterday’s highs as of writing. However, the move above 1.3207 has been firm and focus remains on further upside with the 1.33 level the next topside marker to watch. US CPI data later today could provide the catalyst for such a move if we see any upside surprise.

Aussie Lower on Trade Deal Uncertainty

AUDUSD has been sharply lower today as European traders sell the Aussie as a play on China. While traders have not yet ruled out a trade deal being agreed at the APEC meeting this weekend, there is certainly an air of caution being noted today. On the data front, Aussie employment data overnight tonight will be the next key driver for AUDUSD which trades .6827 last.

By Orbex


Investor Uncertainty Following Trump Talk

By Orbex

Trump Praises Economic Impact of his Presidency

Speaking at the Economic Club of New York yesterday, Trump praised the growth of the US economy.

In the comments made during his speech at the club luncheon, Trump said that we will continue to pursue policies that allow US firms to “compete and win”. Trump highlighted that over the course of his presidency, domestic manufacturers have created 600,000 jobs, while 7 million US citizens have been able to come off food stamps.

Talking to business leaders at the prestigious event, Trump said going forward:

 “We will be pro-growth, pro-American, and more is yet to come…You will see things, even in this room, you will be surprised to see. We have tremendous economic potential.”

More Trump Talk

The comments made were typical of Trump’s infamous style of speech-making, employing casual language and creating some confusion around the stats he cited.

Trump said that over the course of his presidency, the average American worker’s wages had risen by $10,000 per year. This would be an increase of $3000 per year from the $7000 figure given less than a month ago.

Trump cited a private economic research group’s report as the reference for his figures. However, the US Census reported that over 2018, average wages in the US were roughly unchanged.

Commenting further on the topic, Trump explained that roughly $2000 of the increase cited came from tax reductions made. However, industry analysts have said that the benefits from Trump’s tax reductions have amounted to less than $1000 for the average American worker.

Trump Praises Economy

Trump’s comments during the speech echo the words of a tweet he published earlier in the day.

Trump wrote:

Despite Trump’s praise of the US economy, the latest data released last month showed that growth in the US slowed to just 2% over 3Q. This is well below any record levels and down sharply from the 3.1% recorded in Q1.

Trumps Skimps on Trade Deal Comments

The main topic that traders were looking for Trump to discuss was the progress of US/China trade talks. More specifically, whether the two countries were likely to sign a deal at the APEC meetings in Chile on November 16th/17th.

However, traders were left disappointed as Trump offered no new insights. He commented only to say that his team was working on a deal. Trump did note, though, that he has decided to delay the autos tariffs he threatened on EU vehicles for a further six months.

Market Disappointed

In all, the speech was a fairly muted event. Trump refrained from shedding any light on the US/China trade negotiations, keeping uncertainty around the potential signing of a “phase one” trade deal this weekend.

The market reaction suggests that traders remain optimistic. However, they are a little more cautious that a deal is on the horizon.

Technical Perspective

The SPX500 printed yet further, new record highs yesterday on the back of Trump’s comments. The index rose to 3102.43. The upper line of the recent bullish channel continues to cap upside currently with momentum waning a little over recent days. For now, RSI continues to support the move and while we might see some retracement in the near term, further highs are likely while price remains above the 3021.82 level.

By Orbex


US Consumer Prices To Rise In October

By Orbex

The monthly consumer price index data will be coming out later today. General estimates point to a modest increase in inflation during the month of October.

Economists forecast that consumer prices will rise 0.3% on the month. Meanwhile, core CPI, which excludes the volatile food and energy prices, will rise by 0.2%.

This marks a modest increase from the month before. Headline CPI was flat in September while core CPI rose just 0.1%.

U.S. Consumer Prices, September 2019

Despite the forecasts showing an increase on the month, on a yearly basis, no changes are expected for the annual inflation rate. CPI, on a year over year basis, will remain steady at 1.7%. Annual core CPI will also remain steady at 2.4%. Both these counts mark an unchanged print from the previous month’s reading.

With no changes coming up on the annual inflation rate, the headline CPI remains below the Fed’s 2% inflation target rate. Although at 1.7% inflation is close to the Fed’s target, officials are willing to let inflation overshoot target.

This is in order for consumer prices to make up for the stubbornly low rate of increase currently.

The Fed cut rates in October. And this will likely take a bit of time to pass through into other areas. But with officials signaling that they are done with rate cuts this year, it will be interesting to see how consumer prices will fare in the coming months.

The inflation report might not do much for the markets today. But they will be critical in shaping the expectations of the Fed’s monetary policy.

Despite the central bank signaling that it was done with rate cuts, the markets are still inclining towards at least two more rate cuts in the next year. The expectations will certainly build up if inflation maintains the same current trend.

Modest Increase in Gasoline Prices

The basis for an increase in inflation comes with a rise in gasoline prices. However, the increase wasn’t so much. On average, gasoline prices in the United States rose a mere 1.8% during the month of October.

However, offsetting the gains in the gasoline prices was the rather flat print in crude oil. Brent futures were flat during October following a modest increase in the previous month.

Consumer prices in the United States are benign. However, if global data is something to go by, the recent increase in inflation from China is something to consider. Last weekend, China’s inflation report saw consumer prices rising to an eight-year high.

In October, China’s consumer prices rose 3.8% from the year before. This was one of the fastest increases in consumer prices in over seven years.

With inflation trends mirroring each other with some lag, one could expect to see a potential increase in the US inflation rate as well.

Besides gasoline prices, consumer prices are also another thing to consider.

Recent trends in the US economy show that consumer spending has been steady, although losing momentum.

The US labor market remains strong with the unemployment rate at historic lows. Still, there is evidence of a squeeze in the markets. Recent monthly payrolls report indicate that the pace of jobs added during the month is slowing.

Wage growth also remains somewhat benign. While this puts a bit of more spending power into the consumer, the price pressures are missing.

By Orbex


Fibonacci Retracements Analysis 13.11.2019 (GBPUSD, EURJPY)

Article By RoboForex.com

GBPUSD, “Great Britain Pound vs US Dollar”

As we can see in the H4 chart, the descending correction continues after reaching at 76.0% fibo at 1.3040 and the divergence on MACD. The support is at 1.2670. After completing the pullback, the instrument may start another rising impulse to break the previous high at 1.3012 and then reach the key one at 1.3381.

GBPUSD_H4
Risk Warning: the result of previous trading operations do not guarantee the same results in the future

In the H1 chart, after retesting 23.6% fibo, the pair was forced by the convergence to finish the previous descending wave and start moving upwards. It doesn’t necessarily mean that the price will continue growing to reach 1.3012, that’s why one should expect further decline with the possible targets at 38.2%, 50.0%, and 61.8% fibo at 1.2699, 1.2604, and 1.2508 respectively.

GBPUSD_H1
Risk Warning: the result of previous trading operations do not guarantee the same results in the future

EURJPY, “Euro vs. Japanese Yen”

As we can see in the H4 chart, after reaching 76.0% fibo at 121.55, the pair is correcting downwards to reach the local support at 38.2% fibo at 118.73. However, if EURJPY breaks the high at 121.47, the price may continue growing with the key target at 123.36.

EURJPY_H4
Risk Warning: the result of previous trading operations do not guarantee the same results in the future

In the H1 chart, the pair is getting closer to 38.2% fibo at 119.79. at the same time, there is s convergence on MACD, which may indicate either a reverse or a short-term pullback. Further decline may be heading towards 50.0% and 61.8% fibo at 119.27 and 118.75 respectively.

EURJPY_H1

Article By RoboForex.com

Attention!
Forecasts presented in this section only reflect the author’s private opinion and should not be considered as guidance for trading. RoboForex LP bears no responsibility for trading results based on trading recommendations described in these analytical reviews.

The Analytical Overview of the Main Currency Pairs on 2019.11.13

by JustForex

The EUR/USD currency pair

Technical indicators of the currency pair:
  • Prev Open: 1.10327
  • Open: 1.10089
  • % chg. over the last day: -0.19
  • Day’s range: 1.10060 – 1.10169
  • 52 wk range: 1.0884 – 1.1623

Bearish sentiments prevail on the EUR/USD currency pair. The trading tool once again updated local lows. Currently, EUR/USD quotes are consolidating. The local support and resistance levels are 1.10000 and 1.10250, respectively. The spotlight remains on the trade negotiations between the US and China. Yesterday, Donald Trump said that the first stage of the trade deal can be signed in the near future, but he will accept it only if it is beneficial for the US side. Today, investors will evaluate important economic releases from the United States. We recommend opening positions from key levels.

At 15:30 (GMT+2:00), the US will publish an inflation report. We also recommend paying attention to the speeches of the head of the Fed and representatives of the FOMC.

EUR/USD

Indicators point to the power of sellers: the price has fixed below 50 MA and 100 MA.

The MACD histogram is in the negative zone, but above the signal line, which gives a weak signal to sell EUR/USD.

The Stochastic Oscillator is near the overbought zone, the %K line crossed the %D line. There are no signals at the moment.

Trading recommendations
  • Support levels: 1.10000, 1.09700, 1.09500
  • Resistance levels: 1.10250, 1.10400, 1.10600

If the price consolidates below the round level of 1.10000, consider selling EUR/USD. The quotes will fall toward 1.09700-1.09500.

Alternatively, the quotes could correct toward 1.10450-1.10700.

The GBP/USD currency pair

Technical indicators of the currency pair:
  • Prev Open: 1.28516
  • Open: 1.28488
  • % chg. over the last day: -0.03
  • Day’s range: 1.28393 – 1.28612
  • 52 wk range: 1.1959 – 1.3385

GBP is trading stably against the USD. GBP/USD quotes are consolidating. Participants in financial markets expect additional drivers. At the moment, the local support and resistance levels are 1.28400 and 1.28650, respectively. The trading instrument has a potential for growth. We recommend keeping track of up-to-date information regarding the Brexit process. Open positions from key levels.

At 11:30 (GMT+2:00) the UK will publish a consumer price.

GBP/USD

Indicators do not provide accurate signals: the price is testing 50 MA.

The MACD histogram is close to the 0 mark.

The Stochastic Oscillator is in the neutral zone, the %K line is above the %D line, which indicates a bullish sentiment.

Trading recommendations
  • Support levels: 1.28400, 1.28200, 1.27900
  • Resistance levels: 1.28650, 1.29000, 1.29300

If the price consolidates above 1.28650, GBP/USD is expected to rise toward 1.29000.

Alternatively, the quotes could decrease toward 1.28100-1.27900.

The USD/CAD currency pair

Technical indicators of the currency pair:
  • Prev Open: 1.32318
  • Open: 1.32319
  • % chg. over the last day: +0.01
  • Day’s range: 1.32312 – 1.32493
  • 52 wk range: 1.2727 – 1.3664

The USD/CAD quotes stabilized after a long increase since the beginning of this month. Looney is currently consolidating. The local support and resistance levels are 1.32300 and 1.32550, respectively. We do not exclude further growth of the USD/CAD currency pair. Today we recommend you to pay attention to economic releases from the US, as well as the dynamics of prices of black gold. Open positions from key levels.

The Economic News Feed for 13.11.2019 is calm.

USD/CAD

The price fixed above 50 MA and 100 MA, which signals the power of buyers.

The MACD histogram is in the positive zone and above the signal line, which gives a strong signal to buy USD/CAD.

The Stochastic Oscillator is in the overbought zone, the %K line crossed the %D line. There are no signals at the moment.

Trading recommendations
  • Support levels: 1.32300, 1.32150, 1.31900
  • Resistance levels: 1.32550, 1.32800, 1.33000

If the price consolidates above 1.32550, expect further growth toward 1.32800-1.33000.

Alternatively, expect the quotes to descend toward 1.32000-1.31800.

The USD/JPY currency pair

Technical indicators of the currency pair:
  • Prev Open: 109.052
  • Open: 109.002
  • % chg. over the last day: -0.05
  • Day’s range: 108.869 – 109.105
  • 52 wk range: 104.97 – 114.56

The USD/JPY currency pair continues to trade flat. There is no defined trend. At the moment, the local support and resistance levels are 108.900 and 109.200, respectively. Financial market participants are waiting for new information regarding the settlement of the trade conflict between the United States and China. Today we recommend paying attention to the news background from the USA. Open positions from key levels.

The Economic News Feed for 13.11.2019 is calm.

USD/JPY

The signals of the indicators are ambiguous: 50 MA crossed 100 MA.

The MACD histogram is close to the 0 mark.

The Stochastic Oscillator is in the overbought zone, the %K line crossed the %D line. There are no signals at the moment.

Trading recommendations
  • Support levels: 108.900, 108.650, 108.500
  • Resistance levels: 109.200, 109.500, 109.800

If the price consolidates above 109.200, expect the quotes to grow toward 109.500-109.700.

Alternatively, the quotes could descend toward 108.650-108.500.

by JustForex

The Dollar Index Is Consolidating. Washington-Beijing Trade Deal Is in the Spotlight

by JustForex

The US dollar strengthened slightly against a basket of currency majors. The dollar index (#DX) closed yesterday’s trading session in the green zone (+0.12%). US President Donald Trump said he intended to substantially raise tariffs for China if the first stage of the trade agreement was not signed. According to the President, the agreement will be signed only if it is good for American companies and workers.

The British pound weakened against the US dollar after the publication of weak economic data on the UK labor market. Thus, the average earnings + bonus grew only by 3.6% in September instead of 3.8%. Initial jobless claims rose to 33.0K in October, while experts expected 24.2K.

The New Zealand dollar has been growing after the RBNZ unexpectedly left the interest rate unchanged at 1.00% per annum. The Reserve Bank was expected to reduce the indicator due to a slowdown in the country’s economy. However, the regulator noted that there was insufficient evidence to ease the policy further, so it was decided to keep interest rates at the same level.

The “black gold” prices have been declining. Currently, futures for the WTI crude are testing the $56.30 mark.

Market Indicators

Yesterday, there was the bullish sentiment in the US stock markets: #SPY (+0.21%), #DIA (+0.05%), #QQQ (+0.29%).

The 10-year US government bonds yield has been declining. At the moment, the indicator is at the level of 1.88-1.89%.

The Economic News Feed for 13.11.2019:
  • – Consumer price index in the UK at 11:30 (GMT+2:00);
  • – US inflation data at 15:30 (GMT+2:00).


We also recommend paying attention to the speech by the head of the Fed.

by JustForex