Dollar strengthening halted as budget deficit rose
US stocks extended gains on Wednesday despite reports US has met with China’s resistance to commit to buying a fixed value of US agricultural products as a part of the phase one deal. The S&P 500 added 0.1% to 3094.04. The Dow Jones industrial average rose 0.3% to 27783.59 led by 7% jump in Disney. Nasdaq gained 0.05% to 8482.10. The dollar strengthening halted as US federal budget deficit in October rose 34% from a year ago. The live dollar index data show the ICE US Dollar index, a measure of the dollar’s strength against a basket of six rival currencies, slipped less than 0.1% to 98.31 but is higher currently. Futures on US stock indices point to mixed openings.
DAX 30 led European indexes retreat
European stock indexes extended losses on Wednesday. EUR/USD continued irs slide yesterday while GBP/USD halted its decline with both pars lower currently. The Stoxx Europe 600 slipped 0.2% led by bank shares. Germany’s DAX 30 fell 0.4% to 13230.07. France’s CAC 40 slid 0.2% and UK’s FTSE 100 lost 0.2% to 7351.21 as UK inflation declined from 1.7% to 1.5% in October, the lowest level in almost three years.
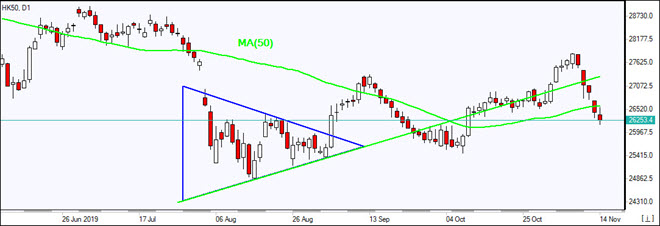
Hang Seng falls for 5th consecutive session
Asian stock indices are mixed today against the backdrop of weak data from China, Japan and Australia. Nikkei fell 0.8% to 23141.55 with yen advance against the dollar intact after report Japan’s economy grew slower than expected in. Chinese stocks are mixed after reports China’s economy grew slower in October: the Shanghai Composite Index is 0.2% higher while Hong Kong’s Hang Seng Index is down 1.2%. Australia’s All Ordinaries Index rose 0.6% as Australian dollar’s slide against the greenback accelerated after data showed Australia’s unemployment rate inched up to 5.3% from 5.2% in September.
Brent futures prices are extending gains today. Prices resumed advancing yesterday: January Brent crude rose 0.5% to $62.37 a barrel on Wednesday. The American Petroleum Institute late Wednesday report, which was released a day later than usual because of Monday’s Veterans Day holiday, estimated US crude supplies fell by 541,000 barrels last week. Today at 16:30 CET the Energy Information Administration will release US Crude Oil Inventories.
Note: This overview has an informative and tutorial character and is published for free. All the data, included in the overview, are received from public sources, recognized as more or less reliable. Moreover, there is no guarantee that the indicated information is full and precise. Overviews are not updated. The whole information in each overview, including opinion, indicators, charts and anything else, is provided only for familiarization purposes and is not financial advice or а recommendation. The whole text and its any part, as well as the charts cannot be considered as an offer to make a deal with any asset. IFC Markets and its employees under any circumstances are not liable for any action taken by someone else during or after reading the overview.
A new advancement in bladder-related endoscopic surgery is endorsed and de-risked.
You don’t often hear about it, but bladder cancer is the sixth most common cancer in the U.S., with approximately 80,000 cases reported every year, and some 600,000 Americans living in fear of recurrence. Bladder cancer is also the most expensive cancer to treat due to the more that 50% recurrence rate and the need for life-long surveillance to the tune of $4 billion per year spent in the U.S. alone.
Marching ever closer to taking a giant slice of that market is Vancouver/Boston-based Imagin Medical Inc. (IME:CSE; IMEXF:OTCQB). The company has made a significant new advancement in one of the mission-critical procedures used in urological surgery, enabling physicians to clearly see the tumor during endoscopic procedures, and receiving overwhelmingly positive feedback from leading members of the American Urological Association. Recently its i/Blue functional product entered stage five of seven for U.S. Food and Drug Administration (FDA) design control guidance.
“Imagin Medical stock is great value here with the potential to make big percentage gains from the current very low price.” – Clive Maund
With that kind of response, this CSE/OTCQB-listed company, with a market cap of a little over $7 million, has huge catalysts ahead and is poised for a significant breakout. What kind of catalysts? The product is defined, doctors like it and the company is in the final six months of development. “Imagin has all the component parts to put together a functional product, it will have verifiable units available by year end, and is in the design verification stage with the FDA,” stated Jim Hutchens, Imagin’s CEO.
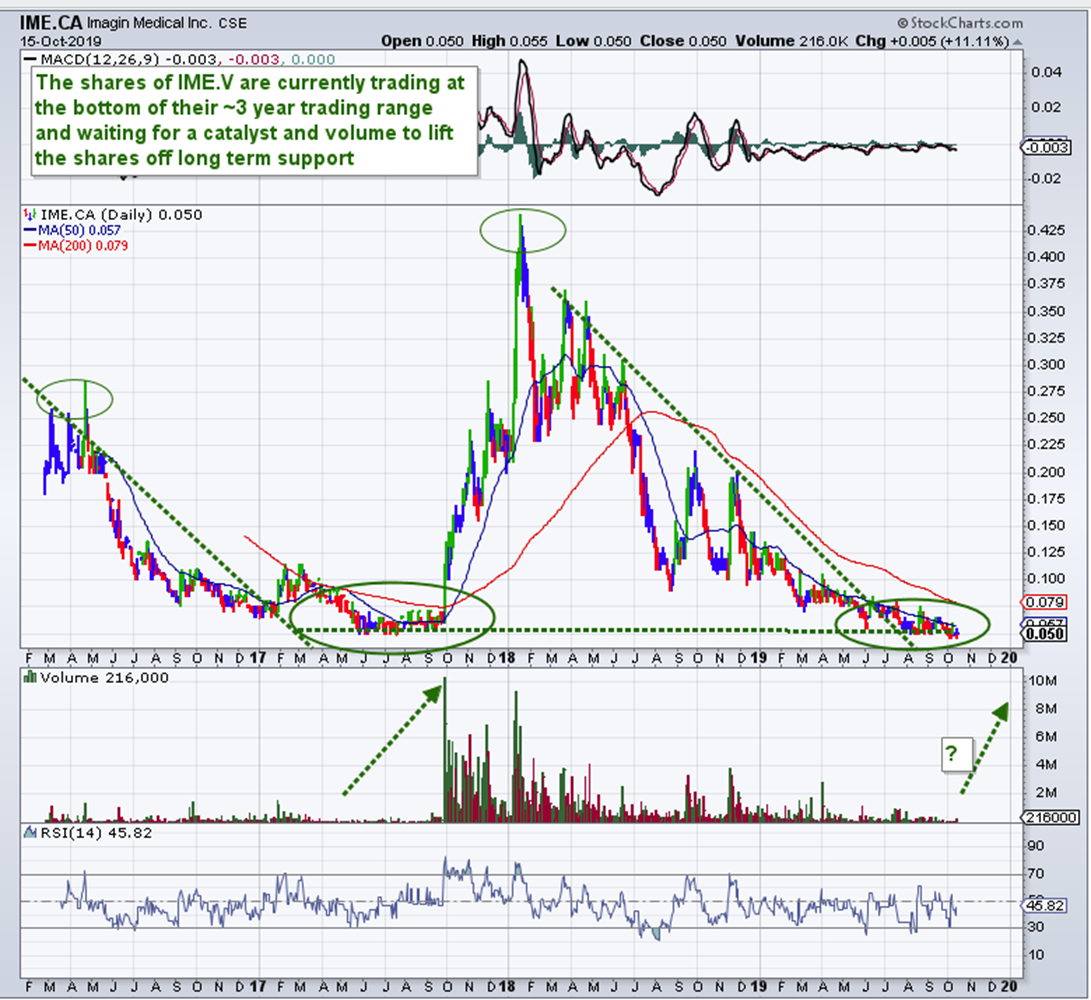
Take note: Since Imagin’s last financing of CA$3.9 million in April of 2018 at CA$0.22, its shares have been battered down to CA$0.05 by impatient investors. At this juncture, there is strong support at CA$0.05 for returning to the CA$0.22 level with room to move to the ceiling set by the related warrants at CA$0.38 due April 2020. Post-FDA approval levels should run well beyond the dollar ranges.
The company has caught the attention of investment analysts. Technical analyst Clive Maund wrote on November 8, “Whilst we cannot be 100% sure that the company’s key product will gain final approval, which is why the stock price is at a very low level, the signs are that it will and it is well along the road to getting it. So this look like an excellent point to accumulate the stockeven better than when we last looked at it.”
In September, when Imagin’s stock was trading at CA$0.06, Maund wrote, “Imagin Medical stock is great value here with the potential to make big percentage gains from the current very low price.”
To Chris Temple, editor and publisher of the National Investor, who gave the company a strong “Buy” in 2018, the global market is enormous: “I’m sure you won’t be surprised to learn that, globally, nearly $50 billion a year is spent on endoscopic procedures. This is not always to treat maladies or to eradicate cancerous tissue, but sometimes to just confirm that further medical attention is not needed.” He adds, “If successful hereImagin may well be poised to disrupt the market.”
Doctors have jumped on the bandwagon. In an oversubscribed financing last year, investors included Dr. Stan Swierzewski, Chief of Surgery and Director of Urology at Holyoke Medical Center in Massachusetts, and Dr. Roger Buckley, Division Head of Urology at North York General Hospital in Toronto.
Upon making his investment in IME, Dr. Swierzewski publicly stated, “As a practicing urologist, I invested in Imagin because I have a duty and responsibility to advance any improvements in treatment and technology that will benefit my patients and save lives. Current technology is cumbersome and time consuming making it less effective as a screening or follow-up tool. Bladder cancer patients are basically monitored for life with in-office cystoscopies, which are not effective in differentiating between inflammation and cancer. To be safe, we perform surgery on many patients which often turns out to be negative. Imagin’s i/Blue technology, given its potential speed and sensitivity, will help us assess the patient’s condition more quickly and accurately and avoid unnecessary surgery. It will also make necessary surgery more successful, ultimately saving lives and reducing medical expenses. I’m confident that using the i/Blue system will become the standard of care. . .I cannot wait to use this technology in treating my bladder cancer patients.”
Imagin has already met key milestones as reported with its Q3 financials, which included a $659,836 spend on R&D. Pay attention the second bullet!
In April, 2019, Imagin reached a major product development milestone with completion of the i/Blue imaging system’s initial functional unit.
At the American Urological Association’s annual meeting, held in May in Chicago, Imagin held private focus groups, where leading urologists assessed the initial functional product and provided overwhelmingly positive feedback that was used to finalize the i/Blue product’s user needs.
In July, 2019, Imagin reported that it had moved to step five of the seven-step development process that the FDA defines in its design control guidance for medical device manufacturers: (1) user needs; (2) design input; (3) design process; (4) design output; (5) design verification; (6) device realization; and finally, (7) device validation.
Imagin has met with the FDA on two occasions to discuss the i/Blue Imaging System’s regulatory path and is using the content and feedback from these meetings to refine its strategy. Imagin will continue to meet with the FDA until it submits its official application for approval.
With this kind of momentum, Imagin is planning to initiate the commercialization of the i/Blue Imaging system during late 2020. Keep in mind the technology is also relevant for other cancer treatments, so there is more “‘blue sky”‘ upside in store. Once commercially available for urological indications, Imagin plans to expand its product platform to laparoscopic (abdominal) colorectal, thoracic and other medical procedures.
Trading on the Canadian Securities Exchange (CSE:IME) and listed on the OTCQB (IMEXF), IME has about 140 million shares out currently trading at around CA$0.05 for a market capitalization of about CA$7 million. Around 18 million warrants are out at CA$0.38 and with 10.8 million options (weighted average CA$0.29), while insiders hold about 6.31% of the company. Cash on hand is $3.4 million as of June 30. CEO Jim Hutchens says the company will require additional financing to see it through to FDA approvals and, once approved, the company anticipates fast ramp-up of revenues, marching toward positive EBITDA after 18 months post commercialization.
A quick glance at the three-year IME.C chart shows that technically this stock, now at CA$0.05 has hit a historical support level and is just waiting for a catalyst … refer back to bullet #2 above!
Keep in mind, Imagin’s i/Blue Imaging System is pairing up with two elements that are already FDA approved: the endoscope, which has been around forever, and fluorescing agents that have been approved since 2010. Imagin is not reinventing the wheel, it’s consolidating the instrumentation with advanced optics.
While full FDA approval for Imagin’s i/Blue system is advancing forward, it is important to understand bladder cancer surgery using blue-light endoscopes is a technique that is already FDA approved, as is the contrast agent used to fluoresce, to illuminate, the cancer. IME’s patented advanced optical designis tweaking the procedure, using its state-of-the art components to greatly improve the existing technology and significantly reduce the cost with its groundbreaking method.
So let’s talk about that method.
In typical white-light endoscopy, a small camera is mounted on an endoscope, which enters the body and projects images onto a monitor of the bladder and any tumors that protrude above the wall that the surgeon evaluates for possible removal.
However, the challenge of using white light is that a surgeon cannot easily differentiate flat or tiny malignant and premalignant tumors from normal tissue or see the borders/margins of the tumor. Consequently, some cancer cells may remain behind undetected, contributing to the more than 50% recurrence rate in bladder cancer.
The remedy has been to use a “blue” light in conjunction with fluorescing imaging agents. The agents are absorbed by the cancerous cells in the bladder. When exposed to blue light, they fluoresce, improving the surgeons’ ability to detect flat cancers and visualize the margin for removal.
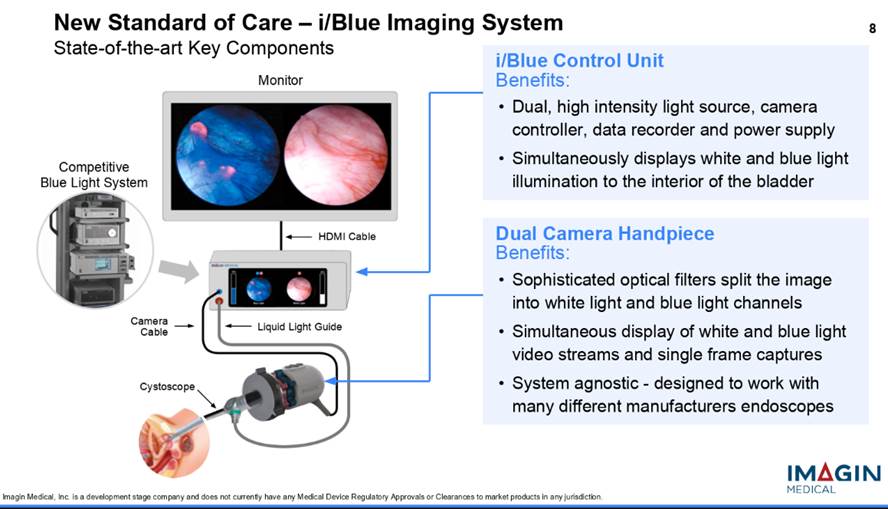
Surgeons still need to see both white- and blue-light images during surgery because the white light image shows the full landscape of the bladder but doesn’t highlight the cancer, and the blue light shows the cancer but doesn’t show exactly where it is, so the surgeon loses orientation. In addition, the current blue-light technology gives the surgeons only one image at a time on the monitor, so surgeons have to switch back and forth between the two and compare them from memory to remove the cancer. Imagin’s i/Blue Imaging System addresses this problem because it shows both images on the monitor at the same time, side-by-side, and in real time. So now, the surgeon won’t have to switch back and forth and rely on memory to locate and remove the cancer. The procedure has the potential to dramatically reduce bladder cancer recurrence rates.
Today, there is only one company that offers blue-light cystoscopy, and its system can only be used with its proprietary endoscopes. For this reason, as well the system’s expensive price tag, blue-light cystoscopy, although the recommended treatment for Non-Muscle Invasive Bladder Cancer (NMIBC) by the American Urological Association (AUA), has not become the norm, or even available in all major cities in the U.S.
The i/Blue System, however, can be used with almost any endoscope on the market, making it more accessible, while dramatically increasing the size of the market and is less expensive, reducing cost to the healthcare system.
Another groundbreaking aspect of Imagin’s technology is the consolidation of instrumentation. The current blue-light method, which needs a system tower that houses multiple units, including the light source, camera control unit and the video data recorder, is purchased as a “bundle” and, depending on accessories, can cost well over $100,000. The i/Blue system, on the other hand, using state-of-the-art technology, combines the three modules into one device, taking up a much smaller footprint, and offering a much lower price tag.
Imagin currently has three issued patents with additional patents pending.
Imagin his helmed by an experienced management team, with direct medical device experience moving products from concept through development to commercialization, including managing the FDA process. One of its medical advisors, Dr. Ashish Kamat, Endowed Professor of Urologic Oncology and Cancer Research at University of Texas MD Anderson Cancer Center, has been named by Expertscape as the world’s top-rated expert in urinary bladder neoplasms.
Like all medical device companies, Imagin’s fate rides on FDA approvals, but given team’s deep experience in this market, a proven concept utilizing instruments and agents already approved by the FDA and a glowing endorsement by leading members of the AUA, this is an advancement that likely couldand for the sake of bladder cancer patients, really shouldmove forward.
Knox Henderson is a journalist and capital markets communications consultant. He has advised for a broad range of small cap companies in the resource, life sciences and technology sectors for more than 25 years.
Disclosure: 1) Knox Henderson: I, or members of my immediate household or family, do not own shares of the following companies mentioned in this article: None. I personally am, or members of my immediate household or family are, paid by the following companies mentioned in this article: Imagin Medical. My company has a financial relationship with the following companies mentioned in this article: None. I determined which companies would be included in this article based on my research and understanding of the sector. 2) The following companies mentioned in this article are billboard sponsors of Streetwise Reports: Imagin Medical. Click here for important disclosures about sponsor fees. As of the date of this article, an affiliate of Streetwise Reports has a consulting relationship with Imagin Medical. Please click here for more information. An affiliate of Streetwise Reports is conducting a digital media marketing campaign for this article on behalf of Imagin Medical. Please click here for more information. The information provided above is for informational purposes only and is not a recommendation to buy or sell any security. 3) Statements and opinions expressed are the opinions of the author and not of Streetwise Reports or its officers. The author is wholly responsible for the validity of the statements. The author was not paid by Streetwise Reports for this article. Streetwise Reports was not paid by the author to publish or syndicate this article. Streetwise Reports requires contributing authors to disclose any shareholdings in, or economic relationships with, companies that they write about. Streetwise Reports relies upon the authors to accurately provide this information and Streetwise Reports has no means of verifying its accuracy. 4) This article does not constitute investment advice. Each reader is encouraged to consult with his or her individual financial professional and any action a reader takes as a result of information presented here is his or her own responsibility. By opening this page, each reader accepts and agrees to Streetwise Reports’ terms of use and full legal disclaimer. This article is not a solicitation for investment. Streetwise Reports does not render general or specific investment advice and the information on Streetwise Reports should not be considered a recommendation to buy or sell any security. Streetwise Reports does not endorse or recommend the business, products, services or securities of any company mentioned on Streetwise Reports. 5) From time to time, Streetwise Reports and its directors, officers, employees or members of their families, as well as persons interviewed for articles and interviews on the site, may have a long or short position in securities mentioned. Directors, officers, employees or members of their immediate families are prohibited from making purchases and/or sales of those securities in the open market or otherwise from the time of the interview or the decision to write an article until three business days after the publication of the interview or article. The foregoing prohibition does not apply to articles that in substance only restate previously published company releases. As of the date of this article, officers and/or employees of Streetwise Reports LLC (including members of their household) own securities of Imagin Medical, a company mentioned in this article.
Additional Disclosures
Clive Maund does not own shares of Imagin Medical and neither he nor his company has been paid by Imagin Medical.
National Investor: The Editor may have positions in some securities discussed. Subscribers are encouraged to investigate any situation or recommendation further before investing. The Editor receives no undisclosed kickbacks, fees, commissions, gratuities, honoraria or other emoluments from any companies, brokers or vendors discussed herein in exchange for his recommendation of them. None of the content of this newsletter is to be considered as an offer to sell or a solicitation of an offer to buy any security.
Bob Moriarty of 321gold profiles a company with historical gold mines in California.
A friend approached me a couple of years back about putting some money into a private placement for a young exploration company, Providence Gold Mines Inc. (PHD:TSX.V; PRRVF:OTCBB), that had an option on a number of old gold mines in the California mother lode country. I did and have waited patiently (well, not really patiently) for some time to do a piece about the company and what they have. But there was nothing that would move the price of the shares off TDC until recently. They have a great story but lacked a hook that would grab the attention of potential investors.
Basically the company picked up an option on half a dozen high grade gold mines that shut down in 1916 after production of over 225,000 ounces of gold. The terms call for $1 million CAD spent on exploration in the first two years, an additional $750,000 CAD in the third year to earn 50%. Providence can buy the remaining 50% for $5 million US and there is a 2.5% royalty that can be bought down to 1% for $1 million US.
The six mines were typical high-grade mother lode deposits. Production of 225,000 ounces in total would make them some of the biggest mines in California 100 years ago. Historical records suggest some areas of one of the mines were a high as 15 ounces to the ton.
Production continued until from discovery in the 1880s until 1916 when internal issues caused the mines to be closed and flooded. A forest fire in 1918 destroyed the above ground structures and most of the data from the production. Since then the patented claims stayed in the same family until they were ready to joint venture with a junior.
Anyone looking at California gold production owes it to themselves to be skeptical. After all, California is home to most of the fruits and nuts produced in the U.S. But the lessor is a lawyer who worked as a California permitting expert most of his career. He knows what can and cannot be done.
When I first looked at the story, it was clear to me that with good management this was an easy 23 banger and with any tailwind from the price of gold, an easy 10-bagger. Where do you go when you have six high-grade gold mines in an area that needs tax revenue and the company has a $4 million market cap?
But you have to have something that sparks the interest and loosens the wallets of potential investors. I think the company has come up with a near perfect solution.
I was semi-retired from the computer business when Barbara and I started 321gold almost twenty years ago. I got invited on a few site visits where I learned a lot but I lacked the professional credentials held by most of the other letter writers. I was older than most and way too lazy to go back to school so I had to come up with some simple rules of thumb where I didn’t have to memorize bits of core to understand a deposit.
Rule 1. The further you go back in history, the higher the grade would have to have been to be economic. We can open pit, heap leach ore as low as 0.3 g/t at a profit in low cost environments such as Peru or Mexico. If you go back 100 years ago in the California mother lode, you would have needed half an ounce or higher to pay for underground gold mining. So any 100 year old mine that was in production and stopped would automatically be economic today.
Rule 2. Nobody ever gets over 90% recoveries unless they are very very good. Some of the minerals are always left in the tailings because at some point it isn’t worth spending the money to recover what is left.
If some mines produced 225,000 ounces of gold over a hundred years ago they most certainly would have left at least 10% and maybe as high as 20%. Actually and this is still true, nobody mines to be efficient, they mine to make money. If they can make money on a heap leach at a 65% recovery, they are thrilled and have just left 35% sitting in the pad.
The last couple of years have not been a favorable time for a junior to be raising money. Like their brethren, Providence has been dying on the vine due to a general lack of interest on the part of investors to put money into exploration. But Providence has come up with an interesting solution.
This material has rock about one inch in size and would need crushing before processing. I have suggested to management that they bite the bullet, rent a portable crusher and run some material through just to prove the gold is there. I have commented many times in the past that 43-101 hasn’t caused the production of a single ounce of gold. Counting gold is not mining. Mining is the art and science of extracting minerals from the ground at a profit. You can count until the cows come home and it won’t put a cent in your pockets.
Providence is at an interesting place. They have about 6 million warrants outstanding. Up until December 11th they can be exercised for $0.15 apiece. From this December until December 2020, the exercise price goes up to $0.20 and in the final year before expiration, the exercise price is $0.25. That creates a giant opportunity for astute investors.
Providence is absurdly cheap at $0.11. It has a current market cap of about $4 million CAD but underground potential for 14 million ounces of gold and 20,00030,000 ounces sitting on surface in the stockpile.
Providence is going to start processing the stockpile in a mini-sample. When those results backup what their testing has already shown, they will scale up. It will cost little more than chump change to start testing and once potential investors see there is gold there I expect the shares to go higher. But those 6 million warrants will be a sort of cap until the 11th of December. Should the price go up to $0.15-$0.20 as I expect, warrant holders may well sell shares to exercise warrants. That will bring in about $900,000 to Providence and fund a serious stockpile production program. That in turn will finance the drill campaign for 2020 without further dilution.
It’s a good plan, cheap and doable. I own a lot of shares in Providence bought in the open market and in two prior placements. I see this company as a potential giant home run. The stock will be cheap until the 11th of December and I don’t see it being cheap after that.
Providence Gold is an advertiser and I am biased. Do your own due diligence.
Bob Moriarty founded 321gold.com, with his late wife, Barbara Moriarty, more than 16 years ago. They later added 321energy.com to cover oil, natural gas, gasoline, coal, solar, wind and nuclear energy. Both sites feature articles, editorial opinions, pricing figures and updates on current events affecting both sectors. Previously, Moriarty was a Marine F-4B and O-1 pilot with more than 832 missions in Vietnam. He holds 14 international aviation records.
Disclosure: 1) Bob Moriarty: I, or members of my immediate household or family, own shares of the following companies mentioned in this article: Providence Gold. Providence Gold is an advertiser on 321 Gold. I determined which companies would be included in this article based on my research and understanding of the sector. 2) The following companies mentioned are billboard sponsors of Streetwise Reports: None. Click here for important disclosures about sponsor fees. 3) Statements and opinions expressed are the opinions of the author and not of Streetwise Reports or its officers. The author is wholly responsible for the validity of the statements. The author was not paid by Streetwise Reports for this article. Streetwise Reports was not paid by the author to publish or syndicate this article. The information provided above is for informational purposes only and is not a recommendation to buy or sell any security. Streetwise Reports requires contributing authors to disclose any shareholdings in, or economic relationships with, companies that they write about. Streetwise Reports relies upon the authors to accurately provide this information and Streetwise Reports has no means of verifying its accuracy. 4) The article does not constitute investment advice. Each reader is encouraged to consult with his or her individual financial professional and any action a reader takes as a result of information presented here is his or her own responsibility. By opening this page, each reader accepts and agrees to Streetwise Reports’ terms of use and full legal disclaimer. This article is not a solicitation for investment. Streetwise Reports does not render general or specific investment advice and the information on Streetwise Reports should not be considered a recommendation to buy or sell any security. Streetwise Reports does not endorse or recommend the business, products, services or securities of any company mentioned on Streetwise Reports. 5) From time to time, Streetwise Reports LLC and its directors, officers, employees or members of their families, as well as persons interviewed for articles and interviews on the site, may have a long or short position in securities mentioned. Directors, officers, employees or members of their immediate families are prohibited from making purchases and/or sales of those securities in the open market or otherwise from the time of the interview or the decision to write an article until three business days after the publication of the interview or article. The foregoing prohibition does not apply to articles that in substance only restate previously published company releases.
With gold and silver prices having tumbled, sector expert Michael Ballanger outlines how he will weather the storm.
“People everywhere are being fed propaganda, lies and false stimuli of all kinds, but deep in their hearts, deep in their instincts, they know something is wrong.”G. Edward Griffin, author of The Creature from Jekyll Island
My usual weekend missive was mildly delayed for a very good reason; I spent most of Friday evening and Saturday morning formulating this wonderfully verbose theory on why the Fed’s sudden shift from “quantitative tightening” to “massive stimulus” had such a negative effect on yields, with an associated and very sharp spillover into my beloved precious metals.
Having read it over several dozen times, I then began mulling over the various charts that I post from time to time and quickly decided to “bin it,” because my readers no longer wish to hear about the COT report or the “cartel” or the “egregious open interest” or “fraudulent bullion banks.” I can’t state this forcefully enough: We have all seen this before way too many times.
It gave me great delight to hammer the delete button while firing a shot glass at the quote screen. Gold, silver and the related junior and silver miners are now in full retreat and in danger of moving from “most-favoured” status to “get-me-the-hell-out” status (and I am being generous, because it looks like we may have already entered capitulation mode). So I scrapped the earlier content, because it serves zero purpose to explain to everyone why now, with gold and silver at 6.8% and 15.1% (respectively) below their 2019 highs, we should expect the armies of Millennial stock junkies to abandon WeWork and Tesla and Uber to seek safe harbor in the wonderment of precious metals. Nine hours of work summarily punted into the digital waste basket. H-r-r-umph!
Every time I visit our favorite gold websites, I see yet another youngster breathlessly ranting about the unfairness of the U.S. futures rules, and how there should be an investigation. I am forced to remind them that there is only one entity that deserves the title of “Precious Metals Whistleblower” and that is GATA (Gold Anti-trust Action Committee), which years ago (1999) first shed light on the shenanigans of the Fed, the SEC, the CFTC and the NEC in connection with the rigging of the gold and silver markets.
All I have ever tried to do is dodge these malevolent takedowns on the assumption that eventually, at some blessed point in the not-too-distant-future, justice and freedom would descend upon us and allow for true price discovery to unfold. That strategy began in April 2013, after the most blatant, banker-derived assassination of gold and silver occurred. Despite massive currency debasement sanctioned by Congress, designed “to save the financial system,” this turned out to be nothing other than a classic crony-capitalist con job intended to rescue the obliterated net worth of “selected” bankers (i.e. everyone except Bear Stearns and Lehman). To be fair, GATA was the entity that prompted me to think like a gold bug but trade like a thieving bullion bank, and by and large, it is what has saved me. So kudos to Bill Murphy and Chris Powell for the lifeline.
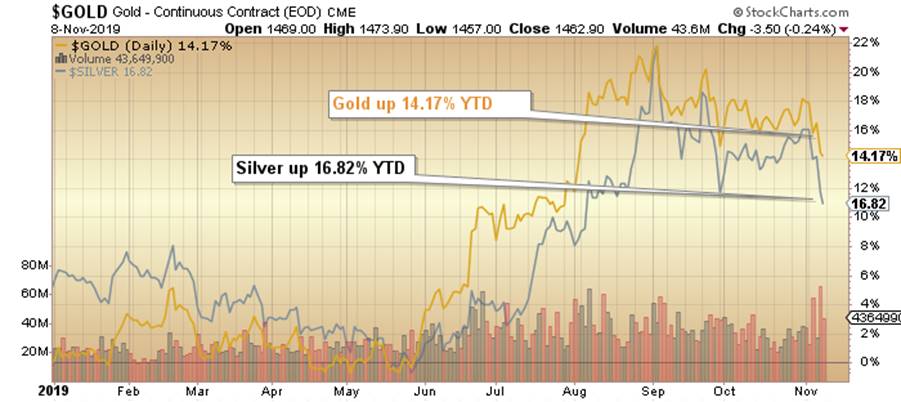
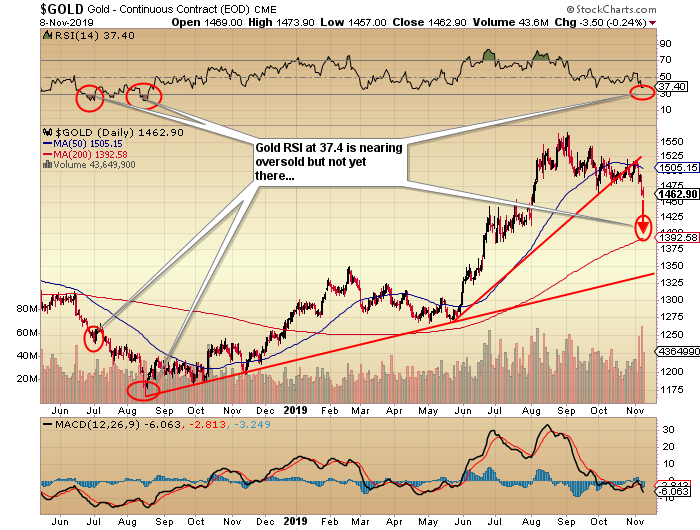
Today, instead of penning a long, drawn-out tome assigning blame, I am simply going to tell you where I am and how I intend to trade the metals and miners going into year-end. To review, I sold all unleveraged gold and silver equities in the days leading up to and including the top, registered on Sept. 4, and waited until they had backed off to replace what had been sold. I am now 100% long the physical metals (still up 14.17% [Au]; 16.82% [AG] year-to-date), and the unleveraged miner ETFs (GDX & GDXJ; now around breakeven) plus a small position in JNUG (11.8%). I also hold a large basket of micro-cap exploration companies plus approximately 15% cash. My goal going into year-end is to maintain the positive return I still have in the GGMA portfolio by avoiding any career-ending drawdowns going into end-of-quarter rebalancing. The key for me is execution, and the solution lies in the charts.
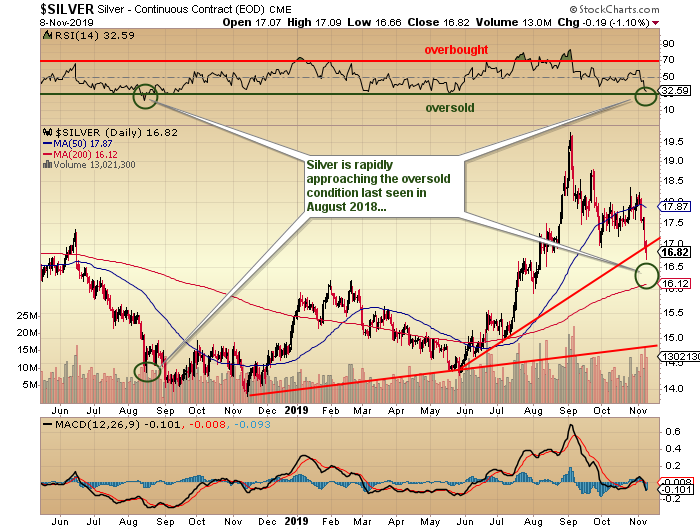
The two charts shown below are looking ugly, in that the uptrend lines drawn off the summer lows are now violated. If it were not for the RSI [relative strength index] readings, I might venture a guess that 200-dma [daily moving average] levels could be in sight. After a $106 drop in gold, $1,392.58 is only $65 away. Silver, being the more volatile of the two, needs to drop $0.70/ounce to touch its 200-dma at $16.12, and while it might happen for gold, I can’t see it happening for silver.
Now, do you step aside on a bounce next week and look for a better entry level? Broke trendlines say “yes” but RSI says “no,” especially for silver. Problem remains that since the CTAs (managed money) are overweight (Crimex open interest is at record highs). If they are forced to pare back positions, at what level will the Commercials begin covering their 300,000+ contract position?
I think this is going to play out more like Q4/2015, where the bullion banks stood in at $1,045 and bought literally everything thrown their way, going from net short to virtually net long by December of that year. We could get a downside blow-off but I see it being short, sharp and sweet. Accordingly, I am going to await one of two events before adding to holdings: 1) RSI readings sub-30 and preferably around 25, and 2) evidence of short covering by the bankers (rapidly declining open interest with a big swing in the COT). To put it bluntly, it is too late to sell and a tad too early to load the truck.
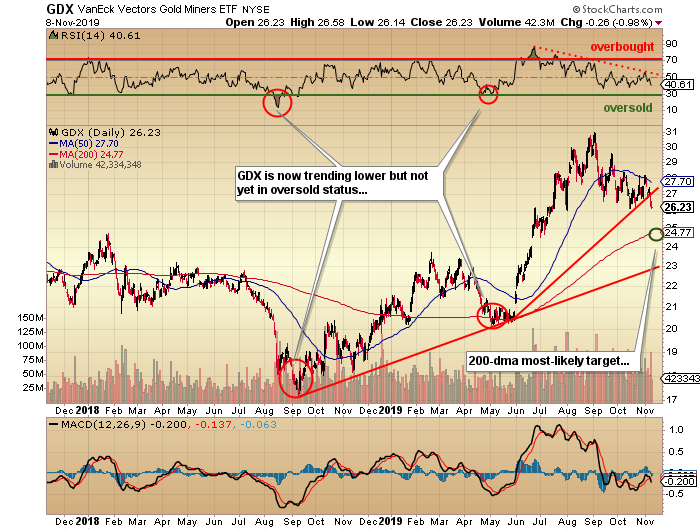
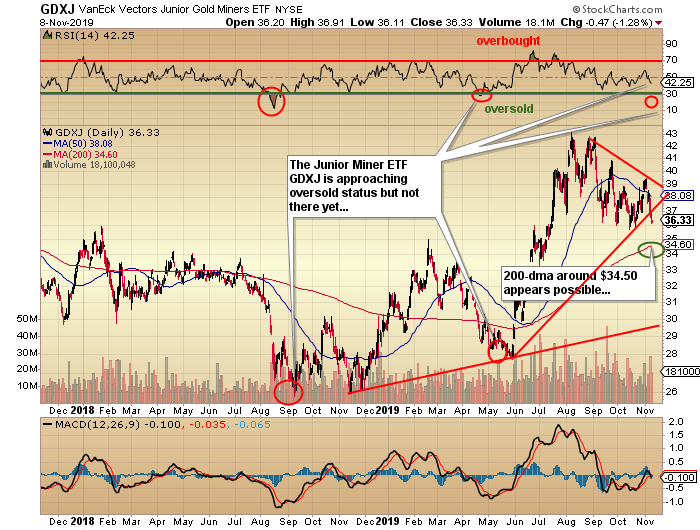
Last week was a brutal one for the miners, as it blew away my thoughts concerning end-of-October low and subsequent recovery. The setups for the unleveraged ETFs (GDX/GDXJ) are now tough ones, as they have not yet crossed into oversold territory. But make no mistake, they are now in downtrends with a series of lower highs and lower lows. As in the case of the Large Speculators (managed money), the generalist funds that are overweight, the miners cannot remain long as Q4 progresses, or else face certain extinction into year-end as their performance rankings begin to threaten bonuses. I await lower RSI readings for both GDX and GDXJ, and again urge you all to keep an eye on the COT for the beginning of massive short covering by the bullion banks.
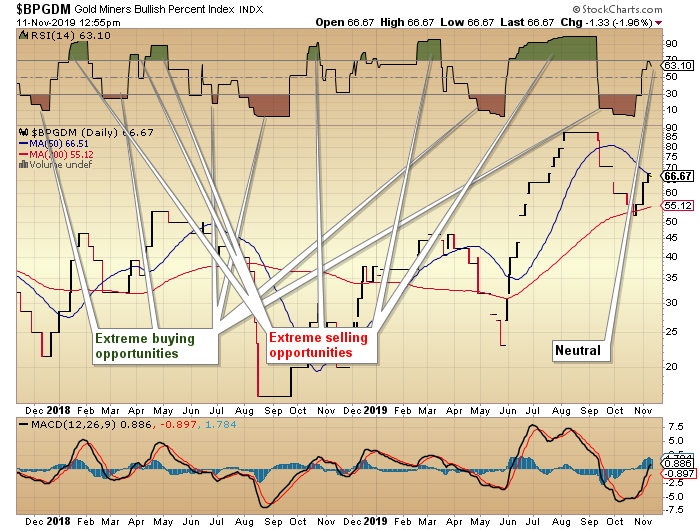
Sentiment is now at polar extremes when comparing stocks today versus stocks in August. That is best seen in the Citibank Greed Fear Index, which is now at its highest level that I can recall, at around 90. As of this morning, the gold miners Bullish Percent Index is solidly stuck in “neutral,” as the miners are yet to move into the extremes seen in August 2018 and AprilMay 2019. While the excesses of the summer of 2019 have now been worked off, the seasonality that I expected to arrive in early November was replaced with a “risk-on” breakout move in stocks and the U.S. dollar, based upon yet another “trade breakthrough.”
Now, there is no use dissecting the veracity of this supposed “breakthrough;” the algobots that set prices for stocks, Forex, and precious metals were determined to use the headline event as an excuse to ramp up stocks and deflate gold, silver and the miners, which means that human traders were forced to follow. Therein lies the risk, near term, in the metals. While algobots have zero worry about losing their jobs, carbon-based traders are sailing into year-end with too much cash, too few risky, alpha-laden stocks, and way too many hedges, with the precious metals being a primary safe haven (or so they thought).
Over the weekend, I read somewhere between twenty and thirty gold commentaries from all the usual players, and there wasn’t one article or opinion anywhere close to the table-thumping and chest-puffing seen and heard at the Sept. 4 top. All of the reposts of earlier bullish articles are now irrelevant, because as far as I know, not one of them actually called a top in September. How am I to take their now-bearish forecasts seriously enough to change my views? What is important is that they are all neutral to bearish, near term, but bullish to super-bullish, longer term. Translation: They bought too high, and had they sold any/more in September instead of doing victory laps on Twitter, their followers would be a lot happier. So now they have to hold on and pray for a rally to get everyone back onside. The significance of my weekend reading is that the precious metals newsletters/bloggers/podcasters, as a collective, are now a really good contrarian indicator. Last AprilMay, they were black-bearish and now they are just bearish. That is good news.
As for me, I sold my GDXJ at $43 and bought it back at $37, so at $36.50, Im offside a fraction and a lot closer to the bottom than the top. I like being in that position, but at the same time, I have to be mindful of the irrationality of markets and make you all aware that it is at the end of a move (as opposed to the start or the middle) that things can go a little haywire. I learned in the late 1980s, in trading the then-parabolic Nikkei index, how 90% of price moves occur in the final 10% of term. That works in a similar fashion for corrections, so the current correction in gold, silver and the miners might (as opposed to “will”) see a fast, sharp downdraft as the result of some bogus news headline to mark the final lows for the moveand the most reliable indicator for me is still RSI.
So, in closing, I have chosen to save the economic philosophizing, and offer my best guess on where we are and what to do in a market and world so completely bereft of order and sanity and so laden with debt and despair that it is a wonder capital markets can still function. If you were a pro trader living and working in 1977, with gold at $500 per ounce, and were told that total U.S. debt would exceed $23 trillion, with the Federal Reserve balance sheet at $1.5 trillion, you would laugh at the person delivering the news from the future. Then you would sell everything and load up on gold and silver, expecting $50,000 per ounce for gold in 2019. You see, U.S. federal debt has increase thirty-two-fold since 1977 (when it stood at around $700 billion) so if you apply that kind of increase to $500/ounce gold, you get $16,000 per ounce.
Of course, that was before the invention of the Working Group on Capital Markets and coordinated central bank interference, but that is a sub-topic for another day (or week, or month. . .)
Sharpen your pencils and get ready to add to holdings. We might be there now but let’s let discretion be the better part of valor and sit tight.
Originally trained during the inflationary 1970s, Michael Ballanger is a graduate of Saint Louis University where he earned a Bachelor of Science in finance and a Bachelor of Art in marketing before completing post-graduate work at the Wharton School of Finance. With more than 30 years of experience as a junior mining and exploration specialist, as well as a solid background in corporate finance, Ballanger’s adherence to the concept of “Hard Assets” allows him to focus the practice on selecting opportunities in the global resource sector with emphasis on the precious metals exploration and development sector. Ballanger takes great pleasure in visiting mineral properties around the globe in the never-ending hunt for early-stage opportunities.
Disclosure: 1) Statements and opinions expressed are the opinions of Michael Ballanger and not of Streetwise Reports or its officers. Michael Ballanger is wholly responsible for the validity of the statements. Streetwise Reports was not involved in any aspect of the article preparation. Michael Ballanger was not paid by Streetwise Reports LLC for this article. Streetwise Reports was not paid by the author to publish or syndicate this article. 2) This article does not constitute investment advice. Each reader is encouraged to consult with his or her individual financial professional and any action a reader takes as a result of information presented here is his or her own responsibility. By opening this page, each reader accepts and agrees to Streetwise Reports’ terms of use and full legal disclaimer. This article is not a solicitation for investment. Streetwise Reports does not render general or specific investment advice and the information on Streetwise Reports should not be considered a recommendation to buy or sell any security. Streetwise Reports does not endorse or recommend the business, products, services or securities of any company mentioned on Streetwise Reports. 3) From time to time, Streetwise Reports LLC and its directors, officers, employees or members of their families, as well as persons interviewed for articles and interviews on the site, may have a long or short position in securities mentioned. Directors, officers, employees or members of their immediate families are prohibited from making purchases and/or sales of those securities in the open market or otherwise from the time of the interview or the decision to write an article until three business days after the publication of the interview or article. The foregoing prohibition does not apply to articles that in substance only restate previously published company releases.
Charts provided by the author.
Michael Ballanger Disclaimer: This letter makes no guarantee or warranty on the accuracy or completeness of the data provided. Nothing contained herein is intended or shall be deemed to be investment advice, implied or otherwise. This letter represents my views and replicates trades that I am making but nothing more than that. Always consult your registered advisor to assist you with your investments. I accept no liability for any loss arising from the use of the data contained on this letter. Options and junior mining stocks contain a high level of risk that may result in the loss of part or all invested capital and therefore are suitable for experienced and professional investors and traders only. One should be familiar with the risks involved in junior mining and options trading and we recommend consulting a financial adviser if you feel you do not understand the risks involved.
Shares of melanoma and other skin cancers diagnostic firm Castle Biosciences Inc. traded more than 15% higher today after the firm announced Q3/19 financial and operational results.
Skin cancer diagnostics company Castle Biosciences Inc. (CSTL:NASDAQ), which provides personalized genomic information in order to improve cancer treatment decisions, yesterday announced its financial results for the third quarter and nine months ended September 30, 2019.
For Q3/19 the company reported that revenues increased 300% to $14.8 million, up from $3.7 million in Q3/18. The firm noted that during the same corresponding period gross margin increased to $13.1 million or 88% of revenues, up from $2.4 million or 64% of revenues in Q3/18. The company additionally advised that operating cash flows were $0.8 million in Q3/19 2019, compared to $(1.9 million) in Q3/18. Net income improved to $5.543 million or $0.05 EPS per diluted share in Q3/19, compared to a loss of $4.456 million or $(2.33) per diluted share in Q3/18.
Castle reported its quarterly testing volume results and advised that it delivered 4,126 DecisionDx-Melanoma test reports in Q3/19, compared to 3,136 reports during Q3/18, representing growth of 32%. For the same period, it also delivered 356 DecisionDx-UM test reports, compared to 324 reports during the prior year’s quarter, representing growth of 10%.
Derek Maetzold, president and CEO of Castle Biosciences, commented, “We are pleased with our strong Q3/19 performance, driven by solid growth in our DecisionDx-Melanoma test report volume, which is a result of our investment in evidence development and scaling our commercial team in Q1/19…Based upon our results, we have decided to execute our commercial expansion plans in December 2019…We recently presented the clinical validation study data for our DecisionDx-SCC test for use in patients diagnosed with high risk cutaneous squamous cell carcinoma, which we expect to launch in the second half of 2020…Additionally, we continue to progress our third skin cancer product for use in patients with a suspicious pigmented lesion, which is also on track for anticipated commercial availability in H2/20. We believe these two late stage pipeline products will increase our estimated total addressable U.S. market by more than $1.4 billion, for an estimated total addressable U.S. market of $2.0 billion for current and pipeline products.”
The company noted in the release that it closed the initial public offering of 4,600,000 shares of its common stock generating gross proceeds of $73.6 million before underwriting expenses and commissions and that and the company was added as a member of the U.S. small-cap Russell 2000 Index.
Castle Biosciences is headquartered in Friendswood, Tex., and states that it is “a commercial-stage dermatologic cancer company focused on providing physicians and their patients with personalized, clinically actionable genomic information to make more accurate treatment decisions.” The company believes that the traditional approach to developing a treatment plan for dermatologic cancers using clinical and pathology factors alone is inadequate, and can be improved by incorporating personalized genomic information. The firm indicates that “it currently offers tests for patients with cutaneous melanoma (DecisionDx-Melanoma, DecisionDx-CMSeq) and uveal melanoma (DecisionDx-UM, DecisionDx-PRAME and DecisionDx-UMSeq), with products in development for other underserved cancers, the two most advanced of which are focused on patients with cutaneous squamous cell carcinoma, and patients who have a difficult-to-diagnose pigmented lesion.”
Castle Biosciences has a market cap of about $372.3 million with around 17.07 million outstanding shares. On the news, CSTL shares opened 10% higher today at $24.00 (+$2.89, +10.04%) compared to yesterday’s closing price of $21.81. The stock has traded today between $23.25 to $25.35 per share and presently is trading at $24.90 (+3.10, +14.19%).
Disclosure: 1) Stephen Hytha compiled this article for Streetwise Reports LLC and provides services to Streetwise Reports as an independent contractor. He or members of his household own securities of the following companies mentioned in the article: None. He or members of his household are paid by the following companies mentioned in this article: None. 2) The following companies mentioned in this article are billboard sponsors of Streetwise Reports: None. Click here for important disclosures about sponsor fees. 3) Comments and opinions expressed are those of the specific experts and not of Streetwise Reports or its officers. The information provided above is for informational purposes only and is not a recommendation to buy or sell any security. 4) The article does not constitute investment advice. Each reader is encouraged to consult with his or her individual financial professional and any action a reader takes as a result of information presented here is his or her own responsibility. By opening this page, each reader accepts and agrees to Streetwise Reports’ terms of use and full legal disclaimer. This article is not a solicitation for investment. Streetwise Reports does not render general or specific investment advice and the information on Streetwise Reports should not be considered a recommendation to buy or sell any security. Streetwise Reports does not endorse or recommend the business, products, services or securities of any company mentioned on Streetwise Reports. 5) From time to time, Streetwise Reports LLC and its directors, officers, employees or members of their families, as well as persons interviewed for articles and interviews on the site, may have a long or short position in securities mentioned. Directors, officers, employees or members of their immediate families are prohibited from making purchases and/or sales of those securities in the open market or otherwise from the time of the interview or the decision to write an article until three business days after the publication of the interview or article. The foregoing prohibition does not apply to articles that in substance only restate previously published company releases. 6) This article does not constitute medical advice. Officers, employees and contributors to Streetwise Reports are not licensed medical professionals. Readers should always contact their healthcare professionals for medical advice.
Coming up in the early hours of tomorrow, we have some key data that routinely moves the Asian commodity currencies.
There is likely some pent-up fundamental energy in the market since we haven’t had much in the way of major data releases for the last several days. The RBA has turned its focus towards employment as guiding its rate policy. And we are still waiting for the next rate cut!
There have been some recent developments in the economic landscape that have affected sentiment in Australia. The general upbeat outlook has muted a bit since Monday after the White House disclosed a “phase 1” deal was farther off than what many analysts were hoping for.
However, there is an increasing market optimism thanks to the Fed. On the one hand, an expanding balance sheet, and on the other, the latest rate cut being signaled as the last “insurance” installment.
What We Are Looking For
The number that usually gets the market’s attention is the Employment Change figure. Projections currently indicate that 21.5K jobs were created in Australia during October. This would be an improvement over the 14.7K registered in the prior month.
There is something of an informal “normal” range for net job adds. This is between 10K and 40K. Generally, we could expect a significantly stronger reaction in the market if we get a result beyond those parameters. The current expectations are for a pretty neutral middle ground. So, there likely won’t be much market pricing in ahead of the release.
The Trends Are Important
At the same time we also have the print of the Unemployment Rate. Expectations are for this to tick up to 5.3% from 5.2% prior. Just a decimal of change could be important here because of what it signals. A decimal higher would be an indication that the rate is continuing its upward climb from bottoming out earlier this year.
However, staying at 5.2% (or, better yet, falling) would be an indication that the rate has found a ceiling. And this could contribute to the RBA holding off on further rates.
Let’s not forget that 5.0% is around where most economists agree the structural unemployment level is. Despite the rise in unemployment, the trend in wage growth has remained consistently positive. And while Australia doesn’t have as much seasonality, it’s still important to remember that October is spring and usually has more demand for labor.
Another key point is that the RBA has something of an informal target of unemployment at or below 4.5%
The Other Signs
Earlier in the week, NAB Business Confidence bumped up a bit. This is a sign that employers might at least hold off on job cuts. Housing prices also appear to have turned around, finally, thanks to the influx of cheaper loans.
However, personal credit remains low, with many Australians continuing to invest their rising salaries in paying off debts.
Despite the green shoots, the RBA remains dovish. An interesting sign during the last meeting was the inclusion of a new phrase raising the possibility of “other policy options”. As if to hammer the point home, Governor Lowe is scheduled to give a speech on Quantitative Easing later this month.
Most analysts concur that the bank still has at least one if not two more rate cuts within its traditional policy toolkit. Therefore, unconventional measures are still far off. But, the bank might be laying the groundwork for communicating new policy in the future. That would continue to be a bearish sign for the AUD in the future.
News does drive certain market events and we understand how certain traders rely on news or interest rates to bias their positions and trades. As technical analysis purists, so to say, we believe the price operates within pure constructs of price rotation theory, trend theory, technical indicator theory, and price cycles. We’ve found that technical analysis distills many news items into pure technical trading signals that we can use to profit from market swings.
Price is the ultimate indicator in our view. Price determines current trends, support/resistance levels/channels, past price peaks and troughs and much more. When we apply our proprietary price modeling and price cycle tools, we can gain a very clear picture of what price may attempt to do in the near future and even as far as a few months into the future. Price, as the ultimate indicator, truly is the mathematical core element of all future price activity, trends, and reversions. Before you continue reading make sure to opt-in to our free market trend signals newsletter.
We have been using cycles since 2011 and have developed multiple proprietary price modeling tools over the past 5+ years that assist us in finding and timing great trades. Most of what we have learned over the past 8+ years is refined into “experience and skill”. When you follow the markets every day – every hour, for the past 8+ years and see various types of price and technical indicator setups and reactions, you learn to hone into certain setups that have proven to be highly accurate trading triggers.
Our research team had dedicated thousands of hours to develop the tremendous skills and experience to be able to produce accurate cycles, and to also interpret them, which is what we specialize in doing. Determining which cycles to trade may look simple, yet they are far from easy to trade without the setups and price rotation signals.
We use a blend of the top 4 active price cycles in the market which updates daily. This data allows us to know where future price is likely to move over the next few days and weeks. Within this article, we’ll show you some of our proprietary price cycles and modeling tools to show you how we run some of our specialized trading tools.
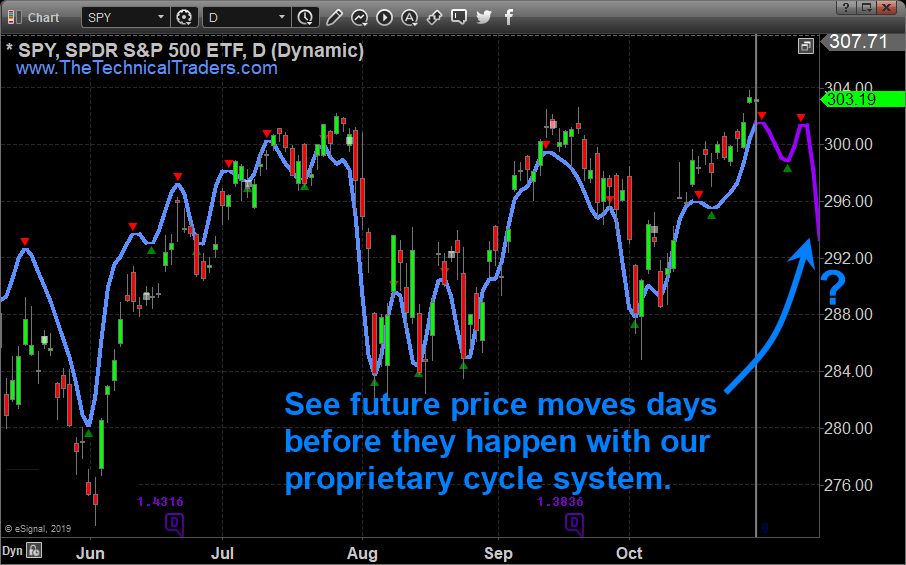
SP500 Daily Chart – Predicted Price Movement
This SPY chart highlights the short-term price cycle modeling system where you can see how price reacted in alignment with our proprietary cycle tool. If you look into the future, you can see that our proprietary price cycle tool is predicting the SPY may cycle into a potential double-top type of formation before cycling lower approximately 8+ days into the future. One thing to remember is these cycle levels do not predict price target levels. Don’t look at this chart and the cycle tool lines as price objectives – they are just trending bias levels scaled from 0 to 100 – just like a SINE WAVE. Ideally, in order to identify price targets, we must fall back to technical price theory and Fibonacci price theory in order to identify target price objectives for the top formation and the potential downside price trend in the future.
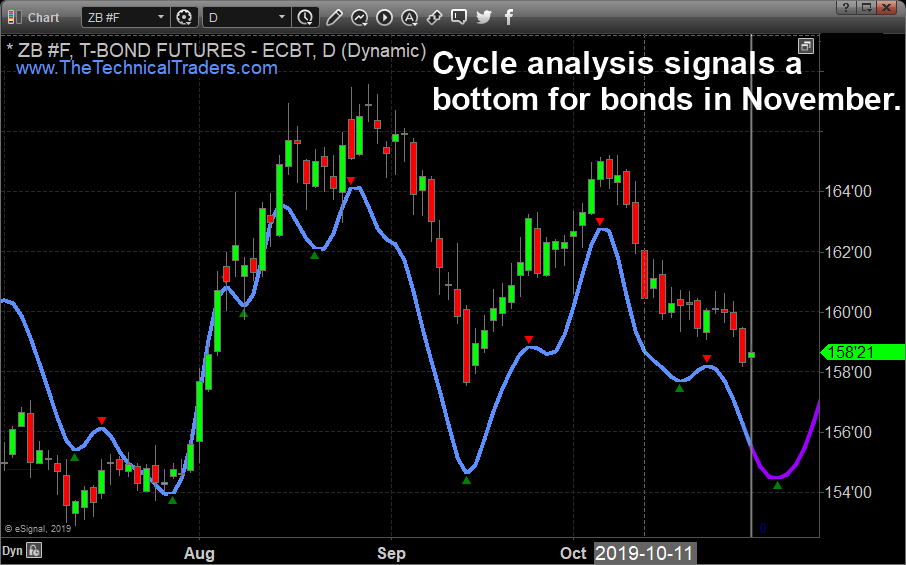
Bonds Daily Chart – Predicted Price Movement
This BOND Daily chart highlights a different type of price cycle – a momentum base/bottom type of setup. You can see from our proprietary cycle tool lines on the chart how price movement has aligned almost perfectly with the cycle forecast. Also, please notice how the price has moved beyond cycle highs and lows at times. This relates to the fact that we discussed above – that cycles do not predict price objectives. On this chart, a longer-term momentum base/bottom setup appears to be forming over the next 8+ days where the Bonds may begin a new upside price trend after the base/bottom forms. This would indicate that we should be looking for opportunities and price triggers that set up after the bottom has setup – not before. If we time our entry properly, we may negate any real risk for a trade with Bonds.
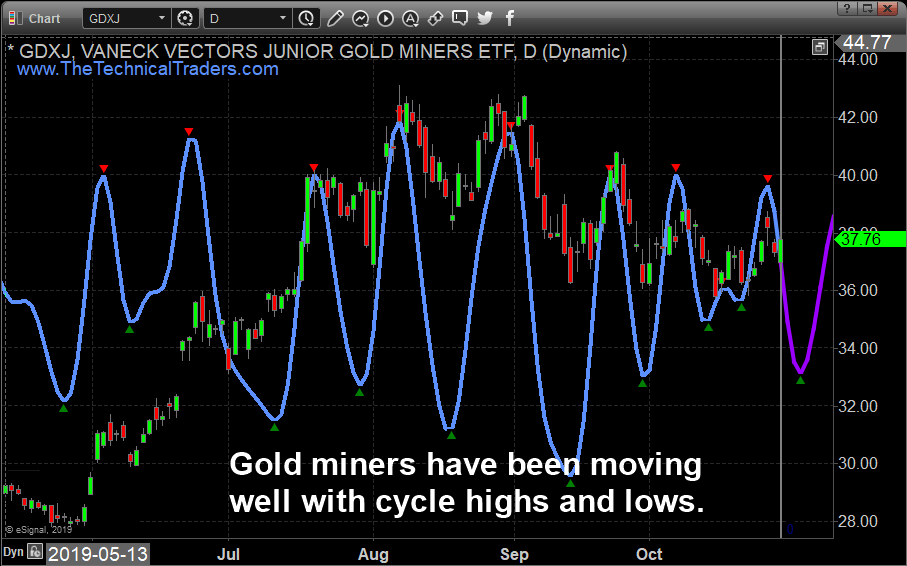
Gold Miners Daily Chart – Predicted Price Movement
This Daily GDXJ chart almost perfectly highlights how the cycles do not align with real price objectives. Throughout most of this chart, you can see the cycle levels rotate higher and lower near the extremes while price rotated in a much more narrow range. Still, pay attention to how our proprietary cycle tool nailed nearly every rotation in price. The range of the cycle lines is indicative of the scale and scope of the total cycle event. Bigger cycle ranges suggest deeper, more volatile price trending events.
Notice how the current cycle ranges are much more narrow than the previous cycle ranges? This suggests the current price cycle event may be more muted and smaller in volatility than previous price cycle ranges.
Our proprietary price cycle tool is suggesting that GDXJ will rotate lower to setup a moderate-term price bottom before attempting to move higher over the next 8 to 10+ days. The upside price cycle may be rather muted as well – possibly only targeting recent price peaks near $40~42.
Natural Gas Daily Chart – Predicted Price Movement
As you can see our past cycle analysis has been extremely accurate. In, fact natural gas can provide some of the largest and quickest gains out of all asset classes we cover. In August we traded natural gas for a quick 24% profit, and in October we have already locked in 15% again. Our remaining position in Natural Gas is up even more after this incredible upside move predicted by our cycle tool.
This chart presents a very good example of how our proprietary cycle tool can align with price perfectly at times. In this example, the expected cycle ranges, which highlight the intensity and potential volatility of the price trends, aligned almost perfectly with the real price action. Currently, the cycle tool is predicting a moderate price rotation in Natural Gas before a further upside price move hits.
I can tell you that huge moves are about to start unfolding not only in metals, or stocks but globally and some of these super-cycles are going to last years. A gentleman by the name of Brad Matheny goes into great detail with his simple to understand charts and guide about this. His financial market research is one of a kind and a real eye-opener. PDF guide: 2020 Cycles – The Greatest Opportunity Of Your Lifetime
Concluding Thoughts:
Opportunities are all around us. Using the right tools to identify the true technical cycles, price cycles, and trading setup can help to eliminate risks and hone into more profitable trades. It is almost impossible to time market tops and bottoms accurately, yet, as you can see from our work above, we have tools that can help us see into the future and help to predict when major price peaks and valleys may form. Using a tool like this to help you determine when the real opportunity exists and when to time your trades will only improve your market insights and trading results….
As a technical analysis and trader since 1997, I have been through a few bull/bear market cycles. I believe I have a good pulse on the market and timing key turning points for both short-term swing trading and long-term investment capital. The opportunities are massive/life-changing if handled properly.
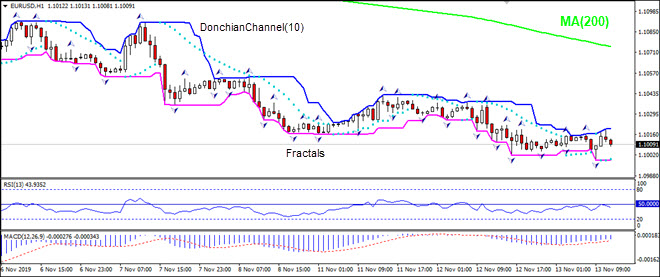
Better than forecast industrial production bullish for EURUSD
Industrial production in euro-zone rose by 0.1% in September compared with August, instead of a forecast of 0.2% decline. Will the EURUSD rise?
The price chart on 1-hour timeframe shows EURUSD: H1 is trading sideways. The price is rising toward the 200-period moving average MA(200) which is level. And the RSI oscillator is below 50 level and has not reached the oversold zone. There is no trend yet formed, traders have to decide when it would be a best time to enter the market.
US stocks resumed their growth on Tuesday. During the trading day the indices S&P 500 (+0,16%) и Nasdaq (+0,26%) (+0,26%) updated historic maximums, but their closure was not too high. The index Dow Jones Industrial Average did not change after the end of the trading day. The main positive was another statement by US President Donald Trump that the United States and China are close to signing the “first phase” of a trade deal. The leader in yesterday’s growth was the “healthcare” sector, and the leader in the terms of decline was the “real estate” sector. The reporting season for the 3rd quarter is near to the conclusion. So far, it is expected that the total profit of the S&P 500 500 will decrease by its results by 0.5% after rapid growth in the 1st and 2nd quarters. This is a preliminary estimate, as big companies such as Walmart, Nvidia and Cisco Systems yet need to report this week. Today the US Dollar Index ICE is growing for the second day in a row, awaiting the publication of US inflation data for October tonight.
The European stocks indices returned again to 4-year highs
The European stocks rose Tuesday due to the publication of a positive review of investor activity in Germany (ZEW Survey) and due to the good corporate reporting. The DAX 30 index rose on 0.6% up to a 22-months maximum. Currently the Stoxx Europe 600 index is lower only 2% below its historical maximum, achieved on April 2015. However, today the European stock indices are still trading in the minus, because the investors are worried about increased protests in Hong Kong and fear of the delays between USA and China trade negotiations. The leaders in the decline are the banking and automotive sectors. The rate of the EUR/USD is continuing to decline and reached the psychological level at 1.1.
Hang Seng falls for the 4th day in a row
Asian stock indices are mostly declining today after reports on the increased protests in Hong Kong. On Tuesday, the Nikkei grew nearly a percent on weaker yen up to 5-month minimum against the US dollar. The investors hope that the weak yen will support Japanese exporting companies. The stocks electronics manufacturers Sony and Advantest rose on 1.3% and 3.5%. Today, Nikkei dropped alongside with other European stock indices. From its local, 7-month minimum in August, it grew by 17% and some investors are expecting the correction.
Brent futures price is lower today. The investors are disappointed that US President did not announce the date of signing of the “first phase” of the US-China trade agreement. Besides, International Energy Agency published a long-term forecast, according to which, the global demand for oil will grow by 1 million barrels per day annually until 2025. This is less than the average expected growth in global GDP. Moreover, according to the agency, after 2025, the global demand for oil will slow down to 100 thousand barrels per day annually until 2040 due to increased fuel consumption.
Note: This overview has an informative and tutorial character and is published for free. All the data, included in the overview, are received from public sources, recognized as more or less reliable. Moreover, there is no guarantee that the indicated information is full and precise. Overviews are not updated. The whole information in each overview, including opinion, indicators, charts and anything else, is provided only for familiarization purposes and is not financial advice or а recommendation. The whole text and its any part, as well as the charts cannot be considered as an offer to make a deal with any asset. IFC Markets and its employees under any circumstances are not liable for any action taken by someone else during or after reading the overview.
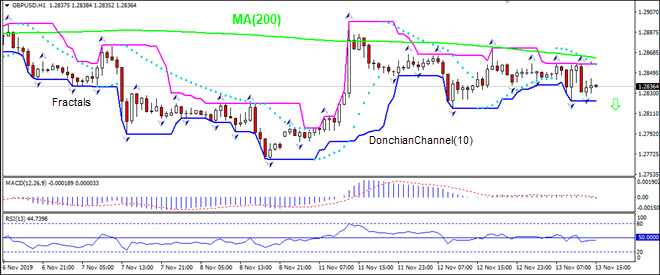
The UK consumer prices index growth declined to 1.5% over year in October 2019 from 1.7% in the previous month. Will the GBPUSD decline?
On 1-hour timeframe GBPUSD: H1 is in downtrend, below the 200-period moving average MA(200) which is falling. The RSI indicator is below 50 level but has not reached the oversold zone.