China’s Growth Outlook Beyond 2020

By Dan Steinbock

Despite US tariff wars, Chinese economic prospects remain in line with 2019 expectations and are likely to prevail in 2020, due to deleveraging and structural reforms.

A year ago, I projected that in 2019 Chinese GDP growth could achieve 6.2% in full-year growth, if policymakers can sustain higher-quality growth while suppressing debt accumulation. This scenario has proven pretty valid so far.

Recent international headlines have projected “sub-6% growth” in 2020 China, assuming weakened consumption, cautious private investment and shrinking exports. Such projections have been reported as a negative turn. In reality, Chinese growth deceleration is in line with long-term expectations. Even half a decade ago, the International Monetary Fund expected China’s annual growth to be 6.1-6.2 by 2020. The minor deviation can be attributed to US tariff wars.

In 2020, the final figure may more likely to hover around 5.8-6 percent, though.

Most economic projections focus on growth prospects in 2020. But let’s go beyond the short-term to see how the 2020 economic prospects are likely to support China’s more vital medium- and long-term objectives– deleveraging and structural reforms in 2020-2024 and rebalancing until 2030.

Decelerating growth, but rising incomes

If Chinese government would ignore its commitment to poverty eradication, higher living standards and sustainability, it could achieve more rapid growth, but at the cost of people’s livelihood, living standards and environment. Policymakers cannot accept too much deceleration either. The effort to double living standards – as measured by GDP per capita, with purchasing power parity – between 2010 and 2020 requires growth at about 6.1% in 2019-2020.

Assuming peaceful international conditions and managed trade wars, Chinese growth may decelerate from the 2007 peak of 14.3% to 5.5% by 2024.

In the 2000s, Chinese growth accelerated, while living standards almost doubled. In the 2010s, Chinese growth decelerated, but living standards doubled again. And if things go right, these standards could increase by another half in the mid-2020s.

In contrast, US living standards increased by only 6% in the 2000s and 14% in the 2010s, while growth has halved from 3-4% to 1-2%. In the largest EU-4 economies – as proxied by the average of the UK, Germany, France and Italy – growth declined even more from 3% to barely 1%, whereas living standards increased by 4% in the 2000s and 8% in the 2010s. In Japan, living standards barely grew in the 2000s, but rose by 10% in the 2010s (Figure).

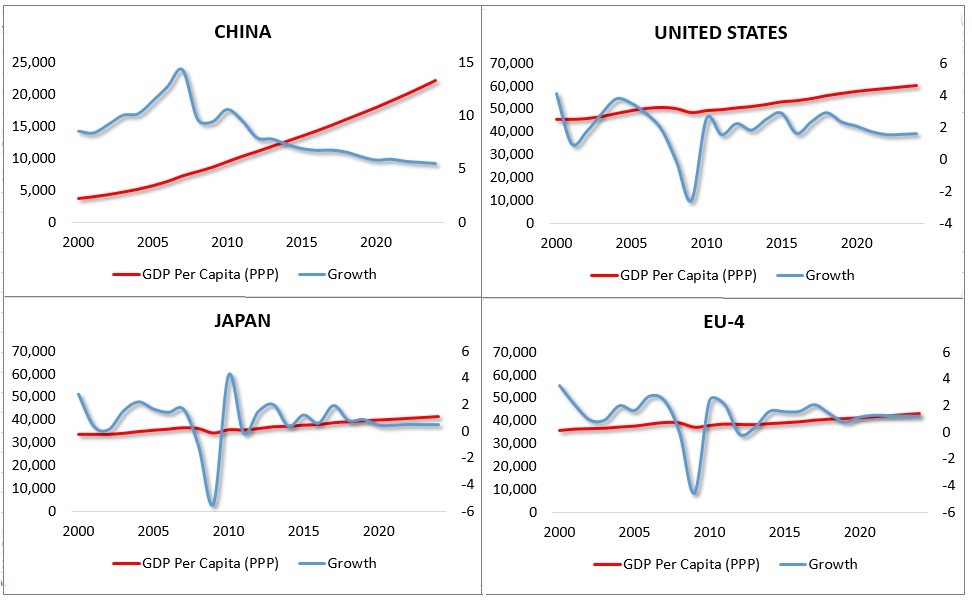
Figure Economic Growth and Per Capita Incomes, 2000-E2024*

EU-4: Averaged growth and per capita incomes in Germany, UK, France and Italy

Growth rate: GDP constant prices, percent change

Per capita income: GDP per capita, constant prices (PPP); 2011 international dollar

Source: IMF/WEO Database; Difference Group

Here’s the inconvenient truth: In China, the Communist Party continues to foster the expansion of middle group consumers. In contrast, US middle classes have stagnated since the 1970s, European middle classes are shrinking and their Japanese peers seek to avoid a fall into a poverty trap.

Deleveraging and structural reforms

In the Reagan era, US growth was sustained by soaring trade deficits and debt-taking. During the Trump rule, the White House has fostered growth with huge one-time tax cuts, tariff wars and drastic debt expansion. US public debt now exceeds $23 trillion (107% of the GDP). Except for Germany, the debt-to-GDP ratio is also high in the largest EU economies, such as the UK (99%), France (109%), and Italy (143%) – and far worse in Japan (264%).

These major economies in the advanced West have all benefited from ultra-low interest rates, while engaging in rounds of quantitative easing. Second, none of them are engaging in substantial structural reforms. Third, due to their unsustainable growth, maturing economies, aging populations and declining growth potential, they all are on a path to secular stagnation.

In China, the central government has used fiscal support and monetary easing to defuse the collateral damage associated with U.S. protectionism. So public debt has increased (64% of GDP). But unlike all major Western economies, China continues to deleverage. Indeed, financial deleveraging and reduced interconnectedness between banks and non-banks have contained the rise of financial risks, although vulnerabilities remain. And China is also engaging in broad structural reforms, even amid the US tariff wars. And unlike Western economies, China still has significant long-term growth potential.

Since the Chinese growth continues to shift away from investment and net exports toward consumption and innovation, the corrosive impact of protectionism will be reduced over time. In turn, rebalancing continues, as evidenced by record retail sales records during the October Golden Week, China International Import Expo (CIIE) and Alibaba’s Single’s Day.

Investors have made note. China may prove the world’s best-performing major stock market in 2019, with the benchmark CSI 300 index up by a third this year. By November, bourses in Shanghai and Shenzhen had added $1.4 trillion in market capitalization, raising the total onshore equities to $6.8 trillion this year. Meanwhile, almost half of fixed income institutional investors outside China plan to increase their exposure to China-issued debt in the coming year, according to FinanceAsia.

Three probable trade war scenarios

Despite periods of optimism, trade talk between Washington and Beijing remain inconclusive. While negotiations on the “Phase 1 trade deal” focus on agriculture, additional core disputes remain unsolved, including disagreements on intellectual property and technology, and financial market accessibility.

The US tariff wars are likely to hinge on three probable scenarios. In the Managed Trade War scenario, the two sides agree on Phase 1 deal and a realistic long-term negotiation trajectory on broader core disputes. The scenario would boost global economic prospects, by fostering investor and consumer confidence worldwide.

In the Technology War scenario, the two sides would agree on some sort of a Phase 1 deal, but not on a long-term negotiation trajectory. A brief trade truce would be only a prelude for a longer-term trade war in which the White House would evoke “national security reasons” to exploit anti-competitive instruments to undermine Chinese 5G success and Huawei’s expansion. This scenario would result in downgraded outlooks in all major economies

In the third Hybrid War scenario, a Phase 1 deal would be undermined, while long-term negotiation trajectory would not be achieved. Tariffs and protectionism would to foreign investment and the global value chains of multinational corporations. In this scenario, global consequences would prove the worst as the US would resort to economic, political, military and covert means to contain China’s economic rise and China would have to respond.

Guided by US trade policy mistakes – the worst in the postwar era- the global economy is now amid a “synchronized slowdown,” as the IMF has warned. But there is much worse ahead without the Managed Trade War scenario.

About the Author:

Dr. Dan Steinbock is an internationally recognized strategist of the multipolar world and the founder of Difference Group. He has served at India, China and America Institute (US), Shanghai Institutes for International Studies (China) and the EU Center (Singapore). For more, see https://www.differencegroup.net/   

The original commentary was released by China Daily on November 20, 2019.


NZDCAD Analysis: In New Zealand the economic data was positive

By IFCMarkets

In New Zealand the economic data was positive

The second milk auction in November was successfully held in New Zealand (Global Dairy Trade). Will the NZDCAD quotations grow?

Their increase indicates the strengthening of the New Zealand dollar against the Canadian dollar. Global Dairy Trade Price Index rose on 1,7%, after rising on 3.7% at the previous auction. Trading volume fell slightly by 1.8%. The dairy industry generates more than 7% of New Zealand’s GDP, therefore, its indicators affect the local currency rate. The Reserve Bank of New Zealand (RBNZ) decided to maintain the rate of 1% at its last meeting in 2019. Now the interest rate will stay unchanged until the next meeting on February 12, 2020. The negative factor for Canadian dollar is the decline in international oil prices due to production increase and a delay in US-Chinese trade talks. Carolyn Wilkins, Deputy Governor of the Bank of Canada spoke about the risks to the global economy. Investors fear that this may be a hint of willingness to decrease the rate. The inflation in Canada for October will come out in November 20, which may affect the dynamics of the Canadian dollar.

NZDCAD

On the daily timeframe, NZDCAD: D1 is correcting upwards from the lowest since August 2015. It has breached up the resistance line of the downtrend. Various technical analysis indicators have generated signals to increase. The further growth is possible in the case of positive data in New Zealand and negative data in Canada.

  • The Parabolic Indicator gives a bullish signal.
  • The Bollinger bands have narrowed, which indicate low volatility. Both Bollinger Lines Slope Up.
  • The RSI indicator is above the mark of 50. It has formed a divergence to increase.
  • The MACD indicator gives a bullish signal.

We expect that the bullish movements may develop if NZDCAD exceeds the upper Bollinger line and its last upper fractal and the upper Bollinger line: 0,853. This level can be used as an entry point. The initial stop loss may be placed below the Parabolic signal, the lower Bollinger line and the low since August 2015: 0,823. After opening the pending order, we shall move the stop to the next fractal low following the Bollinger and Parabolic signals. Thus, we are changing the potential profit/loss to the breakeven point. More risk-averse traders may switch to the 4-hour chart after the trade and place there a stop loss moving it in the direction of the trade. If the price meets the stop loss level (0,823) without reaching the order (0,853), we recommend canceling the order: the market sustains internal changes, which were not taken into account.

Technical Analysis Summary

PositionBuy
Buy stopAbove 0,853
Stop lossBelow 0,823

Market Analysis provided by IFCMarkets

US President Donald Trump Concerned Over Trade Talks With China

By IFCMarkets

The US dollar index rose slightly

On Tuesday, American stock quotes moved away slightly from historical highs. S&P 500 (-0,06%) and Dow Jones Industrial Average (-0,36%) were decreased, and Nasdaq (+0,24%) renewed its historical maximum. The main negative factor for the stock market was the prolongation of US-Chinese trade talks. US President Donald Trump even threatened that he would again increase duties on Chinese goods if Beijing will not be more amenable. The additional factor for price decrease was more pessimistic forecasts for sales of Home Depot (-5.4%) and Kohl’s (-19.5%) retail chains amid reduced consumer spending. Due to the strong drop in the shares of these companies, S&P 500 retail index decreased yesterday on 1,2%. Investors are now awaiting quarterly reports from other major consumer companies such as Lowe’s Cos, Target and Nordstrom to be released this week. The ICE US Dollar index is growing for the second day in a row, awaiting the publication of materials from the Fed meeting for October tonight.

European stock indices fell

European stocks continue to decline this morning. Investors are concerned about problems in US-China trade negotiations, as this could damage global and European exports. The telecommunications sector declined due to the most (0,9%) backdrop in the shares of the satellite company SES by 23%. This happened due to changes in the terms of the auction for the allocation of 5G wireless frequencies. The leader of decline among European major stock indexes is now German DAX 30 (-0,6%). This was due to a drop in the prices of the German Wirecard payment system by 6% after the announcement of plans to cancel the audit of its branch in Singapore. The rate of the EUR/USD is falling today after after 4 days of continuous growth.

11/20/2019 Market Overview IFC Markets chart

Hang Seng fell amid problems in China-US trade talks

Asian stock stock indices are mostly decreasing today. Chinese authorities have accused the US Senate of illegally supporting student protesters in Hong Kong. The Foreign Ministry of China said that the United States should stop interfering in the affairs of Hong Kong and China. The rate of yuan updated a 2-week low. On Wednesday, Nikkei (-0.6%) fell along with other world indices. The leaders in the decline become – exporters, IT sector and transport companies. Japan’s trade balance in October was much weaker than forecasted. Today, the shares of Japanese pharmaceutical companies Sumitomo Dainippon Pharma and M3 Inc. went up in price.

Today Brent is down for the 3rd day in a row

Brent futures prices are decreasing amid the forecast of the independent American Petroleum Institute of increasing US crude stockpile in the week. In addition, Reuters believes that Russia will refuse to further reduce oil production together with OPEC at the next cartel meeting on December 5-6 in Vienna. Russia already participates in the OPEC + agreement on the total restriction of oil production by 1.2 million barrels per day. Another negative factor for the oil market was the unexpected reduction in oil exports to Japan by 1.3% in October this year if compared with October of the last year. This may be a signal of a slowdown in the global economy. The trade war between China and the United States can also help reduce oil demand.

Market Analysis provided by IFCMarkets

Note:
This overview has an informative and tutorial character and is published for free. All the data, included in the overview, are received from public sources, recognized as more or less reliable. Moreover, there is no guarantee that the indicated information is full and precise. Overviews are not updated. The whole information in each overview, including opinion, indicators, charts and anything else, is provided only for familiarization purposes and is not financial advice or а recommendation. The whole text and its any part, as well as the charts cannot be considered as an offer to make a deal with any asset. IFC Markets and its employees under any circumstances are not liable for any action taken by someone else during or after reading the overview.

Dissecting the Stock Bubble Debate: Flow Versus Value

By The Gold Report

Source: Michael Ballanger for Streetwise Reports   11/18/2019

Sector expert Michael Ballanger interprets the latest market moves and manipulations.

“For every action, there is an equal and opposite reaction.” —Sir Isaac Newton (Newton’s Third Law)

In nature, where everything moves freely absent human interference, her omnipotent forces are allowed to manifest themselves in manners that create a living ecosystem that supports life in the air, on land, and on and within the oceans. It is perfectly balanced to sustain itself and has done so over billions of years.

During the Cuban missile crisis of the early 1960s, elementary school children were worried that a nuclear holocaust would cause the world to come to an end, to which my late father would reply, “The world is not going to come to an end. Humanity might come to an end but the world will be just fine.”

So, as this is now Month #3 of “not QE4,” with tens of billions of dollars very recently added to the Fed’s balance sheet, I am reminded of a conversation with a young investor during which I told him that these global levels of debt are threatening the very survival of the current bull market in stocks. His reply was much along the same line of logic as my father offered back in ’62: “Debt is not going to end the bull market in stocks. It might end the global economy but the stock market will be just fine.”

That vocal perversity perfectly capsulizes the degree to which moral hazard has invaded the public psyche. There is seemingly nothing that can or will derail the stock markets and their rightful advances toward the Trumpian Heavens.

Accordingly, I have a question for you anyone and everyone that invests in U.S. financial instruments: What actually is the Federal Reserve’s “mandate”?

The recent Fed stimulus extrapolates to over $1 trillion in liquidity over the next twelve months despite a supposedly booming economy.

The importance of this question is underscored by the recent breakout of the S&P 500 to record highs, fueled 1,000% by the injection of $60 billion per month of liquidity into the banking system by the Federal Reserve bank, whose balance sheet is already overflowing at $1 trillion (yes, with a T) in “assets,” many of which are carried at “par” (100% of maturity value) despite being completely worthless.

Now, the official mandate from the website is “promote effectively the goals of maximum employment, stable prices, and moderate long term interest rates.” Nowhere is there anything about “stock prices” and yet, despite overwhelming evidence of a preoccupation—no, obsession—with the level of the S&P 500, they would argue until they are blue-in-the-face that stock prices are not part of their mandate.

I submit to you that the sheer insanity of the current sovereign debt markets implies that the central bankers, knowing full well that governments the world over are insolvent, have decided that whatever credibility they have left can only be retained as long as stocks remain buoyant. To wit, the S&P, after limping along into September after a rudderless summer, began to resemble a replay of 2018, when out of the blue, up sprang the central planners. and before you could say “printing press,” the Fed had launched REPO actions. Why they needed to “reliquefy the system” with near-full employment (BLS numbers), inflation running “below target” (2%), and long-term yields at 50-year lows is beyond my ken. With zero problems related to the Fed mandate, what was Jay Powell looking at when he pulled out the old Hank Paulsen “bazooka” and launched the singular most gold-and-silver-friendly action since the 2008 Great Financial Bailout.

There are virtually no protests (of any size) in the USA, so what exactly spooked the Fed?

Dovetailing back to the title of this missive, it is really quite easy to identify optical anomalies in financial markets based purely on the reaction of prices in the context of sudden new liquidity. When several hundred years of financial market history is used as a backdrop against which to compare current market behaviors, what unfolds is a macabre distortion of Newton’s Third Law. If a nongovernmental, privately owned agency pumps several trillion dollars of their currency units into the “system,” they are diluting the purchasing power of that unit. These being “digital entries” referencing “cash,”the reality is that every time you cash your paycheck, you are getting less purchasing power because of the debasement of “currency” as a medium of exchange.

When one looks at a balance sheet, on the left side of the sheet under the title of “Assets” you always find “cash.” That does not mean the entity necessarily has a private vault with a stack of paper dollars held within; it is simply a bookkeeping entry, a fabrication, or better still, a “conjuring.” However, whatever you call it, it is that “conjuring” of liquidity that remains the singular most powerful driver for stocks, and it matters not from whence it came. Investors no longer bother to question the source of this added liquidity because there is no source. In the same way that a sorcerer conjures up demons with the wave of a wand or the utterance of magic words, the Fed simply uses a keyboard and a series of press releases to conjure up a trillion dollars.

However, since perception is nine-tenths of reality, the time-tested barometers by which to forecast future inflation—gold and silver—must not be allowed to function lest the average citizen hear the wailing of a financial air raid siren. The charts shown below are clear illustrations of this policy action in full bloom, and it is manifested by way of direct interventions and behavioral conditioning. Traders read of “Fed REPO OPS” and they think “stocks up; gold down,” not so much because a trillion dollars of added liquidity is a sensible, strong policy decision, and anti-inflationary, but rather a “call to arms” for the interventionalist traders operating for the Treasury department or the Fed.

Any way you cut it, I don’t want to be short stocks in this type of environment because they never get margin calls and I do. Period. No short seller alive today has access to S&P futures “phone” armed with a bottomless bank vault.

Since the Crash of 2008, stock prices have been under the direction and supervision of the either central bank or treasury officials, and as such, economic conditions have zero impact on direction and by default, valuation. Those in charge are concerned only with absolute levels of stock averages, such as the S&P, FTST, Paris Bourse, or Nikkei, so it is the flow, as opposed to value, that catches their attention. Because flow trumps value in today’s world, massive money-printing orgies, such as the one in which we now reside, have no bearing on value but do have absolute and total bearing on flow, because the liquidity provided by the Fed REPO OPS are direct boosters to flow.

Accordingly, I have been telling everyone since September to be very careful in trying to short the S&P into year-end, and thus far, that advice has proven spot on. As for gold and silver, ironically, the more I see major market averages achieving escape velocity, the less concerned I am that the invisible hand will continue to lean on the metals. The best period I can recall for gold and silver was 2009–2011, a period in which the world under Fed chairman and bank-rescuer Ben Bernanke, obsessed with Thirties-style deflation, called off the precious metals guard dogs and turned a blind eye as gold hit $1,920 and silver $50, while the S&P and NASDAQ healed up. That kind of boy-in-a-bubble protection from the microbe menace is what I pray for as we close out 2019.

This week’s COT report shifted to a moderately bullish stance as the bullion banks reversed course and start covering shorts and adding new longs. While the aggregate short position is still in the high-and-bearish zone, above 300,000 contracts, the bullion banks bought 36,931 contracts, the largest weekly purchase since before the rally began last May.

While one measly week does not a market make, it is a distinct improvement and when added to the arrival of favourable seasonality, this constitutes a solid “BUY” signal, which I formerly issued for the gold with last week’s brief dip below $1,450. Silver has turned up after touching the sub-30 RSI [relative strength index] zone similar to the May upturn, so I want to see December silver north of $17.50 quickly to confirm the bullish case. Forgive the redundancy, but we need miners outperforming the physicals and silver outperforming gold for this to develop into a rip-roaring year-end rally.

Finally, as a matter of housekeeping, this publication is going to go “Full Twitter” shortly (New Year) so that all BUY and SELL signals and GGMA portfolio moves will be available only through direct messages. It will cost you (USD) $49.99 per month to know my thoughts and exactly how I intend to avoid drawdowns.

To put it into perspective, the SELL signal on silver on Sept. 4, the exact day that the four-month, $5.28-per-ounce rally ended, saved fortunes for those long the December silver contract. Within one month, silver was back below $17, so with each contract requiring (USD) $5,200 in maintenance margin requirement (MMR), a $2.75/ounce drop was a (USD) $13,750 haircut, or 2.64 times MMR. Your savings on the September signal was 22.91 times the annual subscriber fee, so while I beseech you to forgive this shameless promotional plea, you can email me at [email protected] for further instructions and information. I should add that to maintain maximum effectiveness, the subscriber list will be capped at eight-hundred members.

Remember, the December contract for gold goes off-the-board on Nov. 29, so we have ten more Crimex sessions to see this record open interest disappear. The potential is there in spades for heightened volatility as we approach month-end, the algobot that control “flow” will be on the lookout for Trumpian Tweets, and Kudlovian cackles celebrating the “improving trade talks” and the “scintillating economy,” so trade smart and be nimble.

Originally trained during the inflationary 1970s, Michael Ballanger is a graduate of Saint Louis University where he earned a Bachelor of Science in finance and a Bachelor of Art in marketing before completing post-graduate work at the Wharton School of Finance. With more than 30 years of experience as a junior mining and exploration specialist, as well as a solid background in corporate finance, Ballanger’s adherence to the concept of “Hard Assets” allows him to focus the practice on selecting opportunities in the global resource sector with emphasis on the precious metals exploration and development sector. Ballanger takes great pleasure in visiting mineral properties around the globe in the never-ending hunt for early-stage opportunities.

Sign up for our FREE newsletter at: www.streetwisereports.com/get-news

Disclosure:
1) Statements and opinions expressed are the opinions of Michael Ballanger and not of Streetwise Reports or its officers. Michael Ballanger is wholly responsible for the validity of the statements. Streetwise Reports was not involved in any aspect of the article preparation. Michael Ballanger was not paid by Streetwise Reports LLC for this article. Streetwise Reports was not paid by the author to publish or syndicate this article.
2) This article does not constitute investment advice. Each reader is encouraged to consult with his or her individual financial professional and any action a reader takes as a result of information presented here is his or her own responsibility. By opening this page, each reader accepts and agrees to Streetwise Reports’ terms of use and full legal disclaimer. This article is not a solicitation for investment. Streetwise Reports does not render general or specific investment advice and the information on Streetwise Reports should not be considered a recommendation to buy or sell any security. Streetwise Reports does not endorse or recommend the business, products, services or securities of any company mentioned on Streetwise Reports.
3) From time to time, Streetwise Reports LLC and its directors, officers, employees or members of their families, as well as persons interviewed for articles and interviews on the site, may have a long or short position in securities mentioned. Directors, officers, employees or members of their immediate families are prohibited from making purchases and/or sales of those securities in the open market or otherwise from the time of the interview or the decision to write an article until three business days after the publication of the interview or article. The foregoing prohibition does not apply to articles that in substance only restate previously published company releases.

Charts provided by the author.

Michael Ballanger Disclaimer:
This letter makes no guarantee or warranty on the accuracy or completeness of the data provided. Nothing contained herein is intended or shall be deemed to be investment advice, implied or otherwise. This letter represents my views and replicates trades that I am making but nothing more than that. Always consult your registered advisor to assist you with your investments. I accept no liability for any loss arising from the use of the data contained on this letter. Options and junior mining stocks contain a high level of risk that may result in the loss of part or all invested capital and therefore are suitable for experienced and professional investors and traders only. One should be familiar with the risks involved in junior mining and options trading and we recommend consulting a financial adviser if you feel you do not understand the risks involved.

Forex Technical Analysis & Forecast 20.11.2019 (EURUSD, GBPUSD, USDCHF, USDJPY, AUDUSD, USDRUB, USDCAD, GOLD, BRENT, BTCUSD)

Article By RoboForex.com

EURUSD, “Euro vs US Dollar”

After reaching the closest correctional target at 1.1077, EURUSD is moving downwards to reach 1.1066. Possibly, the pair may reach this level and then start another growth towards 1.1072, thus forming a new consolidation range. If later the price breaks this range to the upside, the market may continue the correction towards 1.1085; if to the downside – fall to break 1.1055 and then continue trading inside the downtrend with the short-term target at 1.1033.

EURUSD
Risk Warning: the result of previous trading operations do not guarantee the same results in the future

GBPUSD, “Great Britain Pound vs US Dollar”

GBPUSD is correcting towards 1.2894; it has already finished the second correctional impulse at 1.2899 and right now is growing to reach 1.2939. After that, the instrument may form a new descending structure towards 1.2894 and then continue trading upwards with the target at 1.3020.

GBPUSD
Risk Warning: the result of previous trading operations do not guarantee the same results in the future

USDCHF, “US Dollar vs Swiss Franc”

USDCHF has reached the correctional target at 0.9917; right now, it is falling again. Possibly, the pair may reach 0.9888. Later, the market may form one more ascending structure towards 0.9902 and then start a new decline with the target at 0.9862.

USDCHF
Risk Warning: the result of previous trading operations do not guarantee the same results in the future

USDJPY, “US Dollar vs Japanese Yen”

USDJPY has finished the correction at 108.80; right now, it is falling again to reach 108.30. Possibly, the pair may reach this level and then form one more ascending structure towards 108.60. After that, the instrument may move downwards to break 108.10 and then continue trading inside the downtrend with the short-term target at 107.60.

USDJPY
Risk Warning: the result of previous trading operations do not guarantee the same results in the future

AUDUSD, “Australian Dollar vs US Dollar”

AUDUSD is forming the first descending impulse towards 0.6806. Later, the market may start another correction to reach 0.6820 and then resume moving downwards to break 0.6796. After that, the instrument may continue trading inside the downtrend with the short-term target at 0.6770.

AUDUSD
Risk Warning: the result of previous trading operations do not guarantee the same results in the future

USDRUB, “US Dollar vs Russian Ruble”

USDRUB has completed the consolidation range around 63.80. Today, the pair may break it upwards and reach the first target at 64.11. After that, the instrument may start a new correction towards 63.98 and then form one more ascending structure with the target at 64.54.

USDRUB
Risk Warning: the result of previous trading operations do not guarantee the same results in the future

USDCAD, “US Dollar vs Canadian Dollar”

After completing the correction at 1.3190 and finishing another ascending impulse towards 1.3266, USDCAD is consolidating around this level. If later the pair falls and breaks this range to the downside at 1.3260, the price may start a new correction towards 1.3230; if grows and breaks to the upside at 1.3284 – continue trading upwards with the target at 1.3342.

USDCAD
Risk Warning: the result of previous trading operations do not guarantee the same results in the future

XAUUSD, “Gold vs US Dollar”

Gold is moving upwards. Possibly, the pair may expand the range towards 1476.12 and then form a new descending structure to reach 1468.80. Later, the market may form one more ascending structure towards 1482.20 and then resume moving downwards with the first target at 1464.80.

GOLD
Risk Warning: the result of previous trading operations do not guarantee the same results in the future

BRENT

After completing another descending wave at 61.88 and forming the consolidation range, Brent has broken it downwards. Possibly, the pair may continue the correction towards 60.33. After that, the instrument may start a new growth to reach 61.20, at least, and then resume moving downwards with the target 60.03.

BRENT
Risk Warning: the result of previous trading operations do not guarantee the same results in the future

BTCUSD, “Bitcoin vs US Dollar”

BTCUSD is still consolidating around 8050.00. Possibly, today the pair may grow to reach 8128.00 and then fall to return to 8050.00. Later, the market may break this range upwards and resume growing with the first target at 8270.00.

BITCOIN

Article By RoboForex.com

Attention!
Forecasts presented in this section only reflect the author’s private opinion and should not be considered as guidance for trading. RoboForex LP bears no responsibility for trading results based on trading recommendations described in these analytical reviews.

The US Dollar Has Become Stable. The FOMC Meeting Minutes Are in the Focus of Attention

by JustForex

he US dollar has become stable against currency majors. The dollar index (#DX) moved away from local lows and closed yesterday’s trading session in the green zone (+0.08%). Optimistic data on the real estate market supported the US currency. At the moment, financial market participants have taken a wait-and-see attitude before the publication of the FOMC meeting minutes, which may have a significant impact on the dynamics of major currency pairs. Earlier, Fed Chairman Jerome Powell said that interest rates would remain at current levels until the end of the year.

Demand for safe haven currencies is still at a fairly high level amid uncertainty in settlement of the trade conflict between the US and China, as well as growing political tension in Hong Kong. Yesterday, Donald Trump threatened again to increase tariffs on Chinese imports if a deal with Beijing wasn’t reached. We recommend following current information on these issues. Today, the National Bank of China has lowered its key interest rate from 4.20% to 4.15%.

The “black gold” prices are consolidating after a sharp collapse the day before. Currently, futures for the WTI crude oil are testing the $55.35 mark per barrel. At 17:30 (GMT+2:00), EIA crude oil inventories will be published.

Market Indicators

Yesterday, there was a variety of trends in the US stock markets: #SPY (-0.03%), #DIA (-0.34%), #QQQ (+0.15%).

The 10-year US government bonds yield has been declining. At the moment, the indicator is at the level of 1.74-1.75%.

The Economic News Feed for 20.11.2019:
  • – Inflation report in Canada at 15:30 (GMT+2:00);
  • – Publication of the FOMC meeting minutes at 21:00 (GMT+2:00).

by JustForex

Fibonacci Retracements Analysis 20.11.2019 (GBPUSD, EURJPY)

Article By RoboForex.com

GBPUSD, “Great Britain Pound vs US Dollar”

As we can see in the H4 chart, the descending correction continues between 50.0% and 76.0% fibo at 1.2670 and 1.3040 respectively, with the former being a support level. After completing the pullback, the instrument may start another rising impulse to break the previous high at 1.3012 and then reach the key one at 1.3381.

GBPUSD_H4
Risk Warning: the result of previous trading operations do not guarantee the same results in the future

In the H1 chart, after retesting 23.6% fibo, the pair was forced by the convergence to finish the previous descending wave and start moving upwards to reach the high at 1.3013. We should note that the current decline may transform into a proper descending wave with the possible targets at 38.2%, 50.0%, and 61.8% fibo at 1.2699, 1.2604, and 1.2507 respectively.

GBPUSD_H1
Risk Warning: the result of previous trading operations do not guarantee the same results in the future

EURJPY, “Euro vs. Japanese Yen”

As we can see in the H4 chart, after falling and reaching 50.0% fibo at 121.55, the pair is moving upwards and has already reached 61.8% fibo. If EURJPY continues growing, it may reach 76.0% at 121.55. At the same time, MACD indicator is moving downwards, that’s why the price may yet resume falling towards the local support at 38.2% fibo (118.73).

EURJPY_H4
Risk Warning: the result of previous trading operations do not guarantee the same results in the future

In the H1 chart, after the pair reached 50.0% fibo, there was a convergence, which was followed by a retest of 61.8% fibo. Black Cross on MACD may indicate a new descending impulse towards 61.8% fibo at 118.75.

EURJPY_H1

Article By RoboForex.com

Attention!
Forecasts presented in this section only reflect the author’s private opinion and should not be considered as guidance for trading. RoboForex LP bears no responsibility for trading results based on trading recommendations described in these analytical reviews.

Markets Still Waiting On Trade Deal Clarity

By Orbex

Trade Deal Date Yet To Be Set

US/China trade relations remain center-stage this week as traders continue to try and gauge the proximity of a trade deal.

The US had been pushing for a deal to be signed at the APEC meeting in Chile over the weekend. However, given the recent outbreak of social unrest in Chile, the Chilean president canceled the meeting. Consequently, the trade deal was put on hold with both sides agreeing to establish a new date and venue.

Traders took the news of the cancellation well, given the fragile nature of US/China relations.

Equities prices have been well supported over the week. The SPX500 is continuing to trade into fresh record highs. Over the weekend, high-level officials from the two countries engaged in further talks which were noted to be “constructive”.

Constructive Talks

A statement released by the Chinese commerce ministry following the talks noted:

“The two sides have engaged in constructive discussions around the respective core concerns of the first phase of the agreement and will continue to maintain close communication.”

Speaking with reporters ahead of the weekend’s talks, US Secretary of Commerce Wilbur Ross said that the “phase one” trade deal will likely be “relatively limited in scope.”

He went on to say that it focuses mainly on the Chinese commitment to purchase between $40 – $50 billion of US agricultural products.

US Refusing To Roll-Back Tariffs

Despite the optimism around the deal, risks still remain.

China has been pushing for the US to agree to roll back existing trade tariffs as part of the deal. However, Trump has so far adamantly refused to roll back tariffs.

That being said, Trump has stated that if a deal is done ahead of December 15th, he will cancel the next wave of tariffs to be applied to $156 billion of goods.

China Weighing Up US Political Situation

The issue of the tariff roll-backs could prove to be a stumbling block for the talks.

CNBC reporter Eunice Yoon noted that a government source in China said the mood regarding the deal was pessimistic. According to the source, China is potentially considering holding off on signing a deal thanks to the uncertainty of the outcome of Trump’s impeachment proceedings.

Additionally, there is still some disagreement regarding the specific level of agricultural purchases by China.

Risks Remain

If the mood in China is pessimistic, this is certainly not being felt around the globe.

Equities prices have been broadly higher again this week. For now, it seems that traders are happy in the view that a deal will be done over the coming weeks.

Given the recent drive higher in US equities, however, there is still plenty of room for a sharp downside correction on any disappointment. Talks have unexpectedly broken down out of the blue before. And, if disagreement remains over key issues and China is dragging its heels, Trump could very well react badly and announce further tariffs.

Technical Perspective

USDCNH has recovered firmly off the 6.9614 – 6.9802 support zone. However, it has yet to break back above resistance at the 7.0474 level. While below here, focus remains on a further grind to the downside with 6.8999 the next key level to watch.

By Orbex


Oil Begins To Move Lower – Will Our Predictions Come True?

By TheTechnicalTraders.com

Recently, we posted a multi-part research post suggesting a collapse in Crude Oil could be setting up and how we believe this decline in energy prices may lead to a broader market collapse in the near future.  Crude oil fell more than 3% on November 19 in what appears to be a major price reversal.  On November 20, inventory levels and other key economic data will be presented – could the price of oil collapse even further over the next 60+ days?

Here is a link to our most recent multi-part article about Crude Oil from November 13 (just a week ago): https://www.thetechnicaltraders.com/what-happens-to-the-global-economy-if-oil-collapses-below-40-part-i/

Our original research chart from July 2019

Our original research post, from July 2019, included this chart showing our Adaptive Dynamic Learning (ADL) price modeling system and where it believed the price of oil would go in the future.  This chart highlights expected price ranges and directions all the way into April 2020 with a low price level near $25 somewhere between February and April 2020.  Is Oil really going to reach a low price near $25 ppb in the near future?

On July 10, 2019, we authored a research article using our ADL predictive modeling for Oil.  At that time, we predicted Oil would fall in August, recover in September and October, then collapse to near $42 (or lower) in November and December.  You can read our followup to this article here.

In order for these predictions to continue to hold true, Crude Oil will have to fall below $47 ppb over the next 30+ days and then consolidate through December and January into a fairly tight price range between $42 and $49.  If this happens as we predicted back in July, then there would be a much higher probability that the February, March and April price targets are valid going forward.

On November 19, Crude oil reversed quite extensively to the downside after weeks of upward price pressure.  We believe this downside price rotation may be setting up a bigger, deeper price move that is aligned with our ADL predictive modeling systems results from July 2019 – eventually targeting the sub $50 price level near the end of November or early December. You can get all of my trade ideas by opting into my free market trend signals newsletter.

Concluding Thoughts:

This potential move in Crude Oil is setting up a potentially great trade for active traders if you know how to profit from falling prices and I even talked about how to trade this move in my member’s only trading newsletter service. Remember, if our ADL research is correct, December and January will see very mild price action in Oil.  The bigger breakdown move happens in late January or early February.

On Monday another commodity gave us another trade and it popped 3.4% in our favor within the first trading session. Big moves in stocks, metals, and energy are ready for big price swings here, get ready!

As a trader, you need to be aware of the greater implications for the global markets if Crude Oil falls below $45 ppb (eventually, possibly falling below $30 ppb).  A large portion of the global market depends on oil prices being relatively stable above $50 ppb.  A decrease in oil prices will place extreme pressures on certain nations to maintain oil production and to generate essential revenues.  Depending on how this plays out in the future, falling oil prices could translate into far greater risks for the global stock markets and global economics.

Chris Vermeulen TheTechnicalTraders.com


Trade Progress Met With Muted Response

By Orbex

The renewed reports on the progress of talks between the US and China saw a rather lackluster response from the markets.

Reports surfaced that both parties are negotiating on the rollback of tariffs. The report indicates some progress in the trade talks which fell stale a few days ago. However, the risk-on sentiment remains.

Current Account Surplus Declines in Eurozone 

The latest current account details for the eurozone saw a decline. Data for September showed that the current account surplus fell to 28.2 billion. This was down from the previous month’s print of 28.5 billion.

On a yearly basis, the current account surplus was at 21 billion.

EURUSD Consolidating Near Resistance Area

The currency pair was trading rather modestly on Tuesday. Price action is confined to the resistance area between 1.1062–1.1075. The consolidation could see a breakout in either direction.

With the Stochastics oscillator already in overbought levels, it is likely that we could expect a decline in the near term.

Sterling Declines Amid a Quiet Day

The British pound is trading weaker against the greenback. There were no major developments in regard to the December 12th election campaign.

On the economic front, data was subject to second-tier data. The CBI industrial order expectations sentiment rose modestly to -26 from -37 in the month before.

GBPUSD Retreats from Resistance

The currency pair fell after failing to break past the resistance area of 1.2960. The declines come after GBPUSD failed in its earlier attempt near this resistance level. Price action could trade flat within the support region of 1.2865 if the declines continue.

Gold Prices Mixed Amid a Quiet Trading Day

The precious metal was trading subdued on Tuesday. A lack of any clear progress on the trade narrative kept sentiment in check. There were also no major fundamentals due during the day which saw prices trading within a small range.

XAUUSD Stays Flat Near Minor Resistance

The precious metal was struggling to break out from the previously established highs near 1472. This indicates minor resistance and a failure to breakout higher could trigger a modest move lower.

The main upper resistance remains at the 1483 region which could be tested upon a successful breakout to the upside.

By Orbex