USD stabilized against its main competitors before the publication of the FOMC Minutes. Currently, EUR/USD quotes are consolidating. The local support and resistance levels are 1.10650 and 1.10850, respectively. The head of the Federal Reserve Bank of New York, John Williams, expects the US economy to continue its growth. Further adjustments to monetary policy will depend on future economic releases. Investors also expect new information regarding the settlement of the trade conflict between Washington and Beijing. We recommend opening positions from key levels.
At 21:00 (GMT+2:00) the US will publish the FOMC Minutes.
Indicators do not provide accurate signals the price crossed 50 MA.
The MACD histogram is close to 0.
The Stochastic Oscillator is in the neutral zone, the %K line is below the %D line, which indicates a bearish sentiment.
Trading recommendations
Support levels: 1.10650, 1.10400, 1.10150
Resistance levels: 1.10850, 1.11000, 1.11250
If the price consolidates above 1.10850, expect growth toward 1.11200-1.11400.
Alternatively, the quotes could drop toward 1.10400-1.10200.
The GBP/USD currency pair
Technical indicators of the currency pair:
Prev Open: 1.29517
Open: 1.29241
% chg. over the last day: -0.20
Day’s range: 1.29002 – 1.29305
52 wk range: 1.1959 – 1.3385
GBP/USD quotes retreated from local highs. Investors began to partially fix sterling positions after a long rally. At the moment, the trading instrument is consolidating in the range of 1.29000-1.29300. Market participants expect up-to-date information regarding the Brexit process. Today we recommend you to pay attention to the FOMC Minutes. Open positions from key levels.
The Economic News Feed for 20.11.2019 is calm.
Indicators do not provide accurate signals, the price crossed 100 MA.
The MACD histogram is in the negative zone and below the signal line, which gives a strong signal to sell GBP/USD.
The Stochastic Oscillator is in the neutral zone, the %K line is above the %D line, which indicates bullish sentiment.
Trading recommendations
Support levels: 1.29000, 1.28650, 1.28350
Resistance levels: 1.29300, 1.29700, 1.29850
If the price consolidates above 1.29300, expect the quotes to rise toward 1.29600-1.30000.
Alternatively, the quotes could descend toward 1.28700-1.28500.
The USD/CAD currency pair
Technical indicators of the currency pair:
Prev Open: 1.32055
Open: 1.32663
% chg. over the last day: +0.49
Day’s range: 1.32616 – 1.32877
52 wk range: 1.2727 – 1.3664
The USD/CAD currency pair is showing aggressive purchases. During yesterday’s and today’s trading, the growth of quotations exceeded 80 points. The trading tool has updated key highs. Pressure on the Canadian dollar is exerted by the negative dynamics of oil prices. CAD is currently testing a resistance level of 1.32900. 1.32650 is already a mirror support. Investors expect important economic releases from the US and Canada. Open positions from key levels.
At 15:30 (GMT+2:00) Canada will publish an inflation report.
The price has fixed above 100 MA, which signals the power of buyers.
The MACD histogram is in the positive zone and above the signal line, which gives a strong signal to buy USD/CAD.
The Stochastic Oscillator is in the neutral zone, the %K line crossed the %D line. There are no signals at the moment.
Trading recommendations
Support levels: 1.32650, 1.32500, 1.32350
Resistance levels: 1.32900, 1.33300
If the price consolidates above 1.32900, expect further growth toward 1.33200-1.33400.
Alternatively, the quotes could descend toward 1.32450-1.32300.
The USD/JPY currency pair
Technical indicators of the currency pair:
Prev Open: 108.677
Open: 108.539
% chg. over the last day: -0.18
Day’s range: 108.358 – 108.584
52 wk range: 104.97 – 114.56
The USD/JPY currency pair continues to consolidate. There is no defined trend. At the moment, the local support and resistance levels are 108.400 and 108.650, respectively. Demand for safe haven currencies remains at a fairly high level. Today, financial market participants will evaluate the FOMC Minutes. We also recommend paying attention to the dynamics of yield on US government bonds. Open positions from key levels.
The Economic News Feed for 20.11.2019:
Indicators do not provide accurate signals: 50 MA crossed 100 MA.
The MACD histogram is in the negative zone, but above the signal line, which gives a weak signal to sell USD/JPY.
The Stochastic Oscillator is in the neutral zone, the %K line crossed the %D line. There are no signals at the moment.
Trading recommendations
Support levels: 108.400, 108.250, 108.000
Resistance levels: 108.650, 108.900, 109.050
If the price consolidates below 108.400, expect the quotes to fall toward 108.000.
Alternatively, the quotes could grow toward 108.800-109.000.
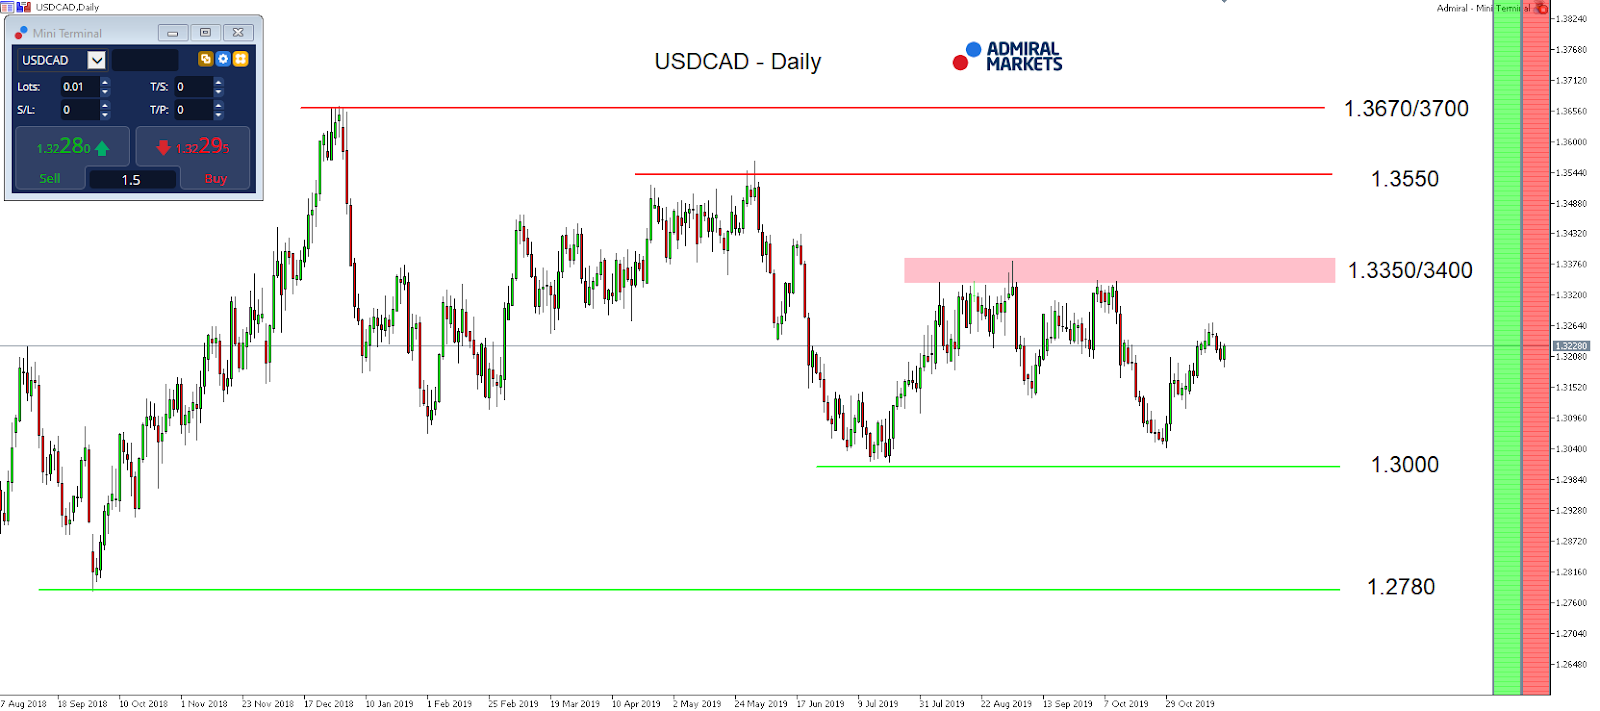
After the Bank of Canada’s last rate decision, where Stephen Poloz, one of the few central bankers around the globe resisting the push towards an easier monetary policy, told markets that he had begun to consider an insurance rate cut. Because of this, today’s Canadian inflation data becomes of higher interest.
With this dovish outlook, and USD/CAD once again gaining against the 1.3000 level the currency pair stays range-bound between 1.3000 and 1.3350/3400.
But if Canadian inflation comes in below expectations (It’s currently at 1.9%), which would come as a surprise given the recent push higher in oil prices, the subdued inflation outlook would bring 1.3350/3400 to the attention of USD/CAD traders and with rising BoC rate cut speculations, a break higher becomes a serious option.
Such a break technically activates the region around 1.3550 as a first target, and above the region around the current yearly highs around 1.360/3700:
Source: Admiral Markets MT5 with MT5-SE Add-on USD/CAD Daily chart (between August 27, 2018, to November 19, 2019). Accessed: November 19, 2019, at 10:00 PM GMT – Please note: Past performance is not a reliable indicator of future results, or future performance.
In 2014, the value of the USD/CAD increased by 9.4%, in 2015, it increased by 19.1%, in 2016, it fell by 2.9%, in 2017, it fell by 6.4%, in 2018, it increased by 8.4%, meaning that after five years, it was up by 28.4%.
Discover the world’s #1 multi-asset platform
Admiral Markets offers professional traders the ability to trade with a custom, upgraded version of MetaTrader 5, allowing you to experience trading at a significantly higher, more rewarding level. Experience benefits such as the addition of the Market Heat Map, so you can compare various currency pairs to see which ones might be lucrative investments, access real-time trading data, and so much more. Click the banner below to start your FREE download of MT5 Supreme Edition!
Disclaimer: The given data provides additional information regarding all analysis, estimates, prognosis, forecasts or other similar assessments or information (hereinafter “Analysis”) published on the website of Admiral Markets. Before making any investment decisions please pay close attention to the following:
This is a marketing communication. The analysis is published for informative purposes only and are in no way to be construed as investment advice or recommendation. It has not been prepared in accordance with legal requirements designed to promote the independence of investment research, and that it is not subject to any prohibition on dealing ahead of the dissemination of investment research.
Any investment decision is made by each client alone whereas Admiral Markets shall not be responsible for any loss or damage arising from any such decision, whether or not based on the Analysis.
Each of the Analysis is prepared by an independent analyst (Jens Klatt, Professional Trader and Analyst, hereinafter “Author”) based on the Author’s personal estimations.
To ensure that the interests of the clients would be protected and objectivity of the Analysis would not be damaged Admiral Markets has established relevant internal procedures for prevention and management of conflicts of interest.
Whilst every reasonable effort is taken to ensure that all sources of the Analysis are reliable and that all information is presented, as much as possible, in an understandable, timely, precise and complete manner, Admiral Markets does not guarantee the accuracy or completeness of any information contained within the Analysis. The presented figures refer that refer to any past performance is not a reliable indicator of future results.
The contents of the Analysis should not be construed as an express or implied promise, guarantee or implication by Admiral Markets that the client shall profit from the strategies therein or that losses in connection therewith may or shall be limited.
Any kind of previous or modeled performance of financial instruments indicated within the Publication should not be construed as an express or implied promise, guarantee or implication by Admiral Markets for any future performance. The value of the financial instrument may both increase and decrease and the preservation of the asset value is not guaranteed.
The projections included in the Analysis may be subject to additional fees, taxes or other charges, depending on the subject of the Publication. The price list applicable to the services provided by Admiral Markets is publicly available from the website of Admiral Markets.
Leveraged products (including contracts for difference) are speculative in nature and may result in losses or profit. Before you start trading, you should make sure that you understand all the risks.
The decline of the index of producer prices for industrial products in Germany accelerated to 0.6% over year in October from 0.1% in September. Will the EURUSD decline?
On 1-hour timeframe EURUSD: H1 is in downtrend, above the 200-period moving average MA(200) which is level. The RSI indicator is below 50 level but has not reached the oversold zone.
On Tuesday the 19th of November, trading on the euro closed six points up. The trend line kept away from 1.0989, but was broken on Wednesday in Asian trading. Yesterday was a day of mixed news for the markets, so investors were unsure which currency to stick with until the end of the week.
Yesterday, US authorities extended Chinese technology firm Huawei’s license for another 90 days. This news had a positive impact on the stock market. At the same time, according to CNBC, the Chinese side is not sure that a trade agreement with the United States will reach an amicable conclusion. This information saw many traders go into protective assets.
Also, the price of oil fell. Brent fell by 3% following a report from Reuters that Russia does not plan to approve a further reduction in oil production at the upcoming December 5 OPEC+ meeting. The news also had a negative effect on the price of the Canadian dollar (CAD).
Day’s news (GMT +3):
12:00 Eurozone: EU Financial Stability Review.
16:30 Canada: Consumer Price Index (MoM) (Oct).
18:30 USA: EIA Crude Oil Stocks Change (Nov 15).
22:00 USA: FOMC Minutes.
Current situation:
On Tuesday, the euro fell to 1.1064 – the target was set at 1.1061. Yesterday, the trend line held back the single currency; today, sellers broke through it. The price met with the Lb at 1.1070 – the balance line acts as support. After the breakdown of the trend line, the target was repositioned to 1.1051.
China has protested against the United States’ approval of the Hong Kong bill. The Ministry of Foreign Affairs of China and the Hong Kong administration called it interference in Chinese affairs and a violation of international laws. The current situation could negatively affect negotiations and the signing of a trade agreement between the United States and China. This means we need to think about dropping risky assets and will see a fall in the EURUSD pair. For the future, 1.0989 looks like a good point to leave at.
Today, we are on the lookout for news from China and FOMC protocols are still in the spotlight.
GBPUSD offered a tepid immediate response to the first televised debate of the current UK election campaign. The historic exchange between Boris Johnson and Jeremy Corbyn offered scarce fresh insights, with the snap poll following the debate suggesting that there was no clear winner.
With Sterling’s latest assault on the 1.30 level versus the US Dollar falling short yet again, the currency pair had moderated in the hours leading up to the debate, before settling in the lower 1.29 range for the time being. The Pound has come off its strongest level against the Euro in six months, only to post slight gains versus the bloc currency during the debate.
Ultimately, investors will relate the outcome of the December 12 polls to the UK’s ambitions of leaving the European Union. Should a path to a surer and speedier Brexit become clearer over the next three weeks, that could translate into GBPUSD emulating its year-to-date high around 1.34. In the meantime, expect the Pound to remain primarily swayed by the political nuances during this campaigning period.
Disclaimer: The content in this article comprises personal opinions and should not be construed as containing personal and/or other investment advice and/or an offer of and/or solicitation for any transactions in financial instruments and/or a guarantee and/or prediction of future performance. ForexTime (FXTM), its affiliates, agents, directors, officers or employees do not guarantee the accuracy, validity, timeliness or completeness, of any information or data made available and assume no liability as to any loss arising from any investment based on the same.
Bob Moriarty of 321gold discusses the Daily Sentiment Index and what it could mean for the markets.
As of November 18th, sentiment for the S&P futures and the Nasdaq Index is approaching nosebleed territory. The infusion of hundreds of billions of dollars on the Fed’s balance sheet since Mid-September has pumped the stock market higher in response. But no matter how big the balloon, if you keep puffing it up, sooner or later it is going to blow. The DSI at 90 for the S&P and 91 for the Nasdaq Index suggests a top is coming soon. Not today but soon.
In addition, the sentiment indicator for the VIX is nearly at a record low at a reading of 10 saying investors show little fear. When the DSI for the stock market indexes is high and for the VIX is low the fireworks are about to begin.
At the very least we should have a correction. If the stock market bubble bursts, life is about to get very interesting. Combined with sheer panic on the part of the Federal Reserve, caution on the part of investors is probably a good idea.
Bob Moriarty founded 321gold.com, with his late wife, Barbara Moriarty, more than 16 years ago. They later added 321energy.com to cover oil, natural gas, gasoline, coal, solar, wind and nuclear energy. Both sites feature articles, editorial opinions, pricing figures and updates on current events affecting both sectors. Previously, Moriarty was a Marine F-4B and O-1 pilot with more than 832 missions in Vietnam. He holds 14 international aviation records.
Disclosure: 1) Statements and opinions expressed are the opinions of Bob Moriarty and not of Streetwise Reports or its officers. The author is wholly responsible for the validity of the statements. Streetwise Reports was not involved in any aspect of the article preparation. The author was not paid by Streetwise Reports LLC for this article. Streetwise Reports was not paid by the author to publish or syndicate this article. 2) This article does not constitute investment advice. Each reader is encouraged to consult with his or her individual financial professional and any action a reader takes as a result of information presented here is his or her own responsibility. By opening this page, each reader accepts and agrees to Streetwise Reports’ terms of use and full legal disclaimer. This article is not a solicitation for investment. Streetwise Reports does not render general or specific investment advice and the information on Streetwise Reports should not be considered a recommendation to buy or sell any security. Streetwise Reports does not endorse or recommend the business, products, services or securities of any company mentioned on Streetwise Reports. 3) From time to time, Streetwise Reports LLC and its directors, officers, employees or members of their families, as well as persons interviewed for articles and interviews on the site, may have a long or short position in securities mentioned. Directors, officers, employees or members of their immediate families are prohibited from making purchases and/or sales of those securities in the open market or otherwise from the time of the interview or the decision to write an article until three business days after the publication of the interview or article. The foregoing prohibition does not apply to articles that in substance only restate previously published company releases.
Premier Health is methodically building an innovative telemedicine platform in Canada, is purchasing a venerable telemedicine firm, and sees 2020 as the year of execution.
The small-cap firm has caught the attention of industry observers. Technical analyst Clive Maund wrote on November 14, “This morning we have what appears to be very positive news out of the company, which is that it has contracted to buy the company Livecare Health Canada, which is an established leader in the fast-growing Canadian telemedicine space. With the 50 and 200-day moving averages fast converging on the Premier chart, this could be the news that causes it to break out, and even if it doesn’t, it is still looking good here.”
Maund followed up on November 15, “Yesterday the stock gained 11% on the news that the company has contracted to buy Livecare Health Canada. . . We therefore stay long and the stock continues to be rated a buy whilst it remains within the Handle part of the Cup & Handle base.”
“Premier Health Group’s stock continues to be rated a buy.” – Clive Maund
Premier Health sees 2019 as the year of building the infrastructure and the platform and 2020 is the year to execute on it. The Vancouver-based company is developing in a number of ways: releasing the MyHealthAccess app, which now has registered over 80,000 patients; contracting to acquire Livecare, a pioneering telemedicine company in Canada; collaborating with IBM to integrate its Watson artificial intelligence into its app; developing a physician tool for medical cannabis evaluation; acquiring Cloud Practice Inc., a medical software applications company whose electronic medical record system is used by clinics with around 3 million patients; and purchasing pharmacies to provide end to end, seamless care to its patients.
MyHealthAccess is a user-friendly telemedicine patient portal where people can directly interact with their healthcare providers and primary care clinics. Patients can book appointments 24/7, check on test results, and have telemedicine visits with their doctor.
“Onboarding and having over 80,000 patients live on our MyHealthAccess platform is a major milestone as we evolve our business and execute on our goal to increase access to healthcare through our app,” said Essam Hamza, MD, CEO of Premier Health. “Eventually, our patients will have increased access to their charts, lab results, have the ability to securely chat with clinical staff, reorder prescriptions and share remote health monitoring data with their doctorall at their fingertips. With a current ecosystem of 3 million patients in our EMR database, we expect to continue to accelerate patient onboarding as we deploy additional features over the coming months.”
Livecare, which Premier Health is acquiring, was one of the first telemedicine companies in Canada. It offers “digital technologies that connect doctors and allied healthcare providers to their patients via secure, encrypted, face-to-face video and messaging. In addition to their telemedicine platform, they offer kindredPHRa personalized health record used for storing, managing, and sharing your health information, thus enabling patients access to manage their own care and share amongst their multiple healthcare providers,” Premier Health noted.
“We are excited about this opportunity to leverage Livecare’s existing partnerships and technology,” said Dr. Hamza. “Livecare has been a pioneer in telemedicine and their knowledge and relationships will be invaluable to our plans moving forward. A key aspect of integration includes their workflow for video consults, specializing in real time assessments with devices like Bluetooth-enabled stethoscopes and otoscopes for physical examination of patients remotely. Having tested the devices in my own practice, I was impressed with the quality of care I was able to provide from a distance, whether it was listening to a heartbeat or performing an ear exam.”
Dr. Hamza noted that because Livecare has a long history and has established many partnerships, that will speed up Premier Health’s expansion plans into Alberta, Ontario and beyond. “This is something that is going to be able to add some fuel to our expansion plans in 2020. It jumps us ahead much faster as well,” he noted.
Premier Health is integrating IBM’s Watson artificial intelligence into its app. “This is the first time the Watson AI division has gone into the primary clinic space, and is developing a chatbot to take on some of the administrative responsibilities of medical office staff, such as making appointments and providing information on when doctors are in, freeing staff up to better assist the doctors and patients in the office,” Dr. Hamza explained. The bot uses natural language, so patients will be able to ask questions, such as where are you located, what are your hours, and what vaccines do I need for my child.
“The chatbot will become smarter over time and will have more features; eventually it will be able to connect with patients’ charts and after authentication, will be able to answer very detailed questions about lab results or X-rays or be the conduit for messages from the doctor,” Dr. Hamza detailed.
Also, over time, the company expects the digitization and aggregation of the data will make it possible to use it in a better way, to be able to draw lessons from it, such as which medications are more effective than others for specific conditions, or which have fewer side effects.
This artificial intelligence technology is in development currently and the first iteration is expected to be released in the first quarter of 2020, the company noted.
In addition, Premier Health purchased two operating pharmacies in Vancouver so that it could expand its services. “The last thing we want is to offer telemedicine services at home or at the office, and then the patient has to drag their kids out of the house to go across town to pick up a prescription,” Dr. Hamza explained. “The pharmacies we acquired are standalone, cash-flow positive, with a very strong, capable team that would join us and help us move forward. We see the potential to partner with pharmacies to deliver prescriptions; in the case of a frail person, potentially a specialty pharmacy in the area could service them with their nurses to not only deliver the medication, but also check in to make sure they are on top of their care.”
This summer, Premier Health joined with CB2 Insights to develop clinical decision support tools on its platform so that healthcare practitioners have access “to the industry’s only data-driven platform that guides clinicians through the evaluation process for medical cannabis treatment.”
Premier Health has approximately 80.7 million shares outstanding, 91.4 million fully diluted. The firm has $2.5 million in the bank, adequate funds, according to the company, to last until the end of 2020.
Disclosure: 1) Patrice Fusillo compiled this article for Streetwise Reports LLC and provides services to Streetwise Reports as an employee. She or members of her household own securities of the following companies mentioned in the article: None. She or members of her household are paid by the following companies mentioned in this article: None. 2) The following companies mentioned in this article are billboard sponsors of Streetwise Reports: Premier Health. Click here for important disclosures about sponsor fees. 3) Comments and opinions expressed are those of the specific experts and not of Streetwise Reports or its officers. The information provided above is for informational purposes only and is not a recommendation to buy or sell any security. 4) The article does not constitute investment advice. Each reader is encouraged to consult with his or her individual financial professional and any action a reader takes as a result of information presented here is his or her own responsibility. By opening this page, each reader accepts and agrees to Streetwise Reports’ terms of use and full legal disclaimer. This article is not a solicitation for investment. Streetwise Reports does not render general or specific investment advice and the information on Streetwise Reports should not be considered a recommendation to buy or sell any security. Streetwise Reports does not endorse or recommend the business, products, services or securities of any company mentioned on Streetwise Reports. 5) From time to time, Streetwise Reports LLC and its directors, officers, employees or members of their families, as well as persons interviewed for articles and interviews on the site, may have a long or short position in securities mentioned. Directors, officers, employees or members of their immediate families are prohibited from making purchases and/or sales of those securities in the open market or otherwise from the time of the interview or the decision to write an article until three business days after the publication of the interview or article. The foregoing prohibition does not apply to articles that in substance only restate previously published company releases. As of the date of this article, officers and/or employees of Streetwise Reports LLC (including members of their household) own securities of Premier Health, a company mentioned in this article.
Additional Disclosures
Clive Maund does not own shares of Premier Health and neither he nor his company has been paid by Premier Health.
Asian stocks are painting a sea of red, as investors grow skeptical that the US and China can exhibit enough will to sign a limited trade deal by next month. Most Asian currencies are now also weaker against the US Dollar, while safe havens such as Gold and the Japanese Yen are advancing.
Given that the US Senate has just passed legislation in support of the Hong Kong protests, such a move threatens to drive a wedge into ongoing US-China negotiations while potentially raising the barrier to a trade deal. Considering that the US and China are struggling even to agree to “phase one”, which had been deemed as more digestible, hopes for a swift conclusion to the trade conflict have clearly been misplaced. The drawn-out nature of “phase one” only points to bigger obstacles ahead, if and when trade talks enter phase two. In order to maintain the current levels of risk appetite in the markets, trade talks must bear fruit soon, or risk investor focus shifting back to the gloomy economic data, as further evidenced by Japan’s October exports seeing its sharpest drop in three years.
Pound offers lukewarm response to Johnson-Corbyn debate
GBPUSD offered a tepid immediate response to the first televised debate of the current UK election campaign, while the Pound is now weaker against most Asian currencies. The historic exchange between Boris Johnson and Jeremy Corbyn presented scarce fresh insights, with the snap poll following the debate suggesting that there was no clear winner, which offered Pound traders little to hang their hats on.
With Sterling’s latest assault on the 1.30 level versus the US Dollar falling short yet again, the currency pair had moderated in the hours leading up to the debate, before settling just above the 1.29 mark at the time of writing. The Pound has also come off its strongest level against the Euro in six months, only to post slight gains versus the bloc currency during the debate. Over the next three weeks, expect the Pound to remain primarily swayed by the political nuances during this campaigning period.
Gold gains as markets begin to doubt trade deal prospects
Gold has broken back above the $1470 psychological level, amid dimming hopes of a US-China trade deal. Bullion is expected to end the year with its double-digit annual gain intact, even in the event of a signed limited US-China trade deal. While not a base case for most investors at present, a complete capitulation in ongoing trade talks should send Gold surging back above $1500 while potentially paving the way for a global recession.
Disclaimer: The content in this article comprises personal opinions and should not be construed as containing personal and/or other investment advice and/or an offer of and/or solicitation for any transactions in financial instruments and/or a guarantee and/or prediction of future performance. ForexTime (FXTM), its affiliates, agents, directors, officers or employees do not guarantee the accuracy, validity, timeliness or completeness, of any information or data made available and assume no liability as to any loss arising from any investment based on the same.
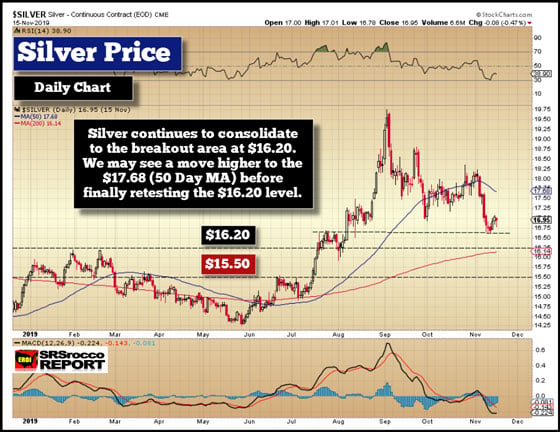
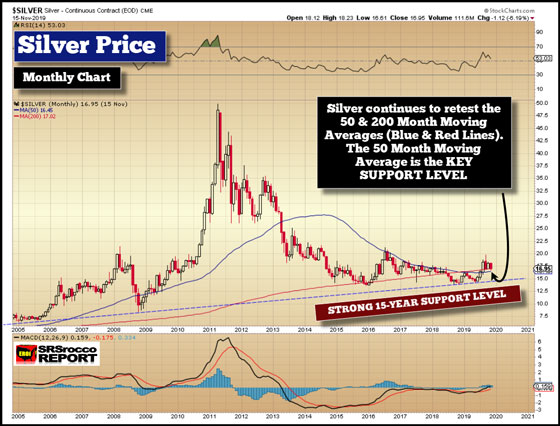
The precious metals continue to consolidate from their summer breakouts. While some analysts debate whether or not silver “Broke Out” this year, I am in the camp that a close above the 50 Month Moving Average was a BIG DEAL. But first, here is the daily silver chart:
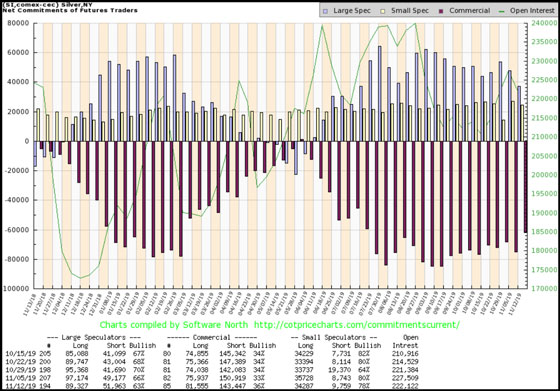
After silver reached a high of $19.75 at the beginning of September, it’s been consolidating lower, back to the $16.20 breakout level. I believe silver may experience a bit of a move higher to the $17.68 level (50 Day Moving Average) before heading lower to retest the $16.20 level. There was also a nice liquidation of Commerical Silver Shorts during least weeks COT Report.
By looking at these charts, the crucial long-term level for silver is the 50 Month Moving Average of $16.45:
There is no coincidence that silver closed on the 200 Month Moving Average (RED LINE) for the past three months. However, the key level is the 50 Month Moving Average (BLUE LINE). The Dashed Blue line is the Strong 15-Year Support Level for silver, which denotes the cost of production for the overall industry. Thus, I highly doubt silver will fall below this level and remain there for an extended period.
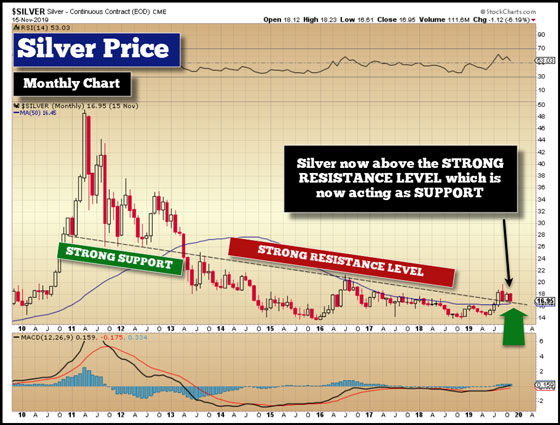
In this last monthly chart of silver, there is another crucial KEY LEVEL shown. The Dashed Black Line was support for the silver price from 2011-2012. But, when silver fell below this support line and the 50 Month Moving Average (MMA), it remained below it since 2013. With silver breaking above both the Dashed Blackline and the 50 MMA, it is a very positive sign.
With the silver price right at its 200 Month Moving Average while the broader indexes are 90-130% above their 200 MMA’s, my money is on silver. Again, the smart investor BUYS AT THE BOTTOM and SELLS AT THE TOP. While silver may continue to consolidate lower over the next few months, it is primed for the next BIG MOVE higher when the Day of Reckoning guts the markets in 2020.
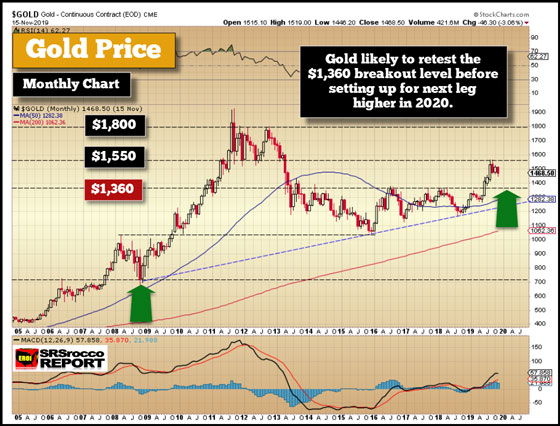
Lastly, here is the monthly gold chart. I believe gold will likely fall back down to the $1,360 level before setting up for the next leg higher in 2020.
When gold broke above the $700 level at the end of 2007, it quickly ran up to $1,050. Then over the next eight months, it consolidated lower back to the $700 level before setting up for the next stage higher. After gold broke through the $1,360 level July this year, it shot up quickly to the next resistance level of $1,550. Again, I believe gold will fall back to the $1,360 level to wash out the majority of Commercial Short positions before the next BIG MOVE higher in 2020.
My Thoughts On Precious Metals Manipulation
I continue to read articles on the subject of precious metals manipulation from analysts on the various gold and silver websites. While there is no doubt that the precious metals are being manipulated, so is everything else. I also read analysts suggested that the significant increase in Commercial gold and silver shorts two weeks ago was an attempt to smash the precious metals prices. Maybe. However, if the market realizes the Fed is now backstopping everything, then it’s no surprise that gold and silver will correct lower while the broader markets reach new highs.
So, we also shouldn’t be surprised to see the Commercials add more gold and silver shorts when the Fed is now propping up EVERYTHING. But, you CANNOT prop up an economy with paper forever. And, this is the problem the Fed and Central banks will have to deal with in 2020.
In conclusion, gold and silver prices will likely consolidate lower as the BUBBLE MARKETS continue higher by defying gravity and all fundamental valuations. However, when the DAY OF RECKONING FINALLY COMES, likely in 2020, I would make sure I had purchased some gold and silver insurance.
The Money Metals News Service provides market news and crisp commentary for investors following the precious metals markets.
Steeper than expected PPI growth bullish for NZDUSD
Steeper producer prices increase in New Zealand was recorded in the September quarter instead of slowing of producer prices growth. Will the NZDUSD rise?
The price chart on 1-hour timeframe shows NZDUSD: H1 is trading sideways. The price is rising above the 200-period moving average MA(200) which is rising. And the RSI oscillator is above 50 level and has not reached the overbought zone. There is no trend yet formed, traders have to decide when it would be a best time to enter the market.