Over the last few days, the technical picture in Gold hasn’t significantly changed: after the push below 1,500 USD, mainly driven by the sharp rise in 10-year US-Treasury yields at the start of November, the rest of the week with Thanksgiving and Black Friday should present themselves with overall low volatility.
Still, today we could probably some stronger moves, especially with the GDP Growth Rate at 1330 GMT and its second estimate.
The first estimate beat market expectations of 1.6 percent, following a 2 percent expansion, so a positive surprise should be priced in, while a disappointing reading could result in a positive push for the precious metal.
In general, and from a fundamental perspective, the outlook for Gold remains positive in our opinion.
With the Fed’s balance sheet expanding at a faster rate than during QE1, QE2 or QE3, 10-year US-Treasury yields losing their bullish momentum of the first two weeks of November and rumours making rounds that the mood in Beijing about a trade deal is rather pessimistic (=tensions between the US and China rising again), while into the yearly close a known bullish seasonal window opens, Gold bulls are most likely already champing at the bit, at least behind closed doors.
While technically, our picture switches to Long again with Gold breaking back above 1,520 USD which would level the path up to the current yearly highs around 1,557 USD, a first bullish sign in the lower time-frames (H1) is already sent with Gold recapturing 1,490/495 USD:
Source: Admiral Markets MT5 with MT5-SE Add-on Gold Daily chart (between August 28, 2018, to November 26, 2019). Accessed: November 26, 2019, at 10:00pm GMT – Please note: Past performance is not a reliable indicator of future results, or future performance.
In 2014, the value of Gold fell by 1.7%, in 2015, it fell by 10.4%, in 2016, it increased by 8.1%, in 2017, it increased by 13.1%, in 2018, it fell by 1.6%, meaning that after five years, it was up by 6.4%.
Discover the world’s #1 multi-asset platform
Admiral Markets offers professional traders the ability to trade with a custom, upgraded version of MetaTrader 5, allowing you to experience trading at a significantly higher, more rewarding level. Experience benefits such as the addition of the Market Heat Map, so you can compare various currency pairs to see which ones might be lucrative investments, access real-time trading data, and so much more. Click the banner below to start your FREE download of MT5 Supreme Edition!
Disclaimer: The given data provides additional information regarding all analysis, estimates, prognosis, forecasts or other similar assessments or information (hereinafter “Analysis”) published on the website of Admiral Markets. Before making any investment decisions please pay close attention to the following:
This is a marketing communication. The analysis is published for informative purposes only and are in no way to be construed as investment advice or recommendation. It has not been prepared in accordance with legal requirements designed to promote the independence of investment research, and that it is not subject to any prohibition on dealing ahead of the dissemination of investment research.
Any investment decision is made by each client alone whereas Admiral Markets shall not be responsible for any loss or damage arising from any such decision, whether or not based on the Analysis.
Each of the Analysis is prepared by an independent analyst (Jens Klatt, Professional Trader and Analyst, hereinafter “Author”) based on the Author’s personal estimations.
To ensure that the interests of the clients would be protected and objectivity of the Analysis would not be damaged Admiral Markets has established relevant internal procedures for prevention and management of conflicts of interest.
Whilst every reasonable effort is taken to ensure that all sources of the Analysis are reliable and that all information is presented, as much as possible, in an understandable, timely, precise and complete manner, Admiral Markets does not guarantee the accuracy or completeness of any information contained within the Analysis. The presented figures refer that refer to any past performance is not a reliable indicator of future results.
The contents of the Analysis should not be construed as an express or implied promise, guarantee or implication by Admiral Markets that the client shall profit from the strategies therein or that losses in connection therewith may or shall be limited.
Any kind of previous or modeled performance of financial instruments indicated within the Publication should not be construed as an express or implied promise, guarantee or implication by Admiral Markets for any future performance. The value of the financial instrument may both increase and decrease and the preservation of the asset value is not guaranteed.
The projections included in the Analysis may be subject to additional fees, taxes or other charges, depending on the subject of the Publication. The price list applicable to the services provided by Admiral Markets is publicly available from the website of Admiral Markets.
Leveraged products (including contracts for difference) are speculative in nature and may result in losses or profit. Before you start trading, you should make sure that you understand all the risks.
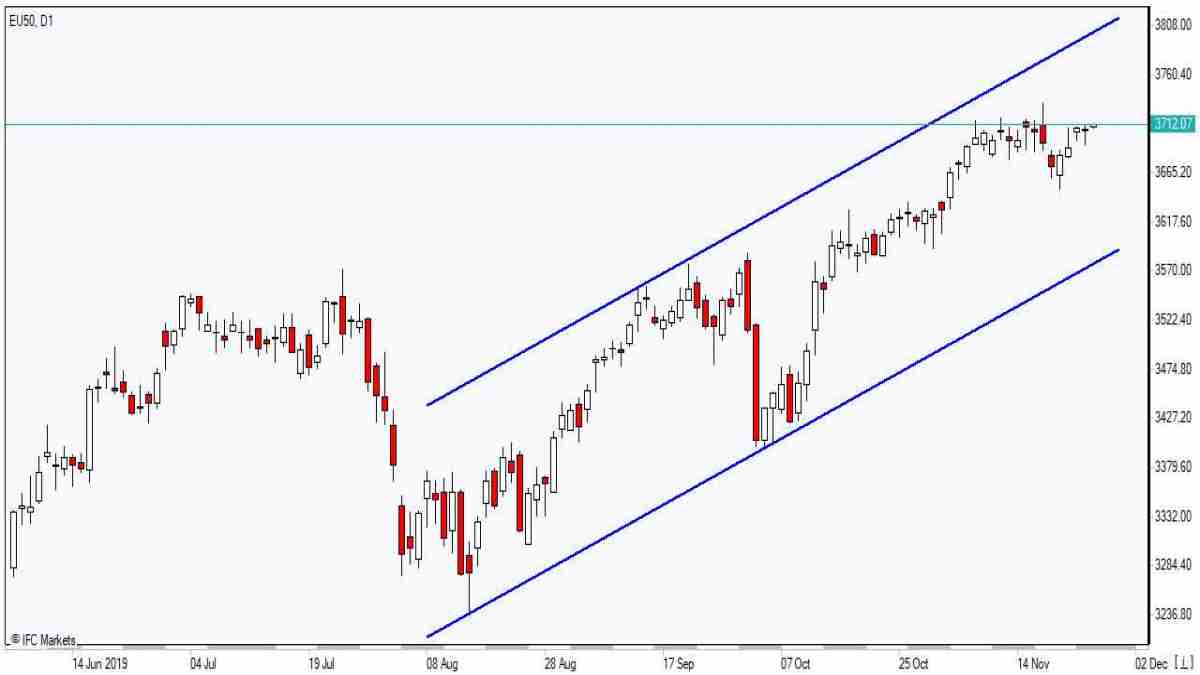
On Tuesday the 26th of November, the euro was slightly up at the close of trading. The value of the euro spent the whole day in a sideways trend. On the one hand, the euro supported the EURGBP cross, but on the other hand, the strengthening US dollar put it under pressure.
The cross currency gained value, amid a weakening pound. According to the results of the latest political poll in the UK, the advantage held by the Conservative Party ahead of the General Election has decreased.
Representatives of the United States and China said that the trade agreement negotiations are approaching a conclusion. Major US stock indices continued to rise and reached new highs.
18:00 USA: Pending Home Sales (MoM) (Oct), Personal Spending (Oct).
18:30 USA: EIA Crude Oil Stocks Change (Nov 22)
22:00 USA: Fed’s Beige Book.
Current situation:
During the day, the EURUSD pair was caught in a sideways trend. The price did not reach the calculated level of 1.0990. At the time of writing, the euro is worth 1.1008. We still expect a weakening of the single currency against the US dollar, and as a result, we will not be making any changes to our forecast.
This week is “shortened” due to Thanksgiving taking place in the US on Thursday, therefore, with a decrease in liquidity, sharp fluctuations are possible, as is a fall in value below 1.0990. At 16:30, the report on US GDP for the third quarter will be published. This is the second assessment, so we shouldn’t be expecting any strong reactions to it. An exception would be serious deviations from the previous value.
Asian stocks and currencies are mixed, even though US equities notched new record highs following President Donald Trump’s latest assessment that the US and China are in the “final throes” of a trade deal. Gold remains suppressed around the $1460 level, USDJPY has strengthened above the 109.0 psychological mark, while 10-year US Treasury yields keep within the 1.70-1.80 range.
The upward momentum for riskier assets is at risk of petering out, with investors perhaps needing stronger motivation beyond mere feel-good rhetoric regarding the potential US-China trade truce. Markets can only ignore the dismal economic data for so long, with the recently-announced 9.9 percent decline in China’s October industrial profits drawing attention to the strains faced by the world economy. December 15 now acts as the next marker in this protracted saga, with investors still speculating if the trade accord can be sealed before President Trump has to decide whether to push on with his tariff threat on $160 billion worth of Chinese goods.
Dollar resilience at risk if US consumers fail to deliver
The Dollar Index (DXY) has remained steady so far this week with most G10 currencies now slightly weaker against the Greenback. Investors have bought into Fed chair Jerome Powell’s messaging that the central bank’s policy settings remain appropriate at this point in time, given that Fed funds futures point to US benchmark interest rates remaining unchanged through the first half of 2020. With the Fed expected to stand pat on interest rates, barring a “material’ change in the US economic outlook, this leaves the US-China trade deal in the driver’s seat in terms of guiding the Dollar’s near-term performance.
Still, the upcoming US GDP revision and consumer spending figures are set to grab the immediate focus of the markets, amid a backdrop of slowing global growth. Investors would want to know how much US consumers can still be relied on to keep the world’s largest economy chugging along, considering that consumer confidence has declined every month since July. Should Wednesday’s economic releases show larger cracks appearing in the US economy, that could prompt the DXY to return below the 98.0 psychological level.
Oil gains capped until US and China put pen to paper
Oil bulls are riding the latest wave of optimism that the US and China can eventually seal a “phase one” trade accord. However, until the deal is officially signed, Brent’s upside is expected to be limited below $70/bbl, as fatigue starts setting in among investors who are being made to wait for longer than initially expected. As long as the US and China keep communication lines open, it prevents Oil prices from falling drastically lower from current levels.
Disclaimer: The content in this article comprises personal opinions and should not be construed as containing personal and/or other investment advice and/or an offer of and/or solicitation for any transactions in financial instruments and/or a guarantee and/or prediction of future performance. ForexTime (FXTM), its affiliates, agents, directors, officers or employees do not guarantee the accuracy, validity, timeliness or completeness, of any information or data made available and assume no liability as to any loss arising from any investment based on the same.
US stocks rally continued on Tuesday as market sentiment was boosted by positive assessment of the economy from Federal Reserve Chairman Jerome Powell despite mixed data. The S&P 500 rose 0.2% to new record 3140.52. The Dow Jones industrial average gained 0.2% to fresh record 28121.68. Nasdaq added 0.2% to 8647.93. The dollar strengthening halted as the trade deficit fell above expected 6% to $66.5 billion, while the Conference Board’s consumer confidence index fell fourth month in a row in November. The live dollar index data show the ICE US Dollar index, a measure of the dollar’s strength against a basket of six rival currencies, slipped less than 0.1% to 98.24 but is higher currently. Futures on US stock indices point to higher openings.
European indexes gain while DAX 30 slips
European stock indexes advanced fourth straight session on Tuesday buoyed by trade hopes as China’s Commerce Ministry said Chinese and US negotiators agreed on talks toward a preliminary “phase one” deal. The EUR/USD turned higher while GBP/USD slid yesterday with both pairs lower currently. The Stoxx Europe 600 ended 0.2% higher led by materials stocks. The German DAX 30 however slipped 0.1% to 13236.42. France’s CAC 40 added 0.1%. UK’s FTSE 100 advanced 0.1% to 7403.14.
Australia’s All Ordinaries Index still ahead Asian indexes
Asian stock indices are mostly higher today on the backdrop of President Donald Trump’s comment Tuesday that “We’re in the final throes of a very deal.” Nikkei rose 0.3% to 23437.77 with yen slide against the dollar intact. Chinese stocks are mixed as data showed Chinese industrial companies’ profits contracted further in October: the Shanghai Composite Index is down 0.1% while Hong Kong’s Hang Seng index is 0.1% higher. Australia’s All Ordinaries Index extended gains 0.9% with Australian dollar resuming its slide against the greenback.
Brent futures prices are little changed today. Prices recovered yesterday: January Brent rose 0.9% to $64.27 a barrel on Tuesday. Trade group the American Petroleum Institute late Tuesday report indicated US crude supplies rose by 3.6 million barrels last week. Today at 16:30 CET the Energy Information Administration will release US Crude Oil Inventories.
Note: This overview has an informative and tutorial character and is published for free. All the data, included in the overview, are received from public sources, recognized as more or less reliable. Moreover, there is no guarantee that the indicated information is full and precise. Overviews are not updated. The whole information in each overview, including opinion, indicators, charts and anything else, is provided only for familiarization purposes and is not financial advice or а recommendation. The whole text and its any part, as well as the charts cannot be considered as an offer to make a deal with any asset. IFC Markets and its employees under any circumstances are not liable for any action taken by someone else during or after reading the overview.
By CentralBankNews.info Lesotho’s central bank left its benchmark CBL rate unchanged at 6.50 percent and reiterated the risks to the domestic economic outlook include exposure to global economic developments and weak domestic economic activity on the back of structural rigidities and policy uncertainty. The Central Bank of Lesotho (CBL), which cut its rate in July by 25 basis points, said economic activity had picked up slightly in the third quarter, with the CBL measure of economic activity indicating output had expanded at a rate of 0.3 percent in the third quarter compared with a 1.0 percent contraction in the second quarter. Consumer demand had improved in the third quarter while the supply side had remained weak, CBL added. Lesotho’s inflation rate has decelerated for the last 5 months and fell to 4.9 percent in October from 5.1 percent in October and 5.9 percent in May, but CBL said prevailing drought present a risk to the inflation outlook.
The Central Bank of Lesotho issued the following statement:
“The Monetary Policy Committee (MPC) of the Central Bank of Lesotho (CBL) held its 80th meeting on the 26th November 2019. During this meeting, the Committee considered international, regional and domestic economic developments and financial markets’ conditions, to determine monetary policy action that is appropriate for executing the CBL’s primary mandate of maintaining price stability.
The global economic activity exhibited a broad-based slowdown in the third quarter of 2019. Growth weakened in both advanced and emerging market economies on account of softer trade and investment, as well as, manufacturing output, despite resilient consumption and services sector output in advanced economies. However, downside risks to the global economic outlook remain elevated and generally emanate from trade and geo-political tensions and other country-specific factors.
While global inflation rates remained low, inflationary pressures were mixed in advanced economies. The US registered a slight increase in the rate of inflation although the Euro Area, Japan and the UK experienced decelerations. The monetary policy stance remained accommodative across advanced economies, with the US cutting its key policy rate twice in the third quarter while policy rates remained unchanged in the Euro area, Japan and UK.
In emerging market economies, economic activity indicators were mixed in the third quarter of 2019, but generally pointed to weakened growth. China’s economic growth slowed to 6 per cent, following a 6.2 per cent growth in the second quarter.
In South Africa, low business confidence undermines growth prospects in the medium term while risks to long-term growth emanate largely from structural challenges. The annual rate of headline inflation, measured by changes in the consumer price index (CPI) for all urban areas, was recorded at 3.7 per cent in October 2019.
The domestic economic activity picked up slightly in the quarter ending September 2019. The CBL measure of economic activity indicated that output had increased at a rate of 0.3 per cent in the third quarter compared with a 1.0 per cent contraction in the preceding period. This was mainly at the back of improved consumer demand, while the supply side remained weak. In the labour market, employment by the LNDC-assisted firms declined further in the third quarter on account of lack of orders for some of the bigger firms.
The inflation rate, measured by year-on-year percentage change in consumer price index (CPI), declined from 5.1 per cent in September 2019 to 4.9 per cent in October 2019. The major contributors to this position were Food and non-alcoholic beverages, Housing, electricity, gas and other fuels and Recreation and Culture. However, risks to inflation outlook remain, emanating from the prevailing drought conditions.
Money supply, as measured by M2, increased by 7.3 per cent in the third quarter of 2019 following a decline of 2.1 per cent in the second quarter. This was as a result of an increase in both net foreign assets and net domestic claims. Private sector credit continued on an upward trend, increasing by 7.1 per cent in September 2019.
The external sector position worsened in the third quarter, on account of a widening trade account deficit despite an improvement in the primary and secondary income accounts. Consequently, gross international reserves fell to 4.2 months of import cover from 4.5 months in the second quarter.
Government operations culminated in a fiscal deficit of 3.4 per cent of GDP in September 2019, largely as a result of higher government spending that outstripped a marginal increase in government revenues. The deficit was financed by a drawdown of government deposits as well as issuance of government securities.
10.In summary, the global economic activity weakened, with heightened risks in the third quarter of 2019. Domestically, growth was weak, while consumer price inflation decelerated in October 2019. Risks to the domestic economic outlook include exposure to global economic developments, weak domestic economic activity on the back of structural rigidities and policy uncertainty. 11.Having considered the above developments, the MPC decided to:
Increase the NIR target floor from US$720 million to US$790 million.
Maintain the CBL rate at 6.50 percent per annum.
12. The Committee will continue to monitor the global developments and their likely impact on domestic macroeconomic conditions, especially the CBL net international reserves (NIR), with the aim of taking corrective action when needed.”
Skyharbour CEO Jordan Trimble discusses uranium supply and demand fundamentals with Maurice Jackson of Proven and Probable and his company’s upcoming drill program in the deep rocks of the Athabasca Basin.
Maurice Jackson: Joining us for a conversation is Jordan Trimble, the president, director and CEO of Skyharbour Resources Ltd. (SYH:TSX.V; SYHBF:OTCQB). Glad to speak with you today to provide shareholders updates on a number of key developments that are currently taking place with Skyharbour Resources Ltd.. Today’s interview will focus on the uranium price and upcoming news flow.
Before we delve into these topics, Mr. Trimble, for someone new to the story, please introduce us to Skyharbour Resources, A Preeminent Uranium Explorer in Canada’s Athabasca Basin, and the opportunity the company presents to the market.
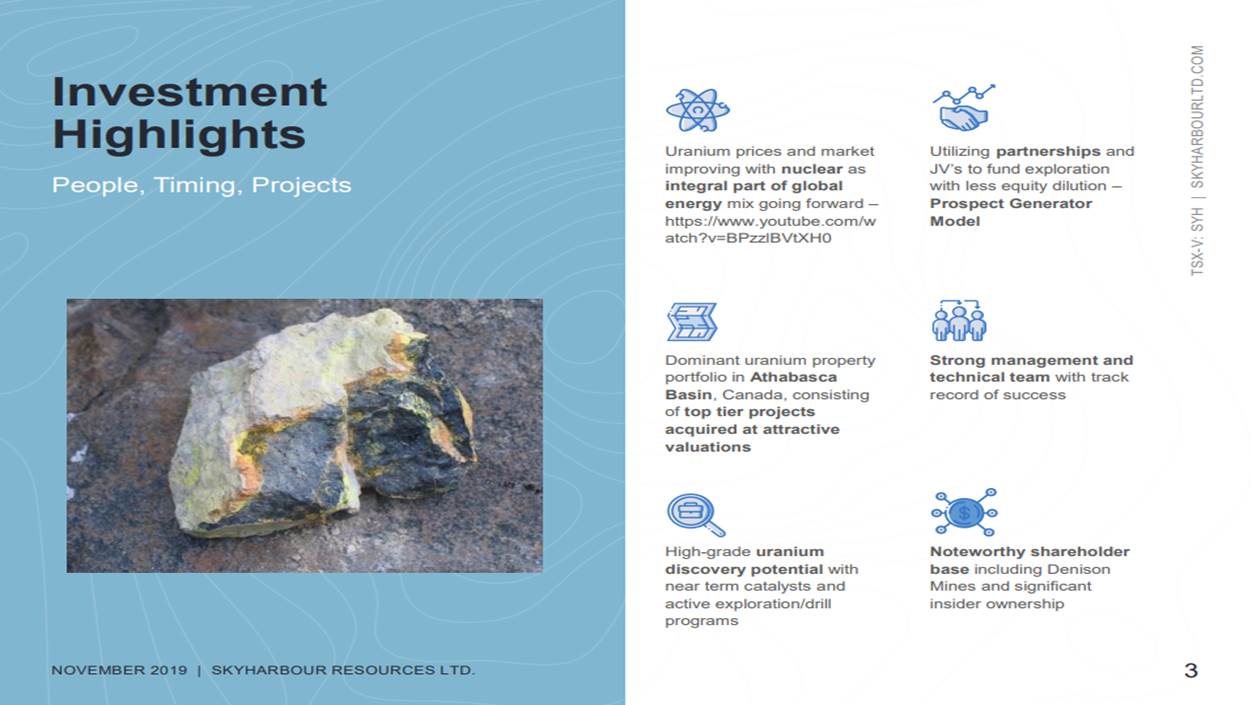
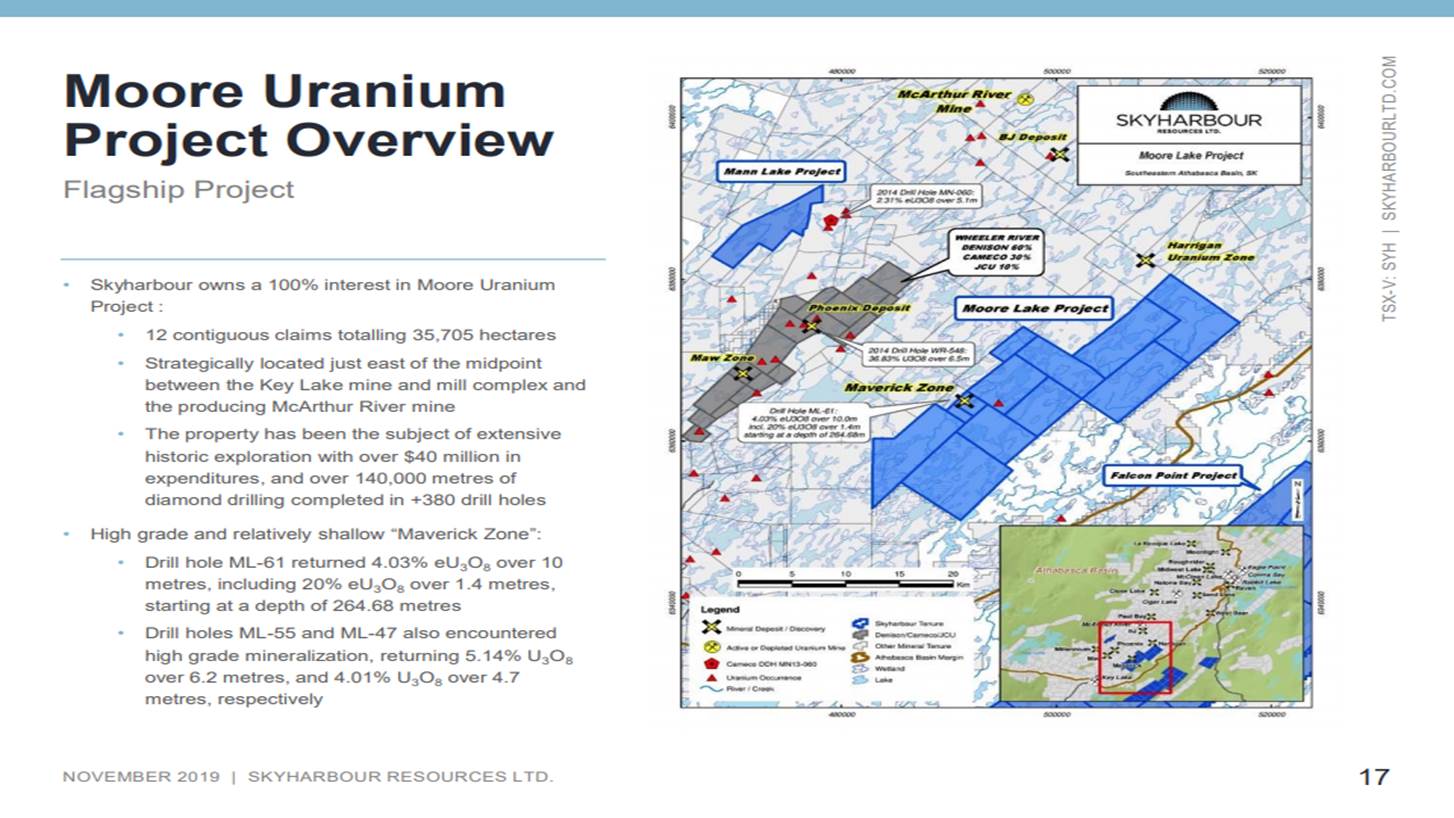
Jordan Trimble: Skyharbour Resources is a high-grade exploration and early stage development uranium company. We have six projects located in the Athabasca Basin, which hosts the highest-grade depository of uranium in the world. Some notable recent discoveries there were made by companies like NextGen, Fission and Denison. The six projects were acquired over the last several years. We spent the first few years when I started running the company acquiring these projects and did a good job of being opportunistic in a tough uranium market wearing our contrarian caps and going out there and buying these projects for really pennies on the dollar. It’s a big land package, about a half a million acres of ground. Again, the various projects are scattered throughout the basin and what’s interesting is two of the projects have deposits, one of which is our flagship project called the Moore Project.
This is on the east side of the Athabasca Basin located proximal to nearby infrastructure and mills. There’s a high-grade mineralized zone there called the Maverick Zone. That’s where we’re going to be drilling in our upcoming drill program. The other projects outside of our flagship project we advance using something called prospect generation. This is a strategy whereby we look to bring in partner companies that can come in, that can fund the exploration. We get some cash and stock payments as well. So that allows us to focus our time, money and efforts on our flagship project really where we feel we have the best chance of adding value and making new discoveries and finding more high-grade uranium while partner companies advance the other projects.
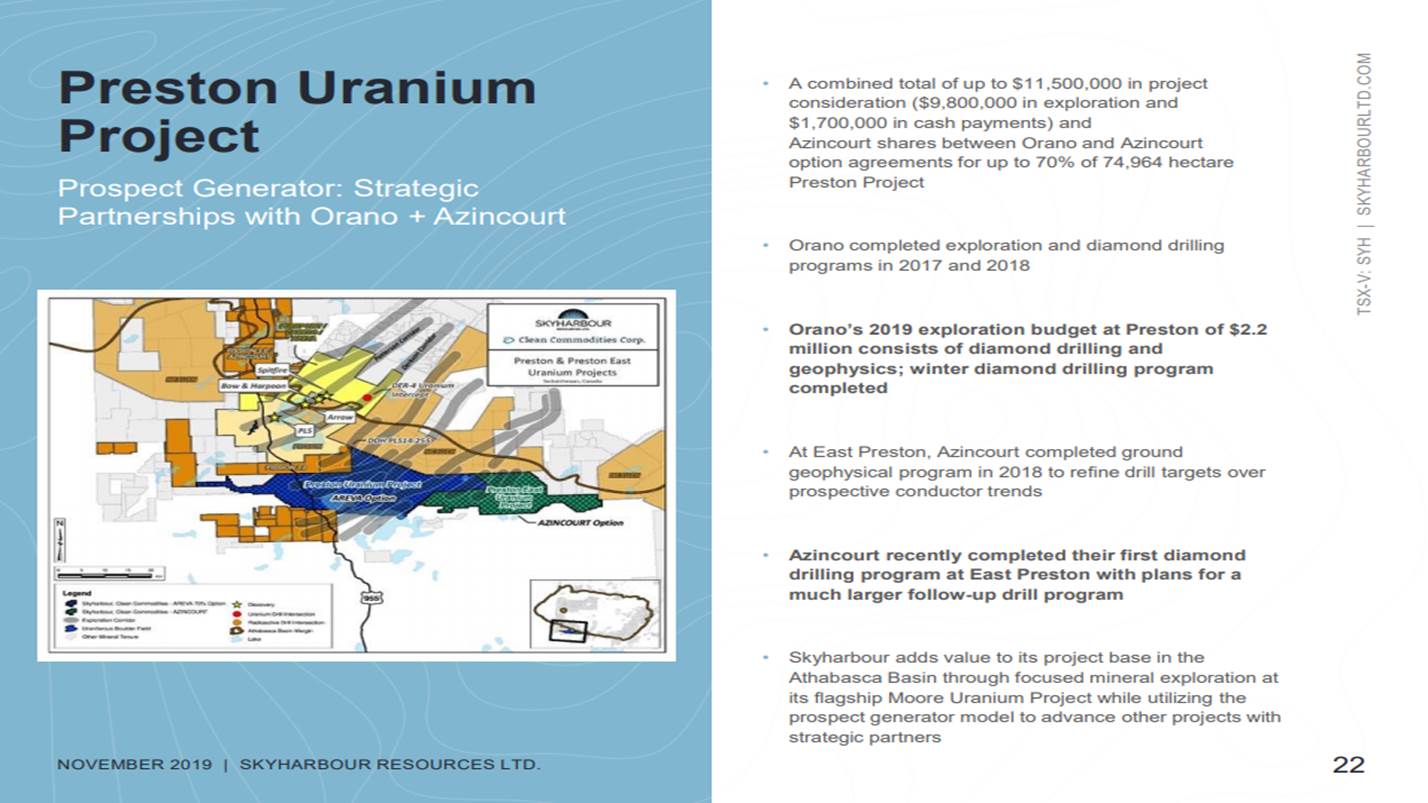
So that’s a high level on the company. A fair bit of news flow coming out over the next six months as we have plans for drilling 2,500 meters at the Moore Project as I mentioned, but we also have two partner companies, Orano, which is France’s largest uranium mining company based in Paris. It’s planning an exploration program early in the new year and our Preston project is a part of its $8 million earn in on that project. Another partner company Azincourt is planning to drill 2,500 meters at our East Preston project. So you’ll have three simultaneous exploration and drill programs underway early in the new year and we feel that the timing couldn’t be better given the rising uranium price. We’ve just started to see the spot price tick up here recently.
Maurice Jackson: That set the stage for today’s discussion regarding some key fundamentals in the uranium sector. Jordan, regarding react requirements, what is the annual global demand for uranium?
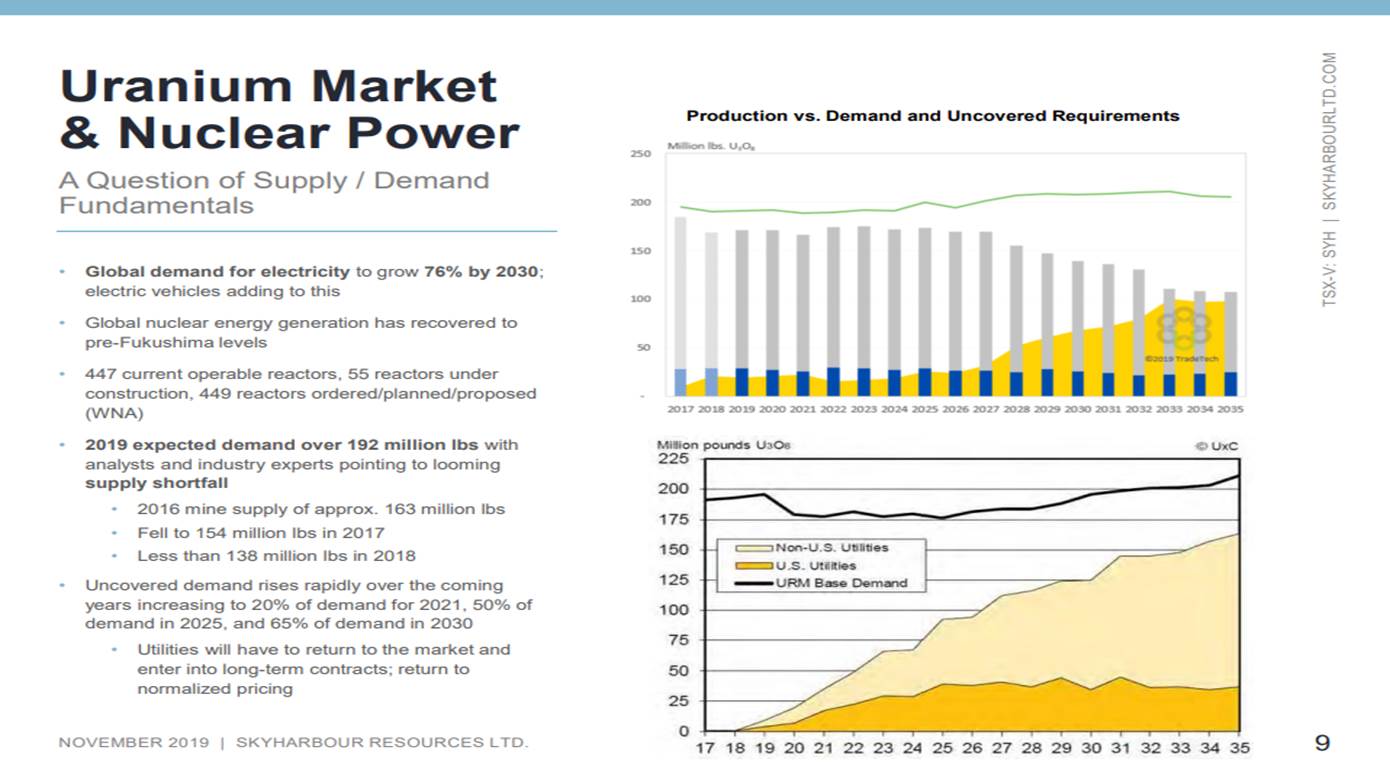
Jordan Trimble: Right now, it is well over 190 million pounds, close to about 195 million pounds. Again, that’s in a nuclear reactors globally and that’s been steadily increasing. There’s a fallacy out there that this industry is in decline; that’s not the case. It’s very much still a growth industry in places like China and India. I was at a conference earlier in the fall in London, the World Nuclear Association, whereby they came out with their biannual nuclear fuel report, which for the first time since Fukushima had increasing demand in all three scenarios, an upper-case, a mid-case and a lower case. In the upper and mid-case or base case, there was quite significant increase in demand. So we see demand continuing to grow.
Maurice Jackson: Now let’s juxtapose that with the primary mine supply, which is?
Jordan Trimble: A lot lower. We’re now producing less than about 135 million pounds annually. That’s down from about just over 160 million pounds a couple of years back. We’ve seen some major supply cuts, project deferrals. We’ve seen funds that have come in in the last year, year and a half, that have sequestered a new supply coming online that have bought pounds. All of this has led to a very large decrease in the amount of supply that’s out there. So a major structural supply deficit that’s forming will continue to eat away inventories and secondary supply. My sense of the market right now is you’ll probably see that coming to an end and we’ll start to see those supply cuts have a major impact on the spot price, and the contract price going forward.
Maurice Jackson: Let’s let that sink in for a moment. There’s an approximately 55 million pound supply deficit in the uranium sector for reactor requirements. That’s quite significant. Let’s see how this may increase the price of uranium and equally, if not more, reward the shareholders of Skyharbour.
Sir, last month we had the pleasure of having you on the program in which you noted some near-term catalysts that have your attention that may propel the price of uranium before the year end. Looks like the price movements you referenced may be coming to fruition as the price of uranium is up about 75 cents since we last spoke. What are the near-term catalysts and can you provide us with some updates since we last spoke?
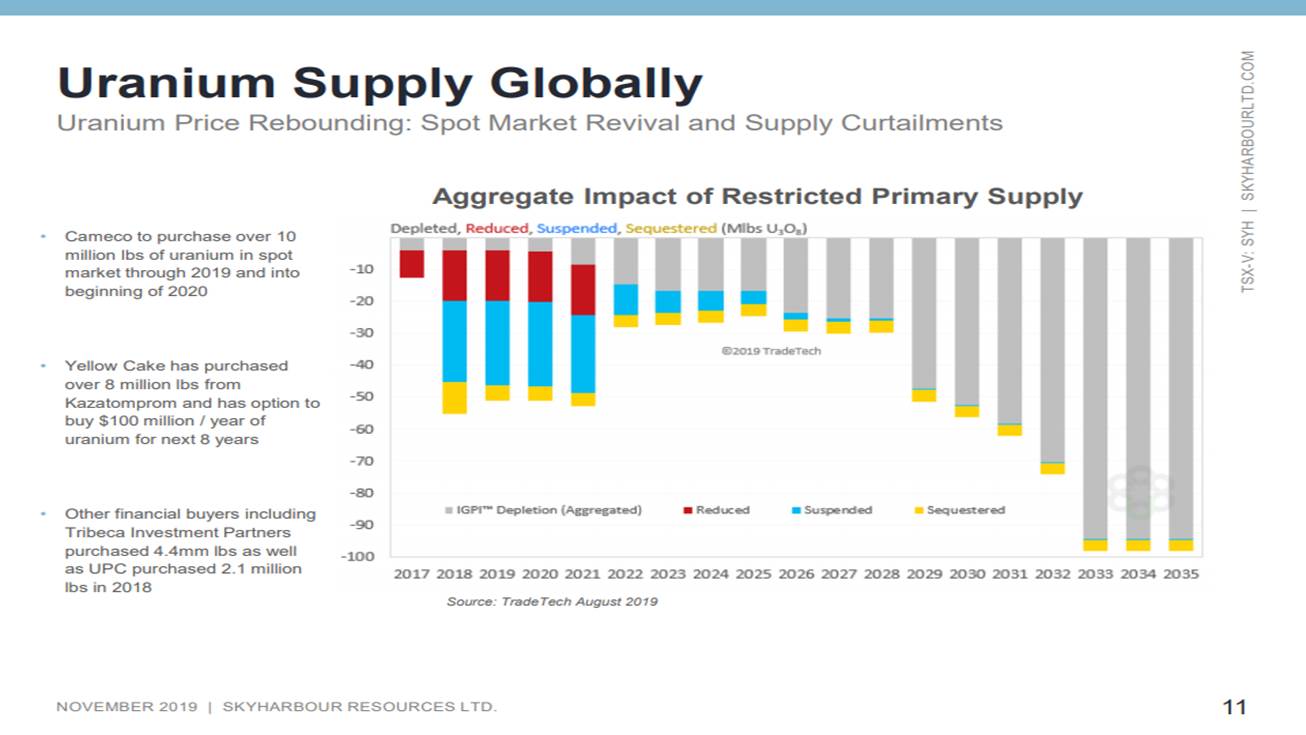
Jordan Trimble: We are seeing the price move. There’s a handful of catalysts. We’ve touched on a few of them in the last interview, but just to reiterate some of the main drivers right now. One, seasonality. Seasonality in this sector with the price of the commodity and typically with the share prices as well. We see November through February and March as relatively strong months. Usually there’s outperformance. We’ve seen that just start to pick up in the last few weeks. It really started with Cameco’s quarterlies a few weeks back that the market liked and there was some notable positive commentary from Cameco, which is surprising given that the market commentary from them hasn’t been as upbeat over the last several years. So seasonality is one and we’ll see that continue I think into the new year. Two, getting back to Cameco and we talked about this in the last interview (Click Here). Cameco, having shut down the world’s largest uranium mine at McArthur River, has to source millions of pounds of material to fulfill its contracts and its deliveries.
Therefore, we know that in the next several months there’s still a fair bit of material and uranium that Cameco has to acquire. If it can’t source that from secondary supply sources, it will be in the spot market buying. It looks like they are coming in some estimates of upwards of 8 million pounds. Just to put some perspective on that, that amount of uranium that they bought in mid to late 2018 helped drive the uranium price up into the high $20s and we saw all the share prices respond positively hitting 52-week highs. Cameco spot market purchasing will continue into the new year. That’s a big driver. Another one too and more recently has been an increase in the price of conversion and enrichment. And so these prices have been increasing. The fuel cycle has been tightening. That’s usually a good leading indicator. We’ve seen that here over the last year in particular.
Then last but not least, and this actually just come out here in the last few days. There was the non-renewal of key sanction waivers on Iran and on some of its conversion enrichment facilities. That has been recently announced in the U.S. and that also tightened up the market because the implications of that could affect companies in Europe, in China, and in Russia that deal with Iran and deal with Iran’s nuclear program, but also deal with the U.S. and sell uranium and products to the U.S.. What we’re seeing right now across the board is a tightening of the market and this is all positive for the spot price and ultimately the contract price going forward for uranium. As we see the price of the commodity move up, we will see that the share prices move up as well.
Maurice Jackson: Now germane to the spot price, can you provide us with the current contract price for uranium?
Jordan Trimble: The contract price is still hovering in the low $30s, and just to note on the spot versus the contract price. Historically most uranium is traded and bought and sold through long-term contracts. So that’s important to note. We have seen more recently, in particular in 2018, a lot of volume transacted on the spot market. That’s a good indicator in itself. The market’s cleaning up, but it’s important to note, and this is relevant in the U.S. where we’ve had this ongoing Section 232 and subsequent investigation and then the subsequent nuclear fuel working group, which we’re still waiting to hear back on really any day now.
As a result of that, we’ve seen really the largest buyer of uranium globally in U.S. nuclear utilities more or less forced to the sideline. There hasn’t been a whole lot of contracting as a result of that. Utilities are looking to get some clarity on where they have to be buying or not buying from. So you know when that’s finally put to bed over the coming weeks here, I think that that will clear the air, especially for U.S. nuclear utilities to step back into the market. When we’re looking at the contract versus the spot price, the spot price, yes, it’s been ticking up but we’re still in the mid-$20s. It’s still relatively low. So I think there’s a chance you see utilities come back and buy initially in the spot market and then ultimately we’ll see the market go back to more contracting and you’ll see the contract price pick up as well.
Maurice Jackson: Having a 55-million pound deficit to meet reactor requirements in and of itself may be a very rewarding proposition for shareholders in the future, but when one factors in the strategic moves that Skyharbour Resources will be making in their property bank, the story gets even more compelling. Speaking of Moore, sir, the company has a dual prong business model and the first being an exploration company. Take us to your flagship Moore Lake project, which is known for its rich, high-grade uranium and provide shareholders with an update there and the projected news flow that may be anticipated.
Jordan Trimble: I mentioned earlier and just to re-highlight some of the key upcoming catalysts. The big one is a drill program that we have planned early in the new year, 2,500 meters at our flagship Moore project. In our previous drill program earlier this year, we tested what’s called the basement rocks. This is the same geological setting where you’ve had recent major discoveries like NextGen, like Fission, like the Gryphon deposit at Denison’s Wheeler project. More recent exploration has been focused in these underlying basement rocks and that’s where you get the source rock in the feeder zones for high-grade uranium mineralization. So we really just scratched the surface down there. We know we have high grade up to 21% U308 in the sandstone, but there hasn’t been much drilling underneath in the basement rock. Now we did drill a few holes in our last program and our best drill hole, which was one of our last drill holes, we hit multi-percent uranium mineralization over about 2.5 meters.
That’s the hole that we’re going to go back and follow up on. We’ve done some more geophysics, which we did over the last few months. We’ve gotten some new geological modeling. So we’ve refined the targets in the basement rocks and in particular following up on that high-grade intersection in one of the last holes from the last program. We think there’s a much larger structure and zone of mineralization just a little bit deeper down. We’re going to be drill testing that. It’s also opened a lock strike. This is the main Maverick quarters, about 4 kilometers long, only about half of that’s been systematically drill tested. So we’re going to have some drill holes that that we spot along strike and last but not least a couple holes, small amount within that program that’s going to be testing a new target that we made a new discovery on earlier in the year called the Otter Grid.
So there’ll be a couple shallow holes there, but the main focus is going to be continuing to follow up on high-grade basement hosted uranium mineralization. We really believe that we’re right on the cusp of finding something much larger in these basement rocks and feeder zones. That will be a key catalyst for us. Really one hole makes a big difference for a company of our size. We also have, as mentioned, partner companies Orano and Azincourt that are planning exploration and drill programs early in the new year as well that they’re funding. Collectively you have, as I mentioned earlier, three programs that will be underway. Just under $3 million planned in exploration, the bulk of that funded by partner companies. A lot of news flow coming up over the next six months.
Maurice Jackson: Switching gears. I’d like to take a moment to remind our audience when you have a compelling thesis and a low share price, that’s called a sale. The goal for any investor and speculator should be to buy low and sell high. Jordan, please share the current price of Skyharbour Resources.
Jordan Trimble: We are trading around 16 cents Canadian. We talked about it in the last interview; we’ve had some pressure over the course of the year. A big part of that is this Section 232 non-decision where we saw a lot of money flow out of the uranium space. It hit us in our peer group and we also have some tax loss selling. I’ve been very active buying in the market. I bought shares as recent as today. I think at these prices and I call it a $10, $11 million Canadian market cap. I see there being a lot of upside from here and putting my money where my mouth is. So it’s definitely worth taking a look at it. Again, I think the value proposition given the catalysts we have coming up, given the uranium market in particular in the near term, I think the value proposition is as strong as it’s ever been.
Maurice Jackson: In closing, sir, what keeps you up at night that we don’t know about?
Jordan Trimble: We are an exploration company so you are going and you’re looking to make new discoveries and there’s no guarantee of success. I will say that we’ve done a lot of work in the last five and a half, six months refining these basement hosted targets. If we have as good of a shot as we’re ever going to have, it’s going to be in this drill program and that’s just one of again, three programs that are going to be underway come the new year.
Maurice Jackson: Mr. Trimble, last question. What did I forget to ask?
Jordan Trimble: I think that covers it all. It’s definitely worth people taking a look at, especially if these prices and given what we have coming up.
Maurice Jackson: Well, I want to share in reference to the prices. We will be active buyers of Skyharbour Resources as well during this time period as we love the value proposition and the strategic moves that the company is making. Mr. Trimble, for someone listening that wants to get more information about Skyharbour Resources, please share the website address.
Before you make your next Precious Metals purchase, call me. I’m a licensed representative for Miles Franklin Precious Metals Investments where we offer a number of options to expand your precious metals portfolio from physical delivery, offshore depositories, precious metal IRAs, and private blockchain distributed ledger technology. Call me directly at 855-505-1900 or you may email [email protected]. Finally, please subscribe to Provenandprobable.com for Mining Insights and Bullion Sales.
Jordan Trimble of Skyharbour Resources, thank you for joining us today on Proven and Probable.
Maurice Jackson is the founder of Proven and Probable, a site that aims to enrich its subscribers through education in precious metals and junior mining companies that will enrich the world.
Disclosure: 1) Maurice Jackson: I, or members of my immediate household or family, own shares of the following companies mentioned in this article: Skyharbour Resources. I personally am, or members of my immediate household or family are, paid by the following companies mentioned in this article: None. My company has a financial relationship with the following companies mentioned in this article: Skyharbour Rresources is a sponsor of Proven and Probable. Proven and Probable disclosures are listed below. 2) The following companies mentioned in this article are billboard sponsors of Streetwise Reports: Skyharbour Resources. Click here for important disclosures about sponsor fees. 3) Statements and opinions expressed are the opinions of the author and not of Streetwise Reports or its officers. The author is wholly responsible for the validity of the statements. The author was not paid by Streetwise Reports for this article. Streetwise Reports was not paid by the author to publish or syndicate this article. The information provided above is for informational purposes only and is not a recommendation to buy or sell any security. Streetwise Reports requires contributing authors to disclose any shareholdings in, or economic relationships with, companies that they write about. Streetwise Reports relies upon the authors to accurately provide this information and Streetwise Reports has no means of verifying its accuracy. 4) This article does not constitute investment advice. Each reader is encouraged to consult with his or her individual financial professional and any action a reader takes as a result of information presented here is his or her own responsibility. By opening this page, each reader accepts and agrees to Streetwise Reports’ terms of use and full legal disclaimer. This article is not a solicitation for investment. Streetwise Reports does not render general or specific investment advice and the information on Streetwise Reports should not be considered a recommendation to buy or sell any security. Streetwise Reports does not endorse or recommend the business, products, services or securities of any company mentioned on Streetwise Reports. 5) From time to time, Streetwise Reports LLC and its directors, officers, employees or members of their families, as well as persons interviewed for articles and interviews on the site, may have a long or short position in securities mentioned. Directors, officers, employees or members of their immediate families are prohibited from making purchases and/or sales of those securities in the open market or otherwise from the time of the interview or the decision to write an article until three business days after the publication of the interview or article. The foregoing prohibition does not apply to articles that in substance only restate previously published company releases. As of the date of this article, officers and/or employees of Streetwise Reports LLC (including members of their household) own securities of Skyharbour Resources, a company mentioned in this article.
Proven and Probable LLC receives financial compensation from its sponsors. The compensation is used is to fund both sponsor-specific activities and general report activities, website, and general and administrative costs. Sponsor-specific activities may include aggregating content and publishing that content on the Proven and Probable website, creating and maintaining company landing pages, interviewing key management, posting a banner/billboard, and/or issuing press releases. The fees also cover the costs for Proven and Probable to publish sector-specific information on our site, and also to create content by interviewing experts in the sector. Monthly sponsorship fees range from $1,000 to $4,000 per month. Proven and Probable LLC does accept stock for payment of sponsorship fees. Sponsor pages may be considered advertising for the purposes of 18 U.S.C. 1734.
The Information presented in Proven and Probable is provided for educational and informational purposes only, without any express or implied warranty of any kind, including warranties of accuracy, completeness, or fitness for any particular purpose. The Information contained in or provided from or through this forum is not intended to be and does not constitute financial advice, investment advice, trading advice or any other advice. The Information on this forum and provided from or through this forum is general in nature and is not specific to you the User or anyone else. You should not make any decision, financial, investments, trading or otherwise, based on any of the information presented on this forum without undertaking independent due diligence and consultation with a professional broker or competent financial advisor. You understand that you are using any and all Information available on or through this forum at your own risk.
Two of our favorite charts for following the US markets are suggesting the markets are range bound headed into the end of 2019. The news may continue to push the price higher as the overall bias has continued to be to the upside. Yet, our Fibonacci predictive modeling system is suggesting the current price trend has begun a “scouting party” type of move which may end in a moderate price correction fairly quickly.
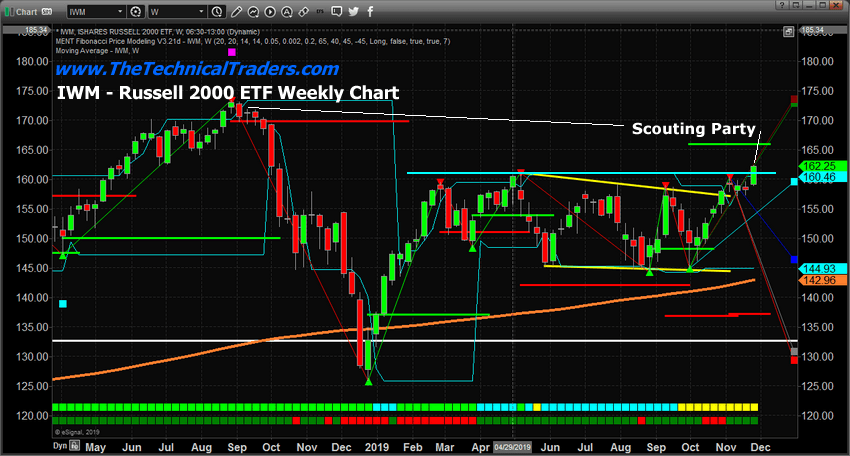
IWM Russell 2K Stock Index Chart
Our Adaptive Fibonacci price modeling system is capable of learning from past price activity and attempts to present key price data and trigger levels that are important for future trending. The GREEN and RED horizontal lines on the right edge of this chart shows where the TRIGGER LEVELS are for the Fibonacci system. The bullish trigger level (GREEN) is 2.5% above the current price levels. The bearish trigger level (RED) is nearly 16% below the current price level. This suggests that price would have to target either of these levels to establish a new price trend, or continue rotating within these levels to setup new minor peaks and valleys in the price – thus creating revised TRIGGER LEVELS. Get my updates by joining my free trend signals email list.
What we find interesting is the current “scouting party” type of rally that is taking place on the right edge of this chart. This upside price move is above historical resistance (the CYAN LINE) and appears to be an attempt to test the support levels above the $160.50 level.
If the price is successful in establishing support above this level, a new bullish trend may begin. If not, the price will rotate lower and potentially begin a new bearish price trend. Remember, the downside Bearish Trigger level is 16% below the current price – so that the downside move could be quite dramatic.
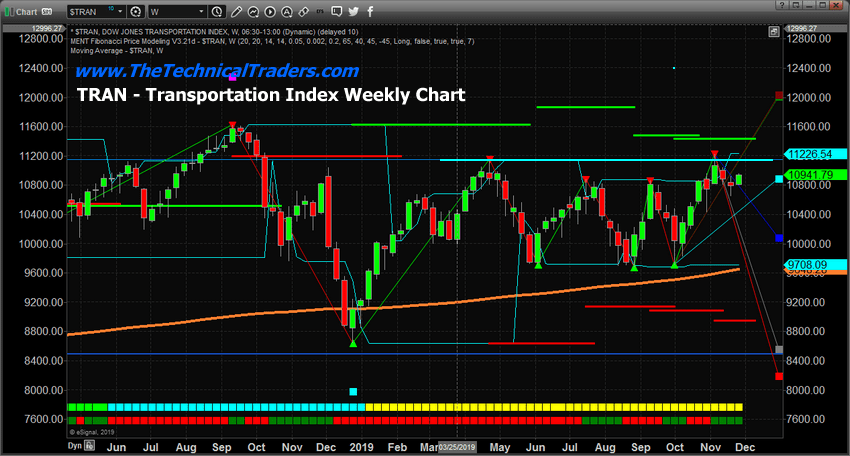
Transportation Index Weekly Chart
This TRAN Weekly chart highlights a similar range-bound price setup where the bullish and bearish Fibonacci TRIGGER LEVELS are well above/below the current price. The upside Bullish Trigger Level is 4.15% above the current TRAN price level – thus price would have to rally at least 4.5% higher to qualify as a breach of this Bullish Trigger Level and qualify as a potential new bullish trend. The Bearish Trigger Level is near 18.4% below the current price level – thus the price would have to fall 18.5% from current levels to breach this Bearish Trigger Level and to qualify as a new Bearish Trend.
Where does this leave us headed into the end of 2019? Our researchers believe the Santa Rally that most traders expect maybe more like a lump of coal in 2019. We don’t expect any big breakout rally to happen over the next 35+ days and we don’t expect a massive 40% price correction either. Our Fibonacci price modeling system is suggesting that any rotation within this 20% price range would be considered “absolutely normal” given the ranges that have been set up over the past 2+ years.
Last week we share these charts on the VIX that paint a clear picture of what is likely to unfold in the next week. This current week is one of the strongest months of the year so
Therefore, the downside price move of 6 to 12% would be completely normal. And the upside move of 2~3% from current levels would be completely normal. Any price rotation within the GREEN/RED Fibonacci triggers levels would be considered “normal price rotation” given the established price ranges, peaks and valleys.
We’ve been saying for months, 2019 and 2020 are certainly going to be interesting years for traders. We believe any price rotation or breakout could lead to a wide range of price rotation that may shock skilled technical traders. At this point, a 22%+ “normal” price range has setup in the markets. Prices could rotate within this range and “not really go anywhere” in technical terms.
I want to wish everyone a Happy Thanksgiving and if you find this type of analysis interesting be sure to visit my website and sign up to get both my swing trade and investing ETF trade signals at 41% discount, plus a free bar of silver or gold with my Black Friday Offer Today! Visit: www.TheTechnicalTraders.com
Shares of Intercept Pharmaceuticals rose today after the company reported that the U.S. Food and Drug Administration accepted its NDA for obeticholic acid (OCA) for the treatment of liver fibrosis due to NASH and granted priority review status.
This morning biopharmaceutical company Intercept Pharmaceuticals Inc. (ICPT:NASDAQ), which is engaged in the development and commercialization of novel therapeutics to treat progressive non-viral liver diseases, announced that “the U.S. Food and Drug Administration (FDA) has accepted the company’s New Drug Application (NDA) for obeticholic acid (OCA) seeking accelerated approval for the treatment of fibrosis due to nonalcoholic steatohepatitis (NASH) and granted priority review.”
The company advised in the report that the FDA assigned a Prescription Drug User Fee Act (PDUFA) target action date of March 26, 2020, for the NDA. The firm noted that the NDA is supported by positive interim analysis results from the company’s Phase 3 REGENERATE study demonstrating OCA’s improvement of liver fibrosis without worsening of NASH, and that “the FDA grants priority review to drugs that have the potential to treat a serious condition and, if approved, would provide a significant improvement in safety or effectiveness.” The company indicated that the REGENERATE Study is a Phase 3, randomized study of obeticholic acid (OCA) on more than 2,400 adult NASH patients worldwide.
Intercept’s President and CEO Mark Pruzanski, M.D., commented, “If approved, OCA would be the first available therapy for patients with fibrosis due to NASH, a condition that is expected to become the leading cause of liver transplant in the U.S. as soon as 2020…It is exciting to achieve this critical regulatory milestone that brings us one step closer to our goal of delivering the first approved therapeutic to those living with this devastating disease. From OCA’s prior designation as a Breakthrough Therapy to the grant of priority review today, our work with FDA continues to set an important precedent for the field, and we look forward to working with the agency over the coming months as they review the first NDA in NASH.”
The firm explains in the report that “nonalcoholic steatohepatitis (NASH) is a serious progressive liver disease caused by excessive fat accumulation in the liver that induces chronic inflammation, resulting in progressive fibrosis (scarring) that can lead to cirrhosis, eventual liver failure, cancer and death.”
Intercept states that “OCA is the only investigational therapy to have received Breakthrough Therapy designation from the FDA for NASH with fibrosis, and that the NDA filing for OCA is supported by positive interim analysis results from the pivotal Phase 3 REGENERATE study in patients with liver fibrosis due to NASH.”
Intercept Pharmaceuticalsis a biopharmaceutical company headquartered in New York, NY. The firm operates in the U.S., Canada and Europe and is focused on the development and commercialization of therapeutics to treat non-viral, progressive liver diseases. These disease include primary biliary cholangitis (PBC) and nonalcoholic steatohepatitis (NASH).
Intercept has a market capitalization of approximately $2.9 billion with about 32.73 million shares outstanding along with a short interest of around 17.2%. ICPT shares opened today at $93.50 (+4.61, +5.19%) over Friday’s closing price of $88.89. The stock has traded today between $93.11 to $100.00 per share and is currently trading at $96.00 (+$7.11, 8.00%).
Disclosure: 1) Stephen Hytha compiled this article for Streetwise Reports LLC and provides services to Streetwise Reports as an independent contractor. He or members of his household own securities of the following companies mentioned in the article: None. He or members of his household are paid by the following companies mentioned in this article: None. 2) The following companies mentioned in this article are billboard sponsors of Streetwise Reports: None. Click here for important disclosures about sponsor fees. 3) Comments and opinions expressed are those of the specific experts and not of Streetwise Reports or its officers. The information provided above is for informational purposes only and is not a recommendation to buy or sell any security. 4) The article does not constitute investment advice. Each reader is encouraged to consult with his or her individual financial professional and any action a reader takes as a result of information presented here is his or her own responsibility. By opening this page, each reader accepts and agrees to Streetwise Reports’ terms of use and full legal disclaimer. This article is not a solicitation for investment. Streetwise Reports does not render general or specific investment advice and the information on Streetwise Reports should not be considered a recommendation to buy or sell any security. Streetwise Reports does not endorse or recommend the business, products, services or securities of any company mentioned on Streetwise Reports. 5) From time to time, Streetwise Reports LLC and its directors, officers, employees or members of their families, as well as persons interviewed for articles and interviews on the site, may have a long or short position in securities mentioned. Directors, officers, employees or members of their immediate families are prohibited from making purchases and/or sales of those securities in the open market or otherwise from the time of the interview or the decision to write an article until three business days after the publication of the interview or article. The foregoing prohibition does not apply to articles that in substance only restate previously published company releases. 6) This article does not constitute medical advice. Officers, employees and contributors to Streetwise Reports are not licensed medical professionals. Readers should always contact their healthcare professionals for medical advice.
Bob Moriarty of 321gold explains why he sees the stock of this gold explorer as a buy right now.
Investors spend a lot of time pondering both Technical Analysis and fundamentals to determine entry and exit points for investing. Perhaps they would make more money studying human behavior. Investing is not as difficult as the Gurus and Experts try to make it; it is no more complex than buying cheap and selling dear.
Every year human behavior gives us a month long sales event where investors dump shares just like the after Christmas sales rack at Macy’s. It has to do with selling shares that have gone down and taking the tax loss rather than sitting on long term losses. In other words, it has to do with the tax laws and has nothing at all to do with either TA or fundamentals.
If you understand human behavior you can make a lot of money as a result. In general investors want to buy what has gone up and sell what has gone down. When Tax Loss Silly Season starts to kick in November investors start unloading those shares that have gone down for the year to write off those losses. Once that starts, the herd instinct kicks in with the rest of the sheep and they keep selling into mid-December.
So if a wise investor looks at a number of charts of otherwise good companies they will soon find some suitable candidates. Obviously it helps if the overall resource sector is in a bull market. We know that gold bottomed in late 2015 early 2016. Indeed, in the past year gold is up 20% so in theory gold resource shares should have a tailwind.
You want to find shares hitting new lows and be putting in stink bids in order to capture those shares being tossed into the bargain bin.
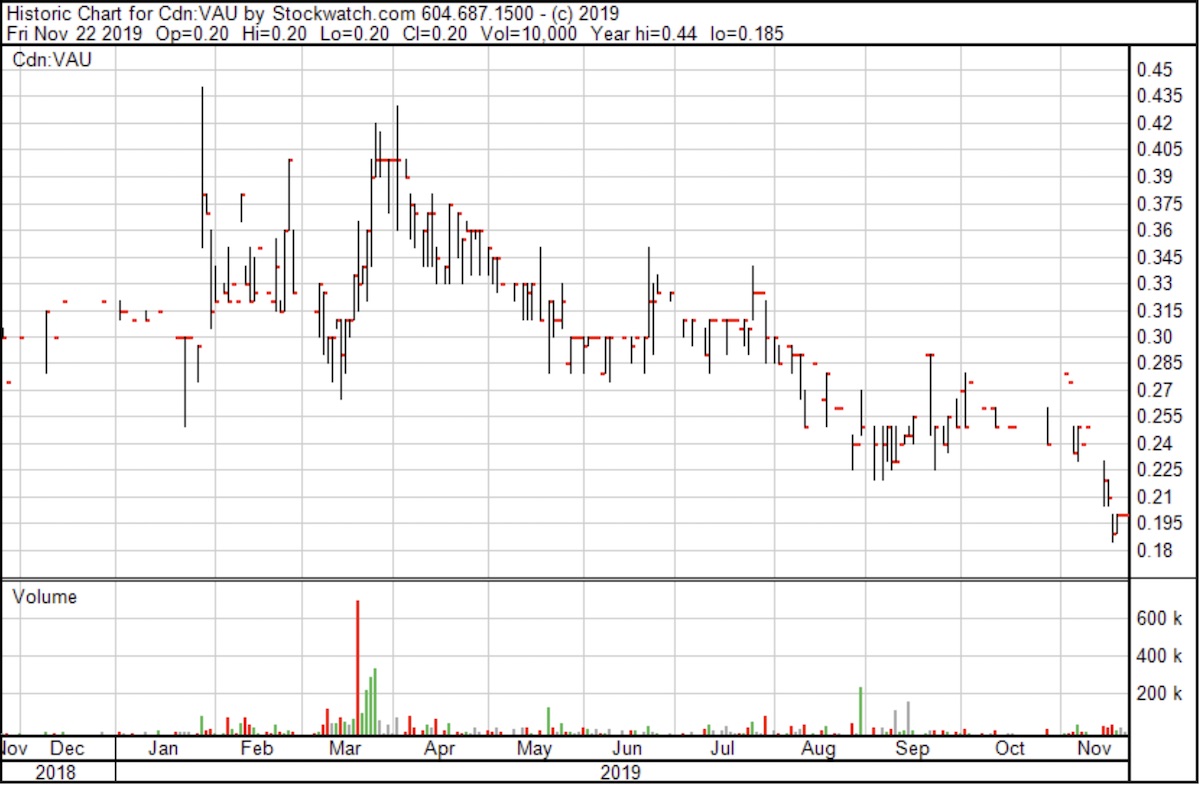
Viva shares were as high as $0.44 a share in January (that being after the 2018 Tax Loss Silly Season) and have meandered as high as $0.40 and averaging about $0.30 until early November when TLSS kicked in. In the next three weeks, Viva shares plummeted some 33% even though nothing at all changed with the company to a new low of $0.19 late last week.
This project has had over $20 million done on it by Viva and the prior owner, Midway. But at today’s price, the total market cap is less than $5 million and investors are getting reasonable grade, good location gold for about $10 USD an ounce. That’s pretty hard to beat. The company is moving forward and just announced plans for a PEA as soon as results come in from the 2019 drill program and column test work.
The company did exactly the same thing last year with the price fading into November and then almost doubling in late January from the November 2017 lows. It could easily do the same this year.
Investors like to believe they are buying into some combination of the fundaments and technical analysis of a particular company. In reality they are not. If you are to profit, you need to focus on the stupidity of other investors. If they want to dump good stocks in November and December, let them. Put in your stink bids, pluck the shares from the weak hands and book your 50% profit in January/February
I own shares bought in the open market and I have participated in their last private placement. Viva Gold is an advertiser and that means I am biased. Do your own due diligence.
Bob and Barb Moriarty brought 321gold.com to the Internet almost 16 years ago. They later added 321energy.com to cover oil, natural gas, gasoline, coal, solar, wind and nuclear energy. Both sites feature articles, editorial opinions, pricing figures and updates on current events affecting both sectors. Previously, Moriarty was a Marine F-4B and O-1 pilot with more than 832 missions in Vietnam. He holds 14 international aviation records.
Disclosure: 1) Bob Moriarty: I, or members of my immediate household or family, own shares of the following companies mentioned in this article: Viva Gold. My company has a financial relationship with the following companies mentioned in this article: Viva Gold is an advertiser on 321 Gold. I determined which companies would be included in this article based on my research and understanding of the sector. 2) The following companies mentioned are billboard sponsors of Streetwise Reports: None. Click here for important disclosures about sponsor fees. 3) Statements and opinions expressed are the opinions of the author and not of Streetwise Reports or its officers. The author is wholly responsible for the validity of the statements. The author was not paid by Streetwise Reports for this article. Streetwise Reports was not paid by the author to publish or syndicate this article. The information provided above is for informational purposes only and is not a recommendation to buy or sell any security. Streetwise Reports requires contributing authors to disclose any shareholdings in, or economic relationships with, companies that they write about. Streetwise Reports relies upon the authors to accurately provide this information and Streetwise Reports has no means of verifying its accuracy. 4) The article does not constitute investment advice. Each reader is encouraged to consult with his or her individual financial professional and any action a reader takes as a result of information presented here is his or her own responsibility. By opening this page, each reader accepts and agrees to Streetwise Reports’ terms of use and full legal disclaimer. This article is not a solicitation for investment. Streetwise Reports does not render general or specific investment advice and the information on Streetwise Reports should not be considered a recommendation to buy or sell any security. Streetwise Reports does not endorse or recommend the business, products, services or securities of any company mentioned on Streetwise Reports. 5) From time to time, Streetwise Reports LLC and its directors, officers, employees or members of their families, as well as persons interviewed for articles and interviews on the site, may have a long or short position in securities mentioned. Directors, officers, employees or members of their immediate families are prohibited from making purchases and/or sales of those securities in the open market or otherwise from the time of the interview or the decision to write an article until three business days after the publication of the interview or article. The foregoing prohibition does not apply to articles that in substance only restate previously published company releases.
Technical analyst Clive Maund details the fundamentals for this oil & gas firm and explains why he sees it as a strong speculative buy.
After a prolonged period of adversity and depression it looks like Amazing Energy Oil & Gas Co. (AMAZ:OTCQX) has at last “cleaned the clock” with respect to the obstacles that have been blocking its way until recently. In the first place, it has sorted out the problematic situation with the Miesners. As published on the 13th in the company’s 10K
“In November 2019, the company came to terms on a proposed agreement with Jed and Lesa Miesner (the “Miesners”), and their affiliated companies JLM Strategic Investments, LP (“JLM”), Petro Pro, Ltd. (“PPL”), US Petro, LLC (“US Petro”). Pursuant to the agreement, the Company will pay the total sum of $1,750,000 to the Miesners and/or their affiliated entities.
“The proposed agreement provides that the Company will acquire all right, title and interest in and to three notes and mortgages/deeds of trust, with a value of approximately $4,200,000 held by the Miesners, JLM, and PPL, respectively. Furthermore, the parties have agreed that the Miesners, and their related affiliates, will surrender all of the shares of the Company’s common stock held by them, forgo any claims to all options to acquire shares of the Companys common stock, all warrants to purchase the Company’s common stock, and any claims for compensation and wrongful termination pursuant to Jed Miesner’s former employment agreement with the Company, as well as a release of any and all other claims the Miesners, and/or any of their affiliated companies, may have against the Company and/or any of its subsidiaries. In exchange, the Company will forgo any claims it may have against Jed Miesner pursuant to his former employment agreement with the Company and any other additional claims the Company, and/or any of its subsidiaries, may have against the Miesners and/or any of their affiliated companies. As a part of the proposed agreement, Jed Miesner will also resign from the Companys board of directors.”
Next it has just announced that it has closed a substantial US$4,500,000 financing and also that it has acquired assets in Mississippi known as the Denver Mint Project.
So, with the these major steps behind it and significant obstacles removed, the company looks better placed to advance towards its goals, which means that the stock is now much more likely to advance. That makes it interesting to us, for as we will now see on the charts, it is exceedingly cheap here and in a very good position to begin a major new bull market.
Well start with the very long-term chart to gain an overall perspective and quickly “drill down” to recent charts to get a handle on whats going on with this stock.
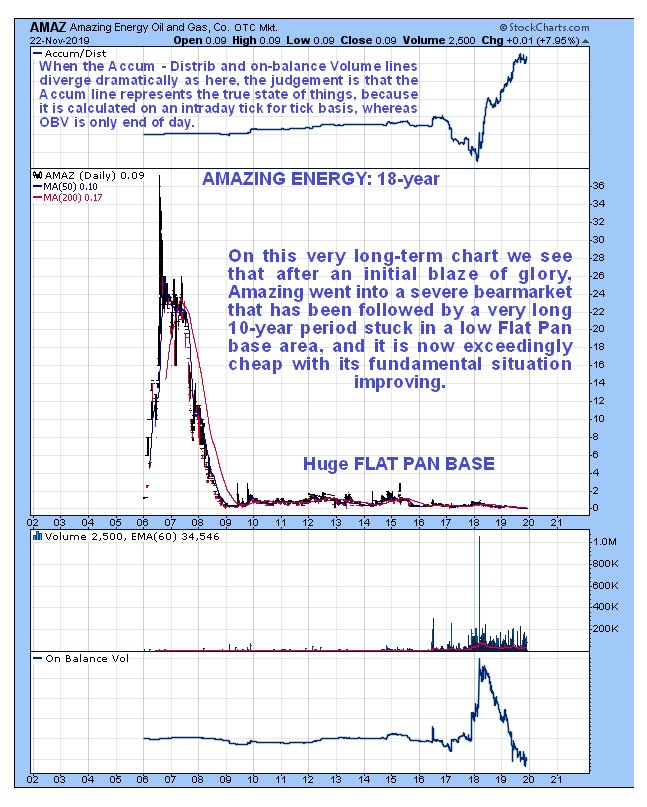
On the very long-term 18-year chart, we can see that, after an initial blaze of glory in 2006, the stock came crashing right back down in a severe bear market to almost zero by the end of 2008, after which it has trundled sideways for over 10 years within a gigantic Flat Pan base.
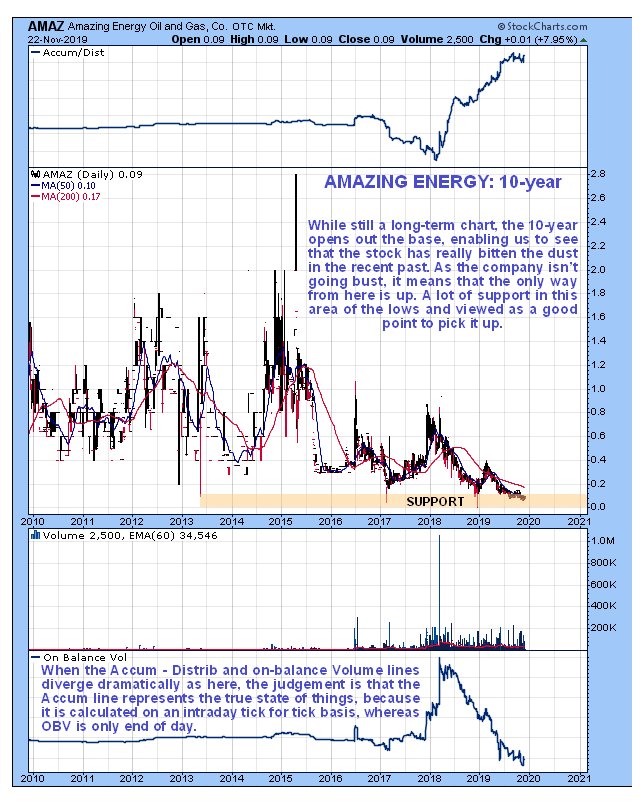
Because the 10-year chart does not include the early spike, it opens out the base pattern and on it we can see that after the recent decline, Amazing is at quite strong support right at the bottom of the trading range that comprises the Flat Pan base. The Accumulation line has been persistently strong for a long time, and it takes precedence over the weak On-balance Volume line as a reliable indicator, because it is calculated on an intraday tick for tick basis, whereas On-balance Volume is only end of day. It suggests that new bull market is incubating. What this chart makes dramatically clear is that this stock is remarkably cheap hereyou can buy bucketloads of it for almost nothing, and it only has to go up to 20 cents, a modest objective, and you will doubled your money.
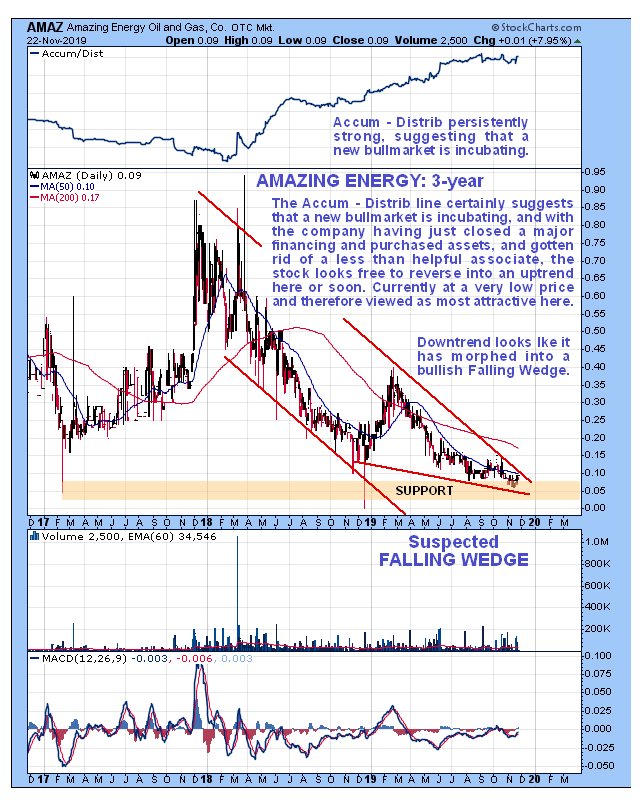
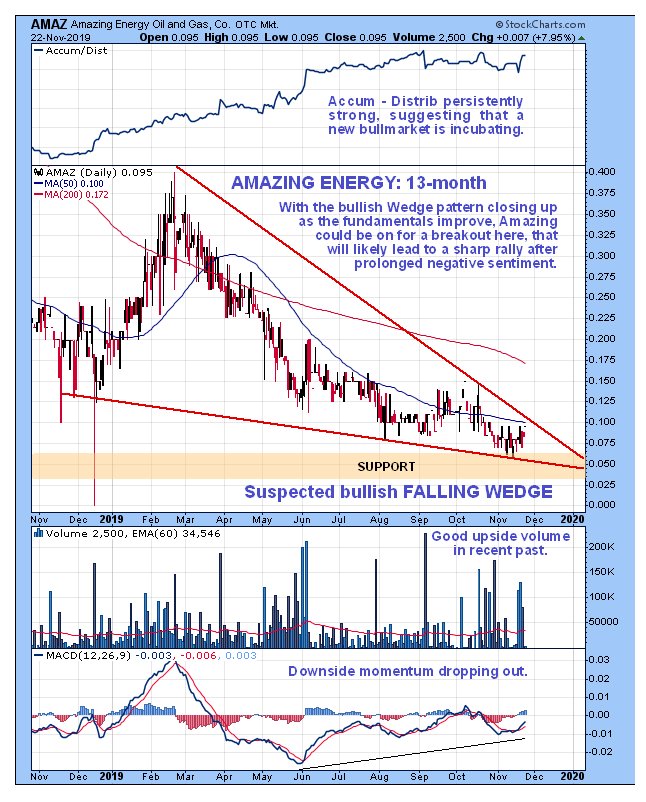
The 3-year chart is also interesting because it shows that the downtrend in force from late 2017 has this year morphed into a bullish Falling Wedge, and with the Wedge rapidly closing up at support as the fundamentals improve significantly, a breakout into a new bull market looks set to occur soon, and given how persistently negative sentiment towards this stock has been in the recent past, we could even see a spike after it does break out.
On the latest 13-month chart we can see upside volume improving in the recent past as downside momentum (MACD) drops out.
Amazing Energy therefore looks like an immediate strong speculative buy here.
Disclosure: 1) Clive Maund: I, or members of my immediate household or family, own shares of the following companies mentioned in this article: None. I personally am, or members of my immediate household or family are, paid by the following companies mentioned in this article: None. My company has a financial relationship with the following companies mentioned in this article: None. CliveMaund.com disclosures below. I determined which companies would be included in this article based on my research and understanding of the sector. 2) The following companies mentioned in this article are billboard sponsors of Streetwise Reports: None. Click here for important disclosures about sponsor fees. 3) Statements and opinions expressed are the opinions of the author and not of Streetwise Reports or its officers. The author is wholly responsible for the validity of the statements. The author was not paid by Streetwise Reports for this article. Streetwise Reports was not paid by the author to publish or syndicate this article. The information provided above is for informational purposes only and is not a recommendation to buy or sell any security. Streetwise Reports requires contributing authors to disclose any shareholdings in, or economic relationships with, companies that they write about. Streetwise Reports relies upon the authors to accurately provide this information and Streetwise Reports has no means of verifying its accuracy. 4) This article does not constitute investment advice. Each reader is encouraged to consult with his or her individual financial professional and any action a reader takes as a result of information presented here is his or her own responsibility. By opening this page, each reader accepts and agrees to Streetwise Reports’ terms of use and full legal disclaimer. This article is not a solicitation for investment. Streetwise Reports does not render general or specific investment advice and the information on Streetwise Reports should not be considered a recommendation to buy or sell any security. Streetwise Reports does not endorse or recommend the business, products, services or securities of any company mentioned on Streetwise Reports. 5) From time to time, Streetwise Reports LLC and its directors, officers, employees or members of their families, as well as persons interviewed for articles and interviews on the site, may have a long or short position in securities mentioned. Directors, officers, employees or members of their immediate families are prohibited from making purchases and/or sales of those securities in the open market or otherwise from the time of the interview or the decision to write an article until three business days after the publication of the interview or article. The foregoing prohibition does not apply to articles that in substance only restate previously published company releases. As of the date of this article, officers and/or employees of Streetwise Reports LLC (including members of their household) own securities of Amazing Energy, a company mentioned in this article.
Charts provided by the author.
CliveMaund.com Disclosure: The above represents the opinion and analysis of Mr Maund, based on data available to him, at the time of writing. Mr. Maund’s opinions are his own, and are not a recommendation or an offer to buy or sell securities. Mr. Maund is an independent analyst who receives no compensation of any kind from any groups, individuals or corporations mentioned in his reports. As trading and investing in any financial markets may involve serious risk of loss, Mr. Maund recommends that you consult with a qualified investment advisor, one licensed by appropriate regulatory agencies in your legal jurisdiction and do your own due diligence and research when making any kind of a transaction with financial ramifications. Although a qualified and experienced stock market analyst, Clive Maund is not a Registered Securities Advisor. Therefore Mr. Maund’s opinions on the market and stocks can only be construed as a solicitation to buy and sell securities when they are subject to the prior approval and endorsement of a Registered Securities Advisor operating in accordance with the appropriate regulations in your area of jurisdiction.