Primary Silver Producer’s Most Profitable Mine Closed Indefinitely

By Money Metals News Service

Endeavour Silver’s most profitable mine will be shut down indefinitely by the end of November due to the exhaustion of mineral reserves. All employees will be laid off, and the mine will be put on care and maintenance. The El Cubo Mine will continue milling operations for a week in December to process the remaining stockpiles of ore.

This is quite a shame because El Cubo Mine was Endeavour Silver’s most profitable primary silver mine, or so they say. According to the company’s recent November Investor Presentation, El Cubo Mine has been operated continuously for the past 165 years:

El Cuba Investor Presentation

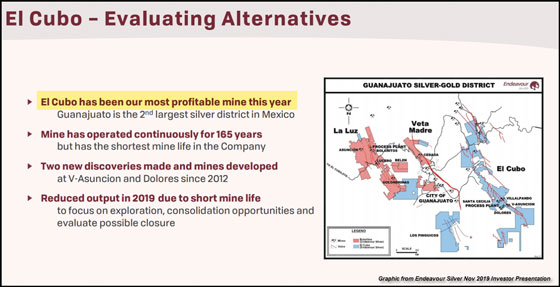
Management knew the mine was running out of reserves but tried to continue exploration activities over the past few years to find new profitable ore bodies. Unfortunately, the company failed to locate sufficient new reserves to continue operations so that the mine will be shut down indefinitely. As of the last Q3 2019 report, El Cubo Mine employed 350 people and 200 contractors.

Endeavour Silver plans to relocate some of the mining and milling equipment from the El Cubo Mine to other operations to reduce the company’s capital costs:

Following suspension of the operations, Company and contract personnel will continue to maintain the security of the mine, plant and tailings facilities until final closure is completed. Management will evaluate alternatives for the plant and related facilities including moving certain components to development projects such as Terronera and Parral to reduce their future capital costs. The mining equipment will be relocated to Endeavour’s other operating mines, particularly Bolanitos, to help facilitate increasing the mine output to fill the plants to their capacities.

Endeavour Silver acquired the El Cubo Mine in 2012, and it has been producing the lion’s share of the company’s silver supply for the past several years. Furthermore, the El Cubo Mine produced silver at an average yield of 4.7 oz per ton in 2019. Here is the production data for Endeavour Silver’s three mines:

Total Silver Production 2015-2018:

El Cubo Mine = 8.8 million oz

Guanacevi Mine = 7.7 million oz

Bolanitos Mine = 4.4 million oz

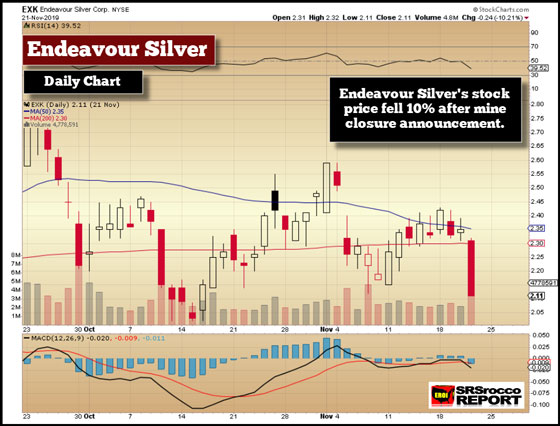
Ironically, the El Cubo Mine had its best year in 2018 by producing 2.6 million oz of silver, 47% of the company’s total 5.5 million oz. With the announcement of the closure of the El Cubo Mine, Endeavour Silver’s stock fell 10%:

Endeavor Silver Daily Chart (November 21, 2019)

While Endeavour Silver lost one of its top primary silver mines, the company has another project in development called the Terronera Mine in Mexico. According to the company’s newest investor presentation, the Terronera Mine will produce approximately 2.9 million oz of silver a year and 28,000 oz of gold. But, it may be a few years before the mine is in commercial status. I have not yet seen a proposed date for the first commercial production.

Thus, Endeavour Silver will have to limp along now with only two mines and a partial. The company added the El Compas Mine recently, but it only produced about 71,000 oz of silver for the first three quarters of 2019. This is the problem with running small mining operations. It seems that economies of scale tend to be the most profitable mining ventures.

Lastly, a tweet from Rudy Havenstein seems to wrap up the situation at Endeavour Silver:

Rudy Tweet

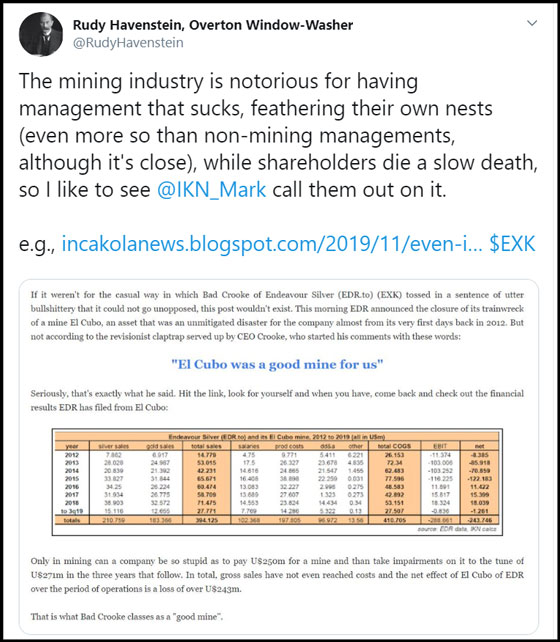
The closure of El Cubo Mine reminds us that silver reserves do not last forever. While the USGS published 20 years’ worth of silver reserves remaining in its latest 2019 Silver Mineral Summary Report, I highly doubt we will recover 50% of those reserves. And with energy becoming a big problem over the next decade, we may (or already have) reach peak silver production much sooner than later.


The Money Metals News Service provides market news and crisp commentary for investors following the precious metals markets.

RBA Comments On Potential QE

By Orbex

USD Higher Ahead of Data

The US dollar has been higher again today with the USD index trading 98.25 last, moving back up towards recent highs. Later today traders receive the CB consumer confidence number for last month which is expected to have ticked higher. Should we see an increase, USD is likely to continue higher.

EUR Higher on Better Data

EURUSD has been higher today, despite the strength in USD. Yesterday, the German Ifo business survey released yesterday came in higher than market forecasts at 95 vs 94.9 expected and 94.7 prior.

German data has been one of the key drivers of EUR downside over recent months and despite the mild beat, the outlook is still subdued, keeping the outlook for EUR weighted to the downside. EURUSD trades 1.1017.

GBP Falls On Brexit Wobbles

GBPUSD has been lower today, weighed on by USD strength. The UK elections continue to be the main market focus. Recent polls show that the Conservative party lead over the Labour party (main opposition) has now narrowed to 7%.

A Conservative win is seen as the clearest path to delivering a Brexit deal. With just over two weeks to go until the elections, polling results and incoming headlines will continue to drive price action. GBPUSD trades 1.2854 last.

SPX Backs Away From Highs

Risk assets have softened a little today, with the SPX500 falling back below the 3132.56 level. Yesterday, the index broke out to fresh, record highs on news that the US and China’s top negotiators spoke yesterday about resolving outstanding issues. The news is keeping expectations of a forthcoming trade deal well supported.

Safe Havens Rising

Safe havens have been a little firmer today with both gold and the Japanese Yen strengthening against USD. Concerns over the health of the US-China trade negotiations continue to see fluctuations in risk flows.

However, the latest comments appear supportive, offering limited upside for safe havens. JPY trades 108.94 last, down off yesterday’s highs. XAUUSD trades 1458.17 last, sitting just above the week’s low for now.

Oil Giving Back Gain

Oil prices have been a little higher today. But, gains are retracing now on the pullback in equities. Focus remains on whether the US and China will sign a trade deal which, for now, remains the base case scenario and should support higher oil prices. Later today, traders receive the latest API crude report ahead of tomorrow’s headline EIA report.

Loonie Lifting

USDCAD has been higher today, rising on the back of a stronger USD. The move has been further supported by the softening of this morning’s gains in crude. Looking ahead for the rest of the week, the Canadian GDP print on Friday is the key domestic release to note. USDCAD trades 1.3314 last.

RBA’s Lowe Considers QE

AUDUSD has been back under pressure today. despite the supportive news yesterday that US and Chinese officials spoke on the phone to keep negotiations moving.

Speaking overnight, RBA governor Lowe commented today that the bank could potentially use QE to further its monetary policy goals and also said that more fiscal easing should be used. AUDUSD trades .6775 last.

By Orbex


NZDUSD Analysis: Higher retail sales growth bullish for NZDUSD

By IFCMarkets

Higher retail sales growth bullish for NZDUSD

New Zealand’s retail spending rose 1.6% over quarter in the three months to September following 0.2% gain in Q2. Will the NZDUSD rise?

NZDUSD rising above MA(200)

The price chart on 1-hour timeframe shows NZDUSD: H1 is trading sideways. The price is rising above the 200-period moving average MA(200) which is rising. And the RSI oscillator is above 50 level and has not reached the overbought zone. There is no trend yet formed, traders have to decide when it would be a best time to enter the market.

Market Analysis provided by IFCMarkets

OIL/GAS Analysis: Demand for natural gas may decline

By IFCMarkets

Demand for natural gas may decline because of warm weather in the US

In this review, we suggest considering the personal composite instrument (PCI) &SumOIL/GAS. It reflects the price dynamics of the portfolio composed of futures contracts on Brent and WTI crude oils against the US natural gas futures contract.Will the SumOIL/GAS rise?

Such a movement means that oil prices are rising, while natural gas prices are falling. US-China trade negotiations and the OPEC meeting are tha main positive factors for oil. If the United States and China agree to reduce mutual import duties, this may contribute to the revival of their economies and global trade in general.
In this case, global oil demand may increase. The OPEC meeting will be held on December 5, 2019. It is expected the agreement on oil output cuts by OPEC oil producer countries and non-OPEC oil producers will be extended until mid-2020. This may limit global oil supply. Natural gas prices may fall because of the warm weather forecast this winter in the US. This will reduce the natural gas demand for heating. Let us note that last Friday, gas production in the US updated its historic high and amounted to 95.91 billion cubic feet per day. Earlier, the Energy Information Administration (EIA) published a forecast for gas pries to decline next year at Henry Hub.

SumOIL/GAS

On the daily timeframe, SumOIL/GAS: D1 breached up the resistance line of the downtrend. A number of technical analysis indicators formed buy signals. The further price growth is possible in case of an increase in global oil demand and warm weather in the US.

  • The Parabolic indicator gives a bullish signal.
  • The Bollinger bands have widened, which indicates high volatility. Both Bollinger bands are titled up
  • The RSI indicator is above 50. It has formed a positive divergence.
  • The MACD indicator gives a bullish signal.

The bullish momentum may develop in case SumOIL/GAS exceeds its last fractal high and the 200-day moving average line at 0.96. This level may serve as an entry point. The initial stop loss may be placed below the 10-month low and the Parabolic signal at 0.81. After opening the pending order, we shall move the stop to the next fractal low following the Bollinger and Parabolic signals. Thus, we are changing the potential profit/loss to the breakeven point. More risk-averse traders may switch to the 4-hour chart after the trade and place there a stop loss moving it in the direction of the trade. If the price meets the stop level (0.81) without reaching the order (0.96), we recommend closing the position: the market sustains internal changes that were not taken into account.

Summary of technical analysis

PositionBuy
Buy stopAbove 0.96
Stop lossBelow 0.81

Market Analysis provided by IFCMarkets

Global Manufacturing Readings Still Weak

By Orbex

The ongoing US-China trade war has taken a heavy toll on global trade over the last two years.

Worldwide, manufacturing readings have been trending lower across developed and emerging economies alike.

In the G10 bloc, the downturn in manufacturing readings has been hitting record lows in the US, UK, and the eurozone over the summer and into Q3.

The readings for last month are just starting to come in. These have shown that, while there is some improvement noted, activity remains very subdued and conditions are fragile.

US PMIs

The IHS Markit Manufacturing index for the US showed the factory sector recovering over November. It moved up to 7-month highs at 52.2. This was a strong increase from October’s 51.3 reading.

The increase has been attributed to a firm rise in the new orders component of the index, indicating better optimism over the last month. Rising hopes of a US-China trade deal are the main driver of this better outlook. However, with no signed deal yet, a further downturn remains a risk.

While the IHS Markit reading is in positive territory, the key focus will be on the ISM number due later this month. In October, the reading was still in contractionary territory at 48.3. Traders will now be keen to see whether the ISM reading was able to recover into positive territory over the month or whether the sector is still below the neutral level.

UK PMIs

In the UK, the IHS Markit reading was not so positive. The UK manufacturing sector fell further into contractionary territory at 48.3 from 49.6.

The UK is facing a more complicated picture given not only external pressure from the trade war but also threats from Brexit. And now, the added factor of a domestic election.

The uncertainty over Brexit this year has been a heavy source of downward pressure on economic activity. And, this latest reading is further evidence of the damaging impact of Brexit.

Eurozone PMIs

As with the US, the eurozone also saw a recovery in manufacturing activity last month. However, at just 46.6, the index is still well below the neutral level. This highlights the weakness seen across the single customs union.

The ECB is closely watching the downturn in activity. Traders are doing the same, and they are expecting the ECB to ease further. The heart of the eurozone economy, the German manufacturing sector, has trended heavily lower this year.

This is as a result of weaker global conditions as well as tariffs on eurozone exports. The latest readings showed the German manufacturing sector picked up over the last month. However, again, at just 43.8, the sector remains perilously weak. Therefore, we cannot rule out a further move lower.

Technical Perspective

The direction of global manufacturing is highly important to crude oil given that a large portion of demand for oil is tied to manufacturing.

Crude prices continue to grind higher within the recent bullish channel. However, price action remains choppy, labored, and vulnerable to reversal.

The 60 level resistance is the top of the recent range. This could prove to be the end of the current rally, seeing sellers taking price back lower, as the rotational play continues. To the downside, the rising channel bottom is the first support ahead of the 55 level.

By Orbex


USDJPY Analysis: Rising Japanese SPPI bullish for USDJPY

By IFCMarkets

Rising Japanese SPPI bullish for USDJPY

The Services Producer Price Index in Japan rose 2.1% from a year ago after 0.5% increase in the previous month. Will the USDJPY rise?

USDJPY falling toward MA(200)

The price chart on 1-hour timeframe shows USDJPY: H1 is trading sideways. The price is falling toward the 200-period moving average MA(200) which is rising. And the Stochastic oscillator is at 50 level and has not reached the oversold zone. There is no trend yet formed, traders have to decide when it would be a best time to enter the market.

Market Analysis provided by IFCMarkets

US Consumer Confidence To Rise In November

By Orbex

The Conference Board’s consumer confidence report for November is due out later today.

The median estimates point to a modest increase to 126.9 on the index. This is slightly higher than October’s reading of 125.9.

The US consumer confidence index remains at high levels despite the decline in the month before. The reading fell for the second consecutive month in October, following the declines in September.

But, in October, the current situation index rose slightly higher from 170.6 to 172.3. This indicates that despite the decline, consumers were still optimistic about the current situation.

The previous report came during the month when the Fed cut interest rates. There were widespread concerns about the economy. The US third-quarter GDP was weaker, rising at a pace of just 1.9%.

The concerns in the economy spread to the consumer side as well. The US labor market was stagnating with the pace of jobs created slowing steadily. Yet, despite the weakness in the headline figures, the labor market conditions continue to remain robust.

The trade war was also another major factor in the report for October. But this had little impact. Back in October, there was some optimism that the US and China would agree to a trade deal.

The expectations came as investors and consumes were also hoping that both countries would clinch a trade deal by November. Overall, the economy was seen to be relatively stable with no major threats to growth at that point.

Will the Index Rise as Expected in November?

November was relatively stable on most fronts. The main narrative during the month was the renewed uncertainty of the trade wars. The US administration threatened that it would raise tariffs on China if a deal was not made.

This effectively puts the December 15th deadline into focus. Failure to reach a deal could once again see another round of tariff hikes, possibly from both fronts. This would further put the deal out of reach from both parties.

Equity markets have been following the developments closely and a no-deal with China could probably put some pressure on the markets.

Furthermore, with the Federal Reserve noting that it was done with rate cuts, having a no-deal with China could probably hurt global trade even further.

As a result, investors are likely to remain somewhat cautious during the month.

So far, the early economic indicators show that growth is continuing. However, it is unlikely to see the growth rates logged in the earlier quarters of this year.

Therefore, it is possible that the consumer confidence index will rise as per expectations. At the very least, we expect to see a modest increase from October. This would mean that the consumer confidence index will have likely recovered after falling for two consecutive months.

Will the Report Impact the Markets?

The report in isolation is unlikely to garner much of a reaction. However, as long as the monthly readings are within the acceptable deviation levels, traders will brush aside the data.

An unexpected decline or even an increase could, however, see the markets repricing the data.

Given that it is a short week ahead, investors will be more focused on the data coming out ahead of the Thanksgiving holiday. This includes the core PCE data, the revised GDP numbers, and the durable goods orders.

Thus, we could expect to see some reaction closer to the main data dump than the CB consumer confidence report alone.

By Orbex


Ichimoku Cloud Analysis 26.11.2019 (AUDUSD, NZDUSD, USDCAD)

Article By RoboForex.com

AUDUSD, “Australian Dollar vs US Dollar”

AUDUSD is trading at 0.6780; the instrument is moving below Ichimoku Cloud, thus indicating a descending tendency. The markets could indicate that the price may test the cloud’s downside border at 0.6790 and then resume moving downwards to reach 0.6670. Another signal to confirm further descending movement is the price’s rebounding from the resistance level. However, the scenario that implies further decline may be canceled if the price breaks the cloud’s upside border and fixes above 0.6845. In this case, the pair may continue growing towards 0.6935.

AUDUSD
Risk Warning: the result of previous trading operations do not guarantee the same results in the future

NZDUSD, “New Zealand Dollar vs US Dollar”

NZDUSD is trading at 0.6420; the instrument is moving above Ichimoku Cloud, thus indicating an ascending tendency. The markets could indicate that the price may test the cloud’s downside border at 0.6385 and then resume moving upwards to reach 0.6535. Another signal to confirm further ascending movement is the price’s rebounding from the rising channel’s downside border. However, the scenario that implies further growth may be canceled if the price breaks the cloud’s downside border and fixes below 0.6345. In this case, the pair may continue falling towards 0.6265.

NZDUSD
Risk Warning: the result of previous trading operations do not guarantee the same results in the future

USDCAD, “US Dollar vs Canadian Dollar”

USDCAD is trading at 1.3309; the instrument is moving above Ichimoku Cloud, thus indicating an ascending tendency. The markets could indicate that the price may test the cloud’s upside border at 1.3275 and then resume moving upwards to reach 1.3445. Another signal to confirm further ascending movement is the price’s rebounding from the rising channel’s downside border. However, the scenario that implies further growth may be canceled if the price breaks the cloud’s downside border and fixes below 1.3215. In this case, the pair may continue falling towards 1.3130.

USDCAD

Article By RoboForex.com

Attention!
Forecasts presented in this section only reflect the author’s private opinion and should not be considered as guidance for trading. RoboForex LP bears no responsibility for trading results based on trading recommendations described in these analytical reviews.

Preconditions for BRIC-style growth in PH

By Dan Steinbock

In the postwar and post-Cold War era, the Philippines could have been an economic success story. Yet, the opportunity was missed between the mid-’60s and mid-2010s. In the Duterte era, the country is back on track, but BRIC-style growth is needed to overcome the legacy of past policy mistakes.

In the postwar era, the Philippines was one of the expected economic success stories in Southeast Asia. The country was positioned for rapid growth.

Or so it was thought.

Dreams of economic success, realities of stagnation

In 1950, Philippine living standards, as reflected by per capita incomes, were only a third lower than in Malaysia, the leading Southeast Asian economy (present-day Singapore excluded). In Indonesia and Thailand, those standards were still 20% behind, while Vietnam and Laos trailed 30% to 40% behind Filipinos.

In the mid-1960s, following the terms of Roxas, Quirino, Magsaysay, Garcia and Macapagal, living standards in the Philippines were only 10% less than in Malaysia, while Thailand still trailed behind, whereas Vietnam had fallen further behind, due to the decolonization struggle against France and the United States.

Despite challenges, the Philippines was catching up with regional leaders until the ‘60s.

When the Marcos era ended in 1986, living standards in Malaysia and Thailand continued to rise. However, Filipino per capita incomes were now 50% lower than in Malaysia and 25% lower than in Thailand; even behind those in Indonesia. Vietnamese living standards had plunged 50% lower than those in the Philippines, but that was due to a devastating war with the U.S.

What followed was a quarter of a century of the People Power Revolution. The assumption was that democratic rule – under Corazon Aquino, Ramos, Estrada, and Arroyo– would spark a dramatic comeback. Yet in 2008, at the eve of the global financial crisis, living standards in Philippines had fallen even further behind Malaysia (-72%), Thailand (-66%) and Indonesia (-34%), even behind Vietnam.

Here’s the irony: When Philippines began its democratic experiment, Vietnam launched Chinese-style economic reforms. The outcome? Philippines stagnated even further, while Vietnam grew in leaps. In some two decades, Vietnam’s GDP almost tripled, whereas that of the Philippines increased only by 50%.

In the Benigno Aquino III era, Philippine living standards remained more than 70% behind those in Malaysia, 54% behind Thailand and 34% after Indonesia. Despite the rhetoric, the period failed to change the course (Figure 1).

Figure 1 ASEAN and Philippine Per Capita Incomes (excl. Singapore), 1950-2008*

Source: Maddison Database; Difference Group

Half a century of missed opportunities

What the Duterte government is now trying to cope with is not just half a century of missed opportunities, but the consequent legacies, particularly corruption.

Here’s one example: Not so long ago, inflation concerns were still fueled by the supply abuses and hoarding of rice and the consequent destabilized prices (rice smuggling soared already in the Benigno Aquino III era). Today, the government must try to contain corruption in the local rice industry, which is one of the goals of the Rice Tariffication Law, while protecting the welfare of local farmers who are struggling with volumes of imported grains.

After the 2016 election triumph, the Duterte government has fought hard to focus on its “Build, Build, Build” investment program, which is what the country has needed ever since World War II. Yet, the implementation has suffered from domestic politics, particularly the (very costly) budget debacle in the spring.

Nevertheless, the government has been able to re-energize Philippine modernization and catch-up growth, thanks to its domestic investment drive and the recalibration of Philippine foreign affairs, which has fueled Chinese investment in the country.

To gain a better understanding of the stakes, let’s compare Goldman Sachs’s original BRIC projections in the 2000s with the actual BRIC prospects today. Assuming peaceful conditions and managed trade tensions, it now seems that between 2000 and 2024, Vietnam would grow fastest (compound annual growth rate at 5.8%), followed by Indonesia (4.2%) and Philippines (4.0%).

If the Duterte government can complete its investment program by 2022 and if the subsequent government will continue to focus on economic development, the country could grow its GDP seven to eightfold by 2025; more than originally projected. Vietnamese living standards would almost quadruple, while those in Indonesia would nearly triple. In the Philippines, living standards would increase 2.5-times (Figure 2).

Figure 2 Indonesia, Philippines and Vietnam: GDP Per Capita 2000-2024

Source: IMF; Difference Group

Preconditions for BRIC-style expansion

Here are some necessary preconditions to achieve Philippine BRIC-like growth in the early 2020s. First, policy mistakes – such as the past budget debacle – are not acceptable anymore. In view of people’s livelihood, such mistakes represent a legally-sanctioned way to penalize living standards in the future.

Second, prosperity cannot be created without stability at home. And the current stability will erode, if the country will face new waves of terrorism, or if economic development fails to accelerate in Mindanao.

A refocused struggle against drugs and corruption should prevail. Even if prosperity can be created, corruption will reduce its benefits. Between 2003 and 2014, the Philippines lost $10 billion in illicit financial flows annually. Tax evasion costs the country $7.4 billion annually; 2.7% of its GDP. Efforts at progressive taxation are elusive as long as the country ranks at par with Haiti and Morocco in tax evasion.

Fourth, as the country moves toward an upper-middle income status, inclusive growth is vital. For decades, exporting people rather than goods and services has been used to offset inadequate job creation. Now BRIC-like growth must increasingly benefit many rather than few – and that means more affordable education, broader welfare and rapid progress in the eradication of poverty.

Prosperity cannot be created without peace and stability in the region. One of President Duterte’s greatest achievements has been his willingness to recalibrate Philippine foreign policy between the U.S. and China. No foreign power should have bases in the Philippines, or rotation arrangements that achieve similar objectives without actual presence. Otherwise Philippines risks being perceived as the proxy of foreign powers that have their own interests in the region.

Sixth, the Philippines needs to further strengthen its economic, political and defense ties with ASEAN nations. Regional mass fosters international bargaining power.

BRIC-style growth is not easy. But when it is successful, it can significantly reduce the weight of past policy mistakes – such as the decades of missed opportunities in the pre-Duterte era.

About the Author:

Dr. Dan Steinbock is an internationally recognized strategist of the multipolar world and the founder of Difference Group. He has served at the India, China and America Institute (US), the Shanghai Institutes for International Studies (China) and the EU Center (Singapore). For more, see https://www.differencegroup.net/   

The original commentary was published by The Manila Times on November 25, 2019


Equities Rally Amid Quiet Trading Day

By Orbex

Equity markets rallied as a risk on sentiment saw major US indices touching new highs from Friday. The gains were partly driven by activity in the stock markets.

However, trade optimism is once again partly cited for the gains. President Trump on Friday said that a trade deal was near, in a volte-face from earlier tweets.

So far, there has been no clarity on the trade talks, and investors are simply reacting to rumors.

German Ifo Business Confidence Rises

The Ifo institute’s business confidence report for Germany saw a modest rebound in the index. The index beat estimates of 94.9 and rose to 95.0. This was higher than 94.7 which was registered on the index a month ago. Despite the increase, Ifo issued a warning about German manufacturing, which is still in a slump.

Will EURUSD Break the Support?

Price action in the currency pair is testing the support level of 1.0000 as expected. However, a lot hinges on how price behaves at this level. If the support remains firm, there is scope for a rebound.

This will likely see the EURUSD drifting sideways below the 1.1062 resistance. Alternatively, a convincing break down below the 1.0000 support could open the way for a drop to 1.0952.

Sterling Rises Despite Strong USD

The pound sterling was on the front foot on Monday following Friday’s declines. The gains come despite the US dollar rising strongly. Economic data from the UK remains sparse. Investors, however, look to the upcoming elections.

So far, poll pundits put Boris Johnson’s Conservative Party as the front runner. This potentially translates to the UK finally leaving the EU on January 31st, 2020 if the Tories win with a majority.

GBPUSD Reclaims Resistance Level

Price action in the currency pair saw a push above the resistance area of 1.2865. So far, prices remain confined within Friday’s range.

But, this could potentially indicate a near term breakout. There is a chance of an inverse head and shoulders pattern emerging near the current highs. At the same time, there is scope for price to break out lower. For the moment, we expect GBPUSD to remain within the said levels of 1.2865 and 1.2960.

Gold Prices Pressured Lower on China Talks

The precious metal was trending lower on Monday on the news about the US-China trade talks. The declines in the precious metal come amid renewed risk-off sentiment in the market.

China announced that it would step up its efforts to protect intellectual property rights. This has been one of the key demands from Washington for a deal to be made.

XAUUSD Downside Confirmed Only if Resistance Holds

XAUUSD has been trading volatile and the current bearish momentum points to a decline towards the 1445 level of support. However, unless resistance is tested near 1462, it is unlikely to see more declines.

There is scope for price action to breakout higher. Therefore, the resistance level of 1462 remains key. In the near term, we expect XAUUSD to be range-bound within the 1462 and 1445 levels.

By Orbex