US cattle placements continued to rise in October. Will the FCATTLE decline?
Recent US feedlot data were bearish. Placements in feedlots during October were higher compared to same period a year ago: 2.477 million head in total, 10% above October 2018, according to the USDA Cattle on Feed Report for October released last Friday. Placements increase accelerated as the Cattle on Feed Report released for September had reported placements in feedlots were higher compared to same period a year ago: 1.884 million head in total, 9% above August 2018. And cattle on feed is now displaying the typical seasonal declines. Higher supply is bullish for FCATTLE.
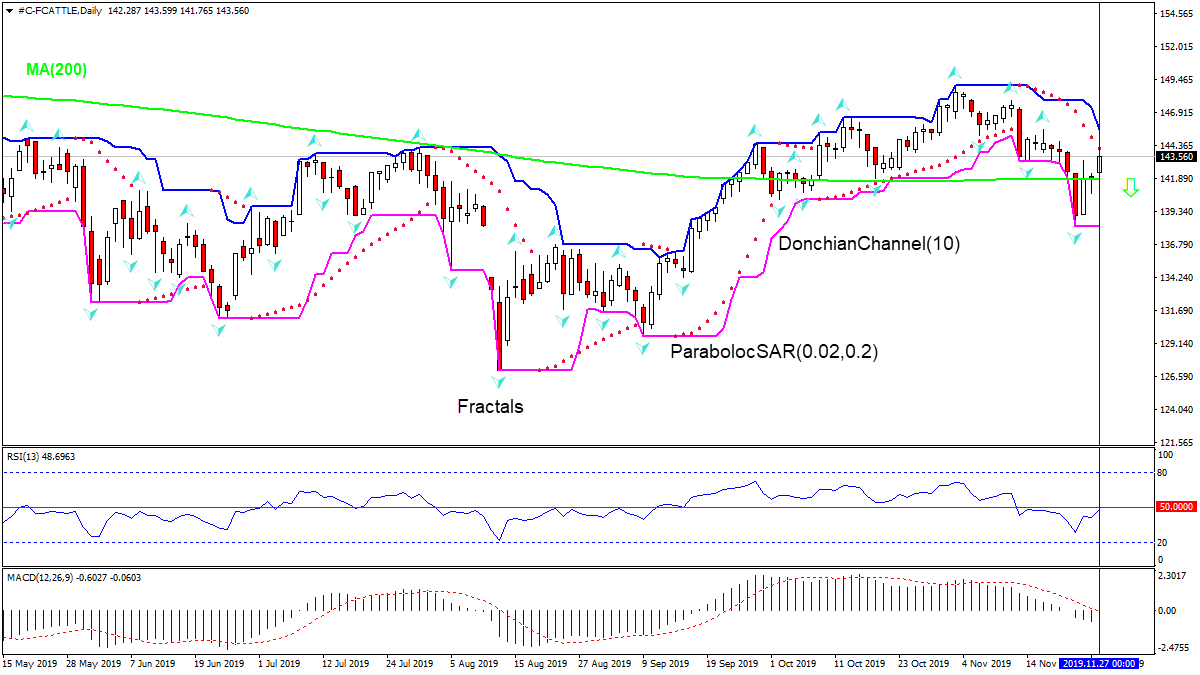
On the daily timeframe the FCATTLE: D1 has closed above the 200-day moving average MA(200).
The Parabolic indicator gives a sell signal.
The Donchian channel indicates downtrend: it is narrowing down.
The MACD indicator gives a bullish signal: it is below the signal line and the gap is narrowing.
We believe the bearish momentum will continue after the price breaches below the lower boundary of Donchian channel at 138.19. This level can be used as an entry point for placing a pending order to sell. The stop loss can be placed above the upper Donchian boundary at 145.65. After placing the order, the stop loss is to be moved every day to the next fractal high, following Parabolic signals. Thus, we are changing the expected profit/loss ratio to the breakeven point. If the price meets the stop loss level (145.65) without reaching the order (138.19), we recommend cancelling the order: the market has undergone internal changes which were not taken into account.
AUDUSD is trading at 0.6765; the instrument is moving below Ichimoku Cloud, thus indicating a descending tendency. The markets could indicate that the price may test the cloud’s downside border at 0.6780 and then resume moving downwards to reach 0.6685. Another signal to confirm further descending movement is the price’s rebounding from the resistance level. However, the scenario that implies further decline may be canceled if the price breaks the cloud’s upside border and fixes above 0.6830. In this case, the pair may continue growing towards 0.6915.
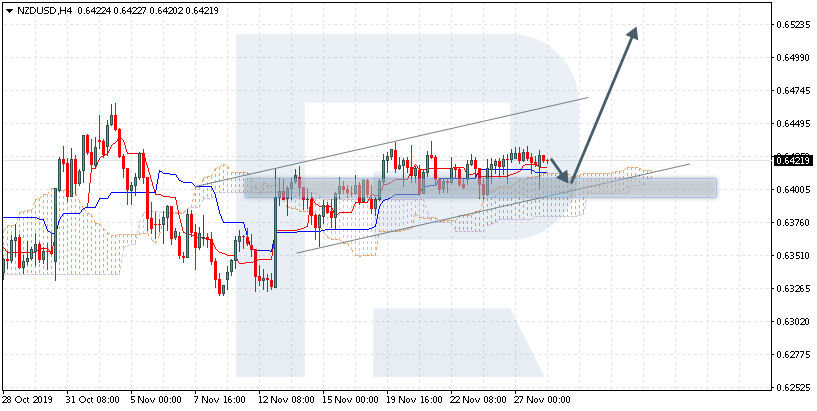
NZDUSD, “New Zealand Dollar vs US Dollar”
NZDUSD is trading at 0.6421; the instrument is moving above Ichimoku Cloud, thus indicating an ascending tendency. The markets could indicate that the price may test the cloud’s upside border at 0.6405 and then resume moving upwards to reach 0.6525. Another signal to confirm further ascending movement is the price’s rebounding from the rising channel’s downside border. However, the scenario that implies further growth may be canceled if the price breaks the cloud’s downside border and fixes below 0.6355. In this case, the pair may continue falling towards 0.6275.
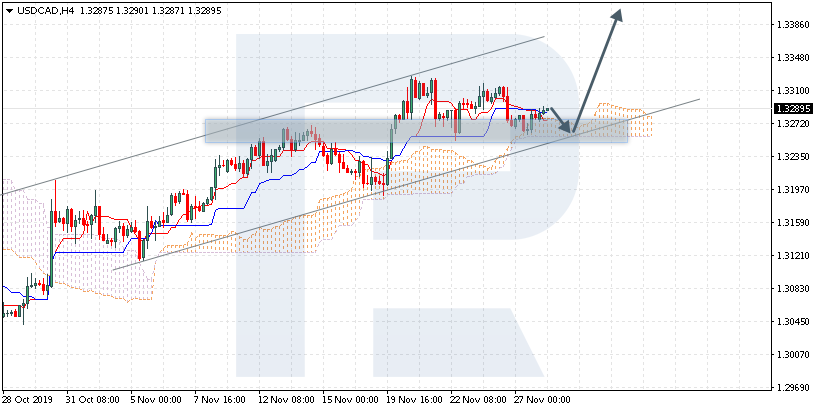
USDCAD, “US Dollar vs Canadian Dollar”
USDCAD is trading at 1.3289; the instrument is moving above Ichimoku Cloud, thus indicating an ascending tendency. The markets could indicate that the price may test the cloud’s downside border at 1.3265 and then resume moving upwards to reach 1.3405. Another signal to confirm further ascending movement is the price’s rebounding from the rising channel’s downside border. However, the scenario that implies further growth may be canceled if the price breaks the cloud’s downside border and fixes below 1.3220. In this case, the pair may continue falling towards 1.3135.
Attention! Forecasts presented in this section only reflect the author’s private opinion and should not be considered as guidance for trading. RoboForex LP bears no responsibility for trading results based on trading recommendations described in these analytical reviews.
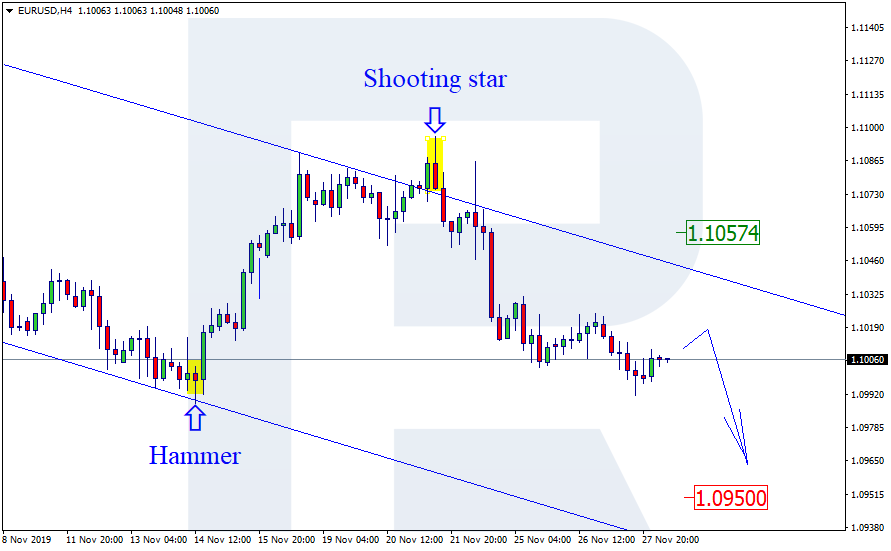
As we can see in the H4 chart, the descending tendency continues. After forming Shooting Star pattern, EURUSD has reversed and right now is still trading in the middle of the channel. We may assume that after finishing a slight correction the price may resume falling to reach 1.0950. However, one shouldn’t exclude a possibility that the price may continue growing towards 1.1057.
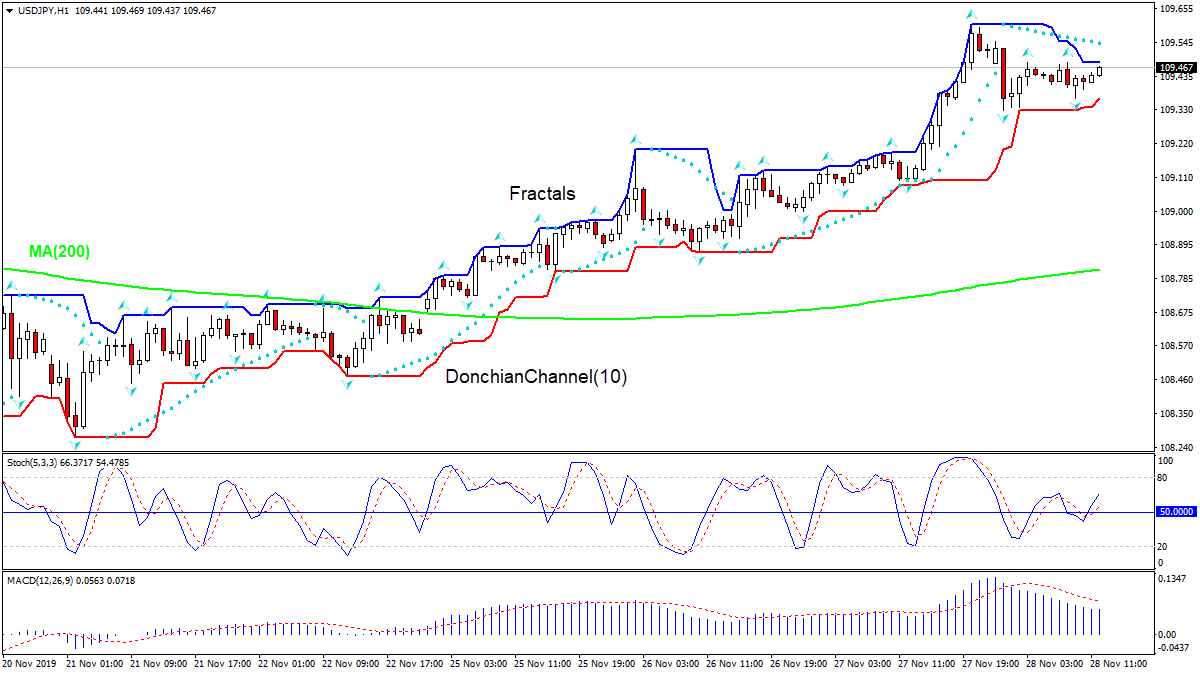
USDJPY, “US Dollar vs. Japanese Yen”
As we can see in the H4 chart, the ascending tendency continues. By now, USDJPY has formed another reversal pattern, Shooting Star. Later, the pair may reverse and start a slight correction, which may be followed by further growth towards 109.85 to continue forming the ascending tendency. At the same time, the pair may choose another scenario and start a new decline to reach 108.75.
Attention! Forecasts presented in this section only reflect the author’s private opinion and should not be considered as guidance for trading. RoboForex LP bears no responsibility for trading results based on trading recommendations described in these analytical reviews.
The EUR/USD currency pair is still consolidating. There is no defined trend. The local support and resistance levels are 1.10000 and 1.10250, respectively. Mixed US economic data was released yesterday. Thus, US GDP (q/q) grew in the third quarter by 2.1% instead of the expected growth of 1.9%. The number of initial applications for unemployment benefits fell to 213K instead of 223K. However, the index of incomplete sales in the real estate market fell in October by 1.7%, while experts expected an increase of 0.2%. According to the Beige Book, the US economy is growing at a moderate pace. Today, volatility is reduced as US financial markets are closed due to Thanksgiving. We recommend opening positions from key levels.
The Economic News Feed for 28.11.2019 is calm.
The indicators do not give accurate signals: the price crossed 50 MA.
The MACD histogram is near the 0 mark, which also does not give signals.
Stochastic Oscillator is near the overbought zone, the %K line is above the %D line, which gives a weak signal to buy EUR/USD.
Trading recommendations
Support levels: 1.10000, 1.09850
Resistance levels: 1.10250, 1.10500, 1.10800
If the price consolidates below the round level of 1.10000, expect the quotes to fall toward 1.09700-1.09600.
Alternatively, the quotes could grow toward 1.10400-1.10600.
The GBP/USD currency pair
Technical indicators of the currency pair:
Prev Open: 1.28542
Open: 1.28542
% chg. over the last day: +0.49
Day’s range: 1.28332 – 1.28464
52 wk range: 1.1959 – 1.3385
The GBP/USD currency pair began to win back losses. During yesterday’s and today’s trading, GBP/USD quotes rose by more than 85 points. This movement is largely due to technical factors. Market participants are waiting for new information regarding the Brexit process. At the moment, the key support and resistance levels are: 1.29200 and 1.29500, respectively. We recommend opening positions from these marks. GBP can grow further.
The Economic News Feed for 28.11.2019 is calm.
Indicators point to the power of buyers: the price is trading above 50 MA and 100 MA.
The MACD histogram is in the positive zone and above the signal line, which gives a strong signal to buy GBP/USD.
The Stochastic Oscillator is in the neutral zone, the %K line crossed the %D line. There are no signals at this time.
Trading recommendations
Support levels: 1.29200, 1.28950, 1.28700
Resistance levels: 1.29500, 1.29800
If the price consolidates above 1.29500, expect further growth toward 1.30000.
Alternatively, the quotes could descend toward 1.28950-1.28700
The USD/CAD currency pair
Technical indicators of the currency pair:
Prev Open: 1.32712
Open: 1.32821
% chg. over the last day: +0.11
Day’s range: 1.32900 – 1.32949
52 wk range: 1.2727 – 1.3664
The technical picture on the USD/CAD currency pair is still ambiguous. CAD is trading in a protracted flat. At the moment, the local support and resistance levels are: 1.32800 and 1.33000, respectively. Participants in financial markets expect additional drivers. Today, volatility will be reduced due to the holiday in the United States. We recommend paying attention to the dynamics of oil quotes. Open positions from key levels.
The Economic News Feed for 28.11.2019 is calm.
Indicators do not give accurate signals: the price crossed 50 MA and 100 MA.
The MACD histogram is in the positive zone and above the signal line, which gives a strong signal to buy USD/CAD.
The Stochastic Oscillator is in the neutral zone, the %K line crosses %D. There are no signals at this moment.
Trading recommendations
Support levels: 1.32800, 1.32650, 1.32400
Resistance levels: 1.33000, 1.33200, 1.33350
If the price consolidates above the round level of 1.33000, expect further growth toward 1.33200-1.33400.
Alternatively, the quotes could descend toward 1.32600-1.32400.
The USD/JPY currency pair
Technical indicators of the currency pair:
Prev Open: 109.034
Open: 109.549
% chg. over the last day: +0.30
Day’s range: 109.374 – 109.446
52 wk range: 104.97 – 114.56
The USD/JPY currency pair continued to rise. The trading tool again updated local highs. At the moment, USD/JPY quotes are consolidating. The key support and resistance levels are 109.350 and 109.600, respectively. In the near future, technical correction is possible. We recommend you to keep track of current information regarding trade negotiations between the United States and China. Open positions from key levels.
The Economic News Feed for 28.11.2019 is calm.
Indicators point to the strength of buyers: the price has fixed above 50 MA and 100 MA.
The MACD histogram is in the positive zone, but below the signal line, which gives a weak signal to buy USD/JPY.
The Stochastic Oscillator is in the neutral zone, the %K line is below the %D line, which gives a signal to sell USD/JPY.
Trading recommendations
Support levels: 109.350, 109.200, 109.050
Resistance levels: 109.600, 110.000
If the price consolidates above 109.600, expect further growth toward 110.000.
If the USD/JPY quotes fall below 109.350, the quotes will reach 109.200-109.000.
The US dollar is being traded without significant changes against a basket of currencies. Yesterday, the dollar index (#DX) closed in the positive zone (+0.12%). However, market tensions increased due to a new decision by US President D. Trump. So, yesterday, the official signed two bills that support protesters in Hong Kong. This step may significantly complicate trade negotiations with China. The Ministry of Foreign Affairs of the People’s Republic of China threatens to take strict measures, calling any attempt to interfere in Hong Kong’s affairs “doomed to fail.”
Mixed US economic data were also released yesterday. Thus, US GDP (q/q) grew in the third quarter by 2.1% instead of the expected growth by 1.9%. Initial jobless claims fell to 213K instead of 223K. However, pending home sales fell by 1.7% in October, while experts expected an increase by 0.2%. According to the Beige Book, the US economy is growing at a moderate pace.
Today, US financial markets are closed due to Thanksgiving. Market volatility may be reduced.
The “black gold” prices are declining. Currently, futures for the WTI crude oil are testing the $57.70 mark per barrel.
Market Indicators
Yesterday, there was the bullish sentiment in the US stock market: #SPY (+0.45%), #DIA (+0.20%), #QQQ (+0.70%).
The 10-year US government bonds yield has increased slightly. At the moment, the indicator is at the level of 1.76-1.77%.
The Economic News Feed for 28.11.2019:
Today, the publication of important economic news is not expected.
By Hussein Sayed, Chief Market Strategist (Gulf & MENA), ForexTime
US major indices hit new record highs on Wednesday
Asian equities retreat after President Trump signed Hong Kong pro-democracy bill
Election polls are the main driver for Sterling traders
US major indices and Treasury yields rallied overnight as the S&P 500, Dow Jones Industrial Average and Nasdaq Composite all hit new record highs after the release of stronger than expected domestic economic data.
Third-quarter GDP rose more than initially forecast. The US economy expanded at a rate of 2.1% vs 1.9% in the first reading. An upward revision in inventory accumulation is the major contributor to the revised figures and reflects business confidence, even if it is slightly less positive in nature. October’s US core capital goods orders posted its biggest gain in nine months which also suggests that businesses are more confident spending on machinery and other durable goods. Business investment has been a missing part of current US economic growth which has relied heavily on consumers. If data continues to reflect such business optimism, expect fourth-quarter GDP to surprise to the upside too.
Trump signs Hong Kong pro-democracy bill
The global rally in equity markets over the past several weeks has been mainly driven by reports and official statements that a “phase one” Sino-US trade agreement is near. The approval of the Hong Kong legislation backing protesters is likely to put the trade agreement into question as China has reiterated its threat of retaliation.
That said, looking into the initial reaction from the Asian trading session, it doesn’t seem investors are seriously concerned. Despite the fall in equity markets, the declines are marginal and don’t reflect a severe threat to the recent bull market. However, expect the rally to pause until more clarity is provided on the trade deal front. If investors suspect that the trade agreement is under real danger, expect to see a sharp selloff in December. For now, investors are taking a wait-and-see approach.
Currencies remain stuck in tight ranges
The safe-haven Yen rose against its major peers after President Trump signed the Hong Kong pro-democracy bill, but the reaction was also limited and most major currencies remain in tight trading ranges. Expect the low volatility environment in currencies to continue over the next couple of days, until next week’s data which may see markets break out of their current narrow ranges.
However, Sterling may be a different story as we approach the December 12 election as traders are currently focused on one thing only, which is the polls. Last night, the much-anticipated results from YouGov’s MRP poll were published. This was the only model which correctly predicted that Theresa May would lose her absolute majority in 2017 and forecast that the Conservatives would win a big majority. This has driven GBPUSD higher, and only a strong narrowing of the gap between the Conservatives and the opposition Labour party will lead to any selling pressure. It’s now increasingly evident that any outcome other than a strong Conservative majority would be negative for Sterling, so keep a close eye on the polls.
Disclaimer: The content in this article comprises personal opinions and should not be construed as containing personal and/or other investment advice and/or an offer of and/or solicitation for any transactions in financial instruments and/or a guarantee and/or prediction of future performance. ForexTime (FXTM), its affiliates, agents, directors, officers or employees do not guarantee the accuracy, validity, timeliness or completeness, of any information or data made available and assume no liability as to any loss arising from any investment based on the same.
Japan’s retail spending dropped 7.1% over year in October, the fastest pace in four and half years. Will the USDJPY rise?
The price chart on 1-hour timeframe shows USDJPY: H1 is trading sideways. The price is rising above the 200-period moving average MA(200) which is rising. And the Stochastic oscillator is above 50 level and has not reached the overbought zone. There is no trend yet formed, traders have to decide when it would be a best time to enter the market.
US stocks closed at record high third consecutive session on Wednesday buoyed by upbeat data. The S&P 500 gained 0.4% to fresh record 3153.63. The Dow Jones industrial average advanced 0.2% to 28164.00. Nasdaq rose 0.7% to 8705.18. The dollar strengthening resumed on a batch of positive data: Q3 GDP was revised to 2.1% from1.9% initial estimate, orders for durable goods rose above expected 0.6% in October, and initial jobless claims declined 15,000 to 213,000 last week. The live dollar index data show the ICE US Dollar index, a measure of the dollar’s strength against a basket of six rival currencies, rose 0.1% to 98.32 but is lower currently. US markets are closed today for the Thanksgiving holiday and will close early on Friday.
European stocks advanced fifth straight session
European stock indexes extended gains on Wednesday. EUR/USD declined while GBP/USD turned higher yesterday with both pairs reversing currently. The Stoxx Europe 600 added 0.3% led by telecom shares. Germany’s DAX 30 rose 0.4% to 13158.14. France’s CAC 40 slipped 0.1% despite consumer confidence rise in November and UK’s FTSE 100 gained 0.4% to 7429.78.
Shanghai Composite leads Asian indexes retreat
Asian stock indices are mostly in red today as Beijing threatened unspecified consequences after President Trump signed two bills supporting Hong Kong protesters. Nikkei pilled back 0.1% to 23409.14 with yen decline against the dollar reversed. Chinese stocks are falling: the Shanghai Composite Index is 0.5% lower while Hong Kong’s Hang Seng Index is down 0.2%. Australia’s All Ordinaries Index added 0.2% with Australian dollar slide against the greenback continuing.
Brent futures prices are marginally lower today. Prices pulled back yesterday after Energy Information Administration report Wednesday that US crude supplies rose by a lower than forecast 1.6 million barrels last week: January Brent crude slid 0.3% to $64.06 a barrel on Wednesday.
Note: This overview has an informative and tutorial character and is published for free. All the data, included in the overview, are received from public sources, recognized as more or less reliable. Moreover, there is no guarantee that the indicated information is full and precise. Overviews are not updated. The whole information in each overview, including opinion, indicators, charts and anything else, is provided only for familiarization purposes and is not financial advice or а recommendation. The whole text and its any part, as well as the charts cannot be considered as an offer to make a deal with any asset. IFC Markets and its employees under any circumstances are not liable for any action taken by someone else during or after reading the overview.
By CentralBankNews.info Mauritius’ central bank left its Key Repo Rate (KRR) unchanged at 3.35 percent but lowered its growth forecast for this year, saying economic developments since August “have been less favorable than expected and downside risks to the growth outlook have increased.” The Bank of Mauritius (BOM), which cut its rate by 15 basis points in August in a pre-emptive move against the risks of weaker global growth, lowered its growth forecast for 2019 to 3.7 percent from an earlier 3.9 percent but maintained the forecast for 2020 growth of around 4.0 percent. Mauritius’ gross domestic product grew an annual 3.4 percent in the second quarter of this year, up from 3.3 percent in the first quarter but BOM said the risks to the global economic outlook continue to tilt to the downside. Inflation in Mauritius remains low, with headline inflation falling to 0.7 percent in October from 0.0 percent in July, according to BOM. Bank staff maintained their forecast for inflation to average 0.5 percent this year and 1.5 percent in 2020. Today’s decision was decided by a majority as in August when the monetary policy committee also was split in its decision. Today’s minutes of the meeting will be released Dec. 11. At the August meeting 6 members voted for the cut, one member voted for a 25-basis-point cut and one voted to keep the rate unchanged. The Mauritian rupee has been depreciating since February and was trading at 36.6 to the U.S. dollar today, down 6 percent this year. The Bank of Mauritius issued the following statement:
“The Monetary Policy Committee (MPC) of the Bank of Mauritius (Bank) has, by majority vote, decided to keep the Key Repo Rate (KRR) unchanged at 3.35 per cent per annum at its meeting today.
The MPC noted that the risks to the global economic outlook continued to tilt to the downside. The IMF has again revised down its global growth projection for 2019 to 3.0 per cent. However, it projects growth to recover modestly to 3.4 per cent in 2020 due to continued macroeconomic support and higher contribution from emerging market economies. The OECD, on the other hand, has forecasted that the global economy would grow by 2.9 per cent in both 2019 and 2020. Inflation is projected to increase from 1.5 per cent in 2019 to 1.8 per cent in 2020 for advanced economies and from 4.7 per cent in 2019 to 4.8 per cent in 2020 for EMDEs.
The domestic economy maintained its growth momentum in 2019Q2, as key sectors continued to grow. However, since the last MPC meeting, economic developments, both on the international and domestic fronts, have been less favourable than expected and downside risks to the growth outlook have increased. Based on latest available information, Bank staff is projecting real GDP growth at 3.7 per cent for 2019 and maintained its forecast for 2020 at about 4 per cent.
Domestic inflation remained low while core inflation measures have remained broadly contained below 2.0 per cent. Headline inflation declined from 0.9 per cent in July 2019 to 0.7 per cent in October 2019. Bank staff has maintained their inflation forecast for 2019 at 0.5 per cent and for 2020 at 1.5 per cent.
Taking into consideration recent external and domestic economic developments and trends, the MPC weighed risks to the growth and inflation outlook and decided to keep the monetary policy stance unchanged.
The MPC stands ready to meet in between its regular meetings, if the need arises.
The Minutes of the meeting will be issued on Wednesday 11 December 2019.”
Sector expert Michael Ballanger interprets year-end investment tactics by looking back at a childhood encounter.
“Gold is money; everything else is credit.” J.P. Morgan
My first faithful dog Fido (circa 1963) and I used to play a game years ago before his eyes and hips started to go a tad “wonky,” and in that respect, we were and are quite similar. They say that dogs tend take on the appearance of their owners (or vice versa), so I guess that goes for the aging process as well. Anyway, we used to live in a neighborhood in the GTA that was once considered “working class:” That is to say, the wartime houses all looked the same (dull); were quite modest (small); and all were affordable (cheap).
However, the yards were actually disproportionate to the dwellings because my dad could flood a near-regulation-size hockey rink as long as the cops didn’t see him open up the local fire hydrant with that god-awful wrench the size of a baseball bat. In the winter, even on school nights, kids from around the neighborhood would be in the Stanley Cup finals until well after bedtime, as Dad strung up the ugliest set of lights in history to illuminate the playing surface.
As the winter wore on, the snow shoveled from the ice became the boards and after a number of mild spells where melting and refreezing occurred, those boards were the most unforgiving boards in hockey history. The nets were all made from 2x4s and fencing mesh so taut that if you really leaned into a shot, chances are it was coming right back at you twice as lethal as it was when it left your stick.
It was a mixed neighborhood with plenty of ethnic prejudice; being in an aircraft manufacturing town, it was filled with those awful immigrants from England and Ireland and Scotland that thought they actually belonged in Canada. As the legacy of the British Isles was carried across the Atlantic Ocean, the English looked down upon the Scots; the Scots and English looked down upon the Irish, and nobody but nobody tampered with anyone from Dublin. I know it wasn’t right but that was just the way it wasuntil you got on the ice, that is. Once on the ice, ethnicity disappeared and new battle lines were drawn and suddenly everyone wanted young Paddy from Dublin on their team and were willing to pay up. Suddenly and without reason, young Paddy was eating at your dinner table and was officially your “mate” (although Mother wondered for years after how any ten-year old boy could eat that many potatoes in one sitting).
Now, there was one kid named Harley who didn’t play hockey and as we all thought he was a little “strange” we tended to steer clear of him. Much larger than any of us, Harley took a different bus to school each morning and as we used to watch him duck to enter into the door of the bus, we would shudder to think of what would happen to us if he ever got mad (given that he probably was “mad”). One day, coming home from school, I came across an enormous black lunchbox lying unopened on the side of the road, and being of a curious nature (“nosy”), I opened it up and found a triple-decker peanut butter, jam and banana (!) sandwich staring up at me from under the Saran wrap that protected its infinite freshness. Now, peanut butter was good and a triple decker was better and a triple-decker peanut butter and jam was sublime, but throw in ripened banana slices and whoosh! Heaven. As Fido and I sat there devouring this tiny sliver of paradise (Fido kept smacking his canine lips to keep his mouth from sticking shut), around the corner appeared the visage of a large human being moving (stomping) toward us, apparently in ill humor. As he approached, a feeling of impending dread began to fill my psyche. When I finally realized who it was, I noticed a name, Harley, on the underside of the lunch box. which sent me scrambling to rewrap the half-eaten sandwich and stuff it under the apple and Mickey Mouse napkin.
Just as this leviathan of a boy reached down to grab me, the most remarkable thing occurred. Fido, having finally freed the peanut butter from the roof of his mouth, let out the most ungodly of growls and leapt in the air, his front paws landing squarely on Harley’s chest and, as if propelled by prehistoric instinct, fired poor Harley straight onto his back. Fearing for our lives the repercussions of assaulting this Neanderthal of a human, I ordered Fido to “Come!” Poised for flight, I watched in wonderment as each time Harley tried to get back on his feet, Fido would thump him back down. He never bit the kid but he never let him up either, and only when some adults came by and began to referee the altercation did Fido let up and trot back home with me, tongue wagging and supremely happy to have his teeth free from that hideous peanut butter. From that point on in my life, I called the Fido move “lockdown.” Fido the Wonder Dog was the master of “lockdown!”
What brought that little anecdote to mind was the recent action in the financial markets where the S&P 500 continues to shrug off weakening macro data, global trade and rising yields only to focus on a handful of momo stocks that are dominating the averages. Likewise, precious metals are bogged down in a range where rallies are constantly sold but also, due largely to physical demand, dips are being bought, particularly in silver.
The one word that comes to mind is, once again, “lockdown,” as it matters not the content of the headline event, with stock markets being at all-time highs; with gold and silver short positions now comfortably profitable coming off the early September highs; with year-end bonuses for the bullion bank traders firmly in the crosshairs. As we all have seen before, there is nothing more compelling than a seven-figure bonus at Hanukkah (or Christmas). Markets are in full lockdown and I find it hilarious to listen to CNBC as all of their “guest commentators” explain with great seriousness their “outlooks” and all of the minutia needed to explain why investors are choosing to ignore $80100 billion a day (!) of REPO actions absolutely engorging the member banks with cash all for reasons about which we are supposed to “not worry.”
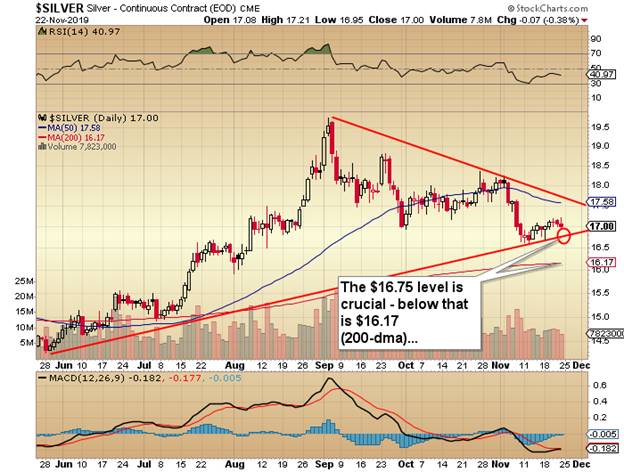
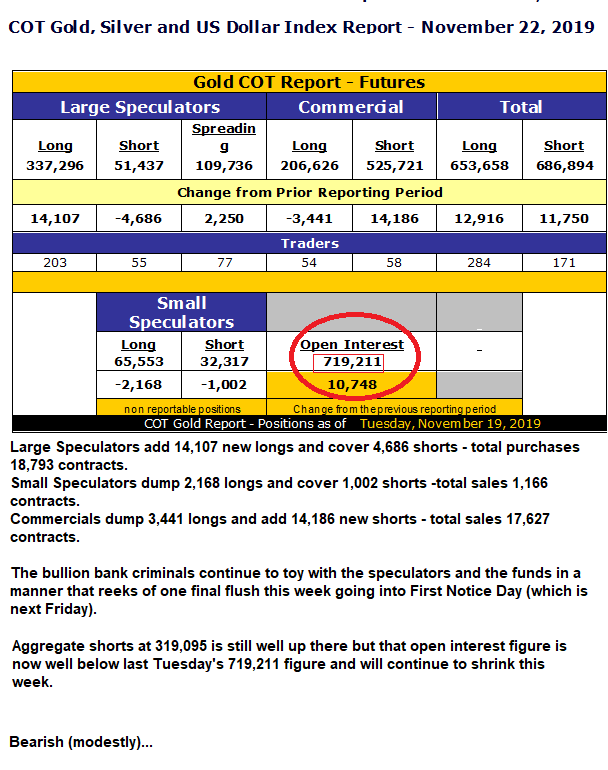
That said, the December silver contract is struggling within a downtrending triangle and absolutely must hold $16.75, the failure of which runs the risk of a quick plunge to the 200-dma (daily moving average) at $16.17. While I remain bullish, the upcoming week is going to be critical for near-term traders as we rapidly approach the First Notice Day, where gold open interest is coming down from its highest level in history. While silver is nowhere near as high, it is still in veritable lockdown unless it cracks $16.75.
Now, using Crimex #3 “Rule of Deception,” a breakdown of the $16.75 trendline could be the tape-painting exercise orchestrated by the bullion bank thieves to spook the funds and the amateur technicians into a high-volume dump, giving JPMorgan and brethren the opportunity to cover, after which they take it right back up. We shall see.
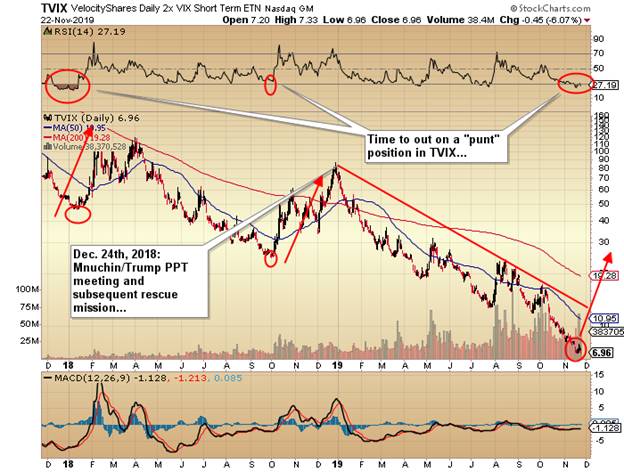
Shifting gears to stocks for a moment, I have been asked why, with the TVIX now down to under $7, I am not taking on a position. The reason is that I have become so disgusted with these constant interventions (PPT/REPO/tweets) that I feel like the mark in the rigged poker game. Anyone who can read and write can see how blatantly tilted the board has become. But I did pull up the TVIX chart and it actually looks like a very low-risk, high reward set-up. It’s a “buy.”
Last Tuesday’s COT carries few surprises, as it is consistent with today’s title. Large Specs want some? Commercials fill their orders. Large Specs need out? Commercials buy them. Wash. Rinse. Repeat. Total lockdown until Friday, then it all begins again with the Feb gold contract.
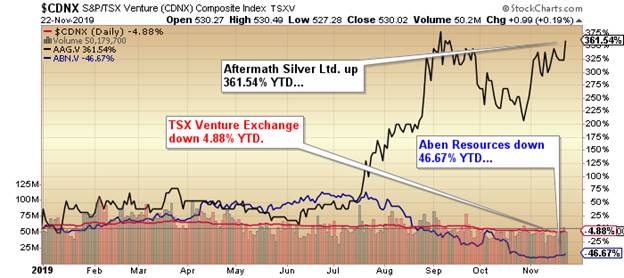
The TSX Venture Exchange has lost 4.88% year to date in a year that has seen the S&P rise 24%, with gold and silver up 14.23% and 9.4% respectively. Now, a great deal of that is the result of the bursting of the cannabis bubble in the summer, and since the wizards that run the TSX.V were all clamoring to get in on the action earlier this year and diversify away from the historical reliance on resources, the underperformance of the Canadian “gunslinger” exchange continues to act as a repellent to larger international capital flows that used to propel prices and funding activities over the past fifty years. I, for one, think that the TSX.V should stick to resources and let that cesspool Canadian Securities Exchange (the CSE) do the “flavor of the month” style of selection process that has served them so poorly here in 2019.
Regardless, my number one junior pick for 2019, Aftermath Silver Ltd. (AAG:TSX.V) (C$0.30), recommended in early July (just as the Georgian Bay boating season began) at CA$0.095/share, closed at CA$0.30 for the week, up 361.54% year to date, versus 4.88% for the TSX.V. By contrast, 2018’s darling (for a while, anyway) Aben Resources Ltd. (ABN:TSX.V; ABNAF:OTCQB), closed out last year in dismal form after I advised biting the bullet at CA$0.28. Despite a great deal of hype, it still sucked wind in 2019, closing out the week down another 46.67% year to date. This type of contrast in outcome is what keeps the large flows out of the Canadian junior markets.
However, I have not wavered one iota in my enthusiasm for the management team and projects acquired by Mssrs. Williams and Rushton, and continue to accumulate more stock on each and every pullback since the last of the financings closed. The big news recently was the purchase by Eric Sprott of a 19.51% position in the company at $0.20 per share by way of a $2.98 million cash injection, which will essentially fund all activities in Chile for the foreseeable future.
Now, Eric Sprott is by no means infallible and his judgement is going to be rated by the two goddesses of mining (Mother Nature and Lady Luck) in the same way as are all mining projects. But one thing that can’t be denied is that Eric has a strong following and the eyes and ears of the institutional community. One look at what the Kirkland Lake Gold Inc. (KL:TSX; KL:NYSE) team did with Eric as chairman is proof positive that such involvement by such an accomplished investor, if nothing else, significantly improves our odds of succeeding. In this game, I will take any “edge” offered to me any day and all day. That, by the way, includes rabbits’ feet, St. Christopher medals, prayer and voodoo.
Also of note is that the recent financing announced by Getchell Gold Corp. (CA$0.10) looks to close next week oversubscribed (CA$1 million+), so the Fondaway acquisition is now a done deal and GTCH is the proud soon-to-be owner of a 1,069,000-ounce deposit. An old name from the past (Gem International) looks to close CA$500,000 next week as well, after coming out of purgatory, and was relisted on the TSX.V after a very painful (and embarrassing) eighteen months.
From the shape of the junior mining portion of the portfolio, had we not taken Great Bear Resources Ltd. (GBR:TSX.V; GTBDF:OTCQX) (CA$6.20) from $2.33 in January to $9.02 in September, and if we had not jumped on the Aftermath in July, there would now be bleeding eye sockets going into year-end, because the other names (Western Uranium and Stakeholder Gold) are either flat or lower for the year. As for the GGMA portfolio, it still remains ahead over 160% year to date (YTD), but will be pruned by mid-December to prepare for 2020.
Think of my trusty Fido the First and his classic lockdown move. Everything is in lockdown mode as portfolio managers strive to maintain their YTD profits. Mind you, it seems that everyone I talk to is mindful of this unearthly calm that has descended upon markets, so under the theory that markets do their utmost to hurt the majority of participants and reward the fewest possible, if there is a Black Swan event going into 2020, it will be a downside shock for stocks and a very pleasant upside surprise for the metals, where sentiment has once again shifted to despair.
Originally trained during the inflationary 1970s, Michael Ballanger is a graduate of Saint Louis University where he earned a Bachelor of Science in finance and a Bachelor of Art in marketing before completing post-graduate work at the Wharton School of Finance. With more than 30 years of experience as a junior mining and exploration specialist, as well as a solid background in corporate finance, Ballanger’s adherence to the concept of “Hard Assets” allows him to focus the practice on selecting opportunities in the global resource sector with emphasis on the precious metals exploration and development sector. Ballanger takes great pleasure in visiting mineral properties around the globe in the never-ending hunt for early-stage opportunities.
Disclosure: 1) Michael J. Ballanger: I, or members of my immediate household or family, own securities of the following companies mentioned in this article: Aftermath Silver, Aben Resources, Western Uranium & Vanadium, Canuc Resources, Getchell, Stakeholder, Great Bear. My company has a financial relationship with the following companies referred to in this article: Aftermath, Getchell Gold and Western Uranium and Vanadium. I determined which companies would be included in this article based on my research and understanding of the sector. Additional disclosures are below. 2) The following companies mentioned in this article are billboard sponsors of Streetwise Reports: Aben Resources, Great Bear Resources. Click here for important disclosures about sponsor fees. As of the date of this article, an affiliate of Streetwise Reports has a consulting relationship with Aftermath. Please click here for more information. 3) Statements and opinions expressed are the opinions of the author and not of Streetwise Reports or its officers. The author is wholly responsible for the validity of the statements. The author was not paid by Streetwise Reports for this article. Streetwise Reports was not paid by the author to publish or syndicate this article. Streetwise Reports requires contributing authors to disclose any shareholdings in, or economic relationships with, companies that they write about. Streetwise Reports relies upon the authors to accurately provide this information and Streetwise Reports has no means of verifying its accuracy. 4) This article does not constitute investment advice. Each reader is encouraged to consult with his or her individual financial professional and any action a reader takes as a result of information presented here is his or her own responsibility. By opening this page, each reader accepts and agrees to Streetwise Reports’ terms of use and full legal disclaimer. This article is not a solicitation for investment. Streetwise Reports does not render general or specific investment advice and the information on Streetwise Reports should not be considered a recommendation to buy or sell any security. Streetwise Reports does not endorse or recommend the business, products, services or securities of any company mentioned on Streetwise Reports. 5) From time to time, Streetwise Reports LLC and its directors, officers, employees or members of their families, as well as persons interviewed for articles and interviews on the site, may have a long or short position in securities mentioned. Directors, officers, employees or members of their immediate families are prohibited from making purchases and/or sales of those securities in the open market or otherwise from the time of the interview or the decision to write an article until three business days after the publication of the interview or article. The foregoing prohibition does not apply to articles that in substance only restate previously published company releases. As of the date of this article, officers and/or employees of Streetwise Reports LLC (including members of their household) own securities of Aftermath Silver, Getchell, Canuc and Stakeholder, companies mentioned in this article.
Charts provided by the author.
Michael Ballanger Disclaimer: This letter makes no guarantee or warranty on the accuracy or completeness of the data provided. Nothing contained herein is intended or shall be deemed to be investment advice, implied or otherwise. This letter represents my views and replicates trades that I am making but nothing more than that. Always consult your registered advisor to assist you with your investments. I accept no liability for any loss arising from the use of the data contained on this letter. Options and junior mining stocks contain a high level of risk that may result in the loss of part or all invested capital and therefore are suitable for experienced and professional investors and traders only. One should be familiar with the risks involved in junior mining and options trading and we recommend consulting a financial adviser if you feel you do not understand the risks involved.