Eurozone CPI Surprises Higher

By Orbex

USD Climbing

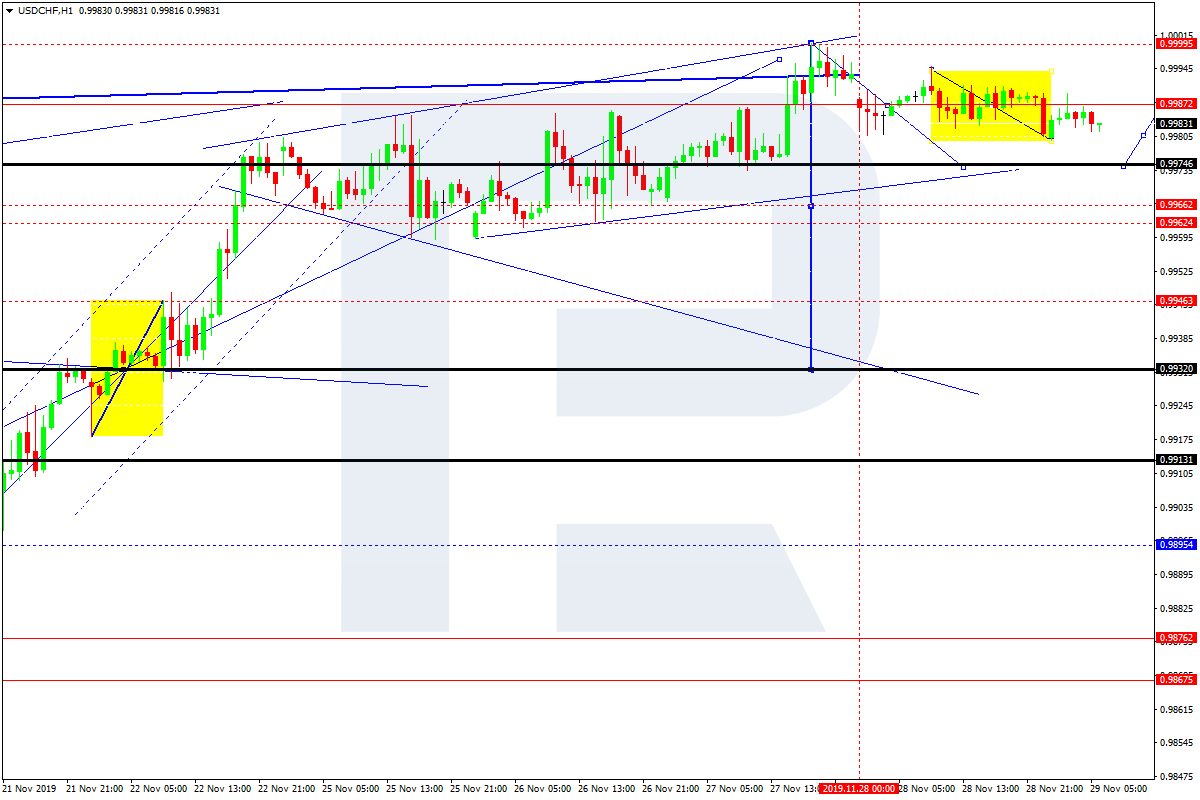
The US dollar has been higher again today as the USD index continues to try and break out above recent highs, trading 98.32 last. Comments from Fed’s Powell earlier in the week have kept USD supported, backing up the view that the Fed will stay on hold in the near term. Expectations around a potential US/China trade deal continue to drive price action due to the moves in equities prices, which have softened a little over early trading on Friday.

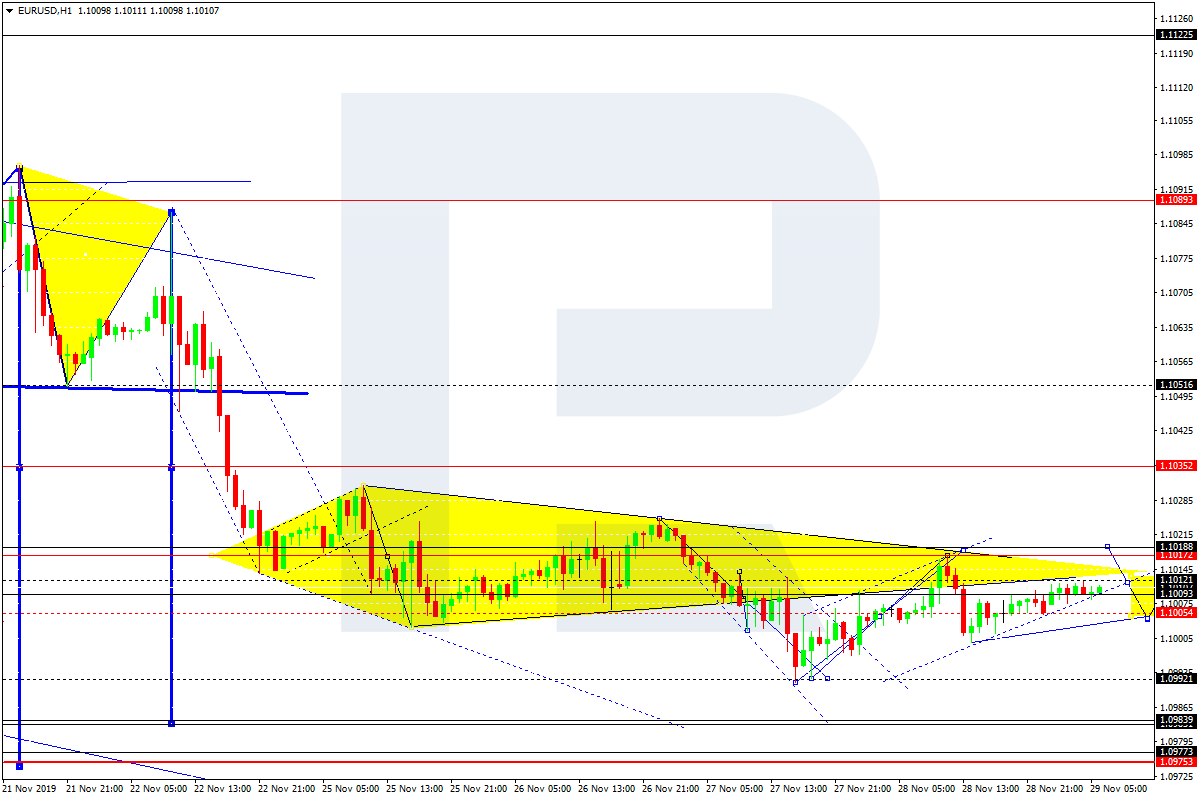
Eurozone CPI Sees Upside Surprise

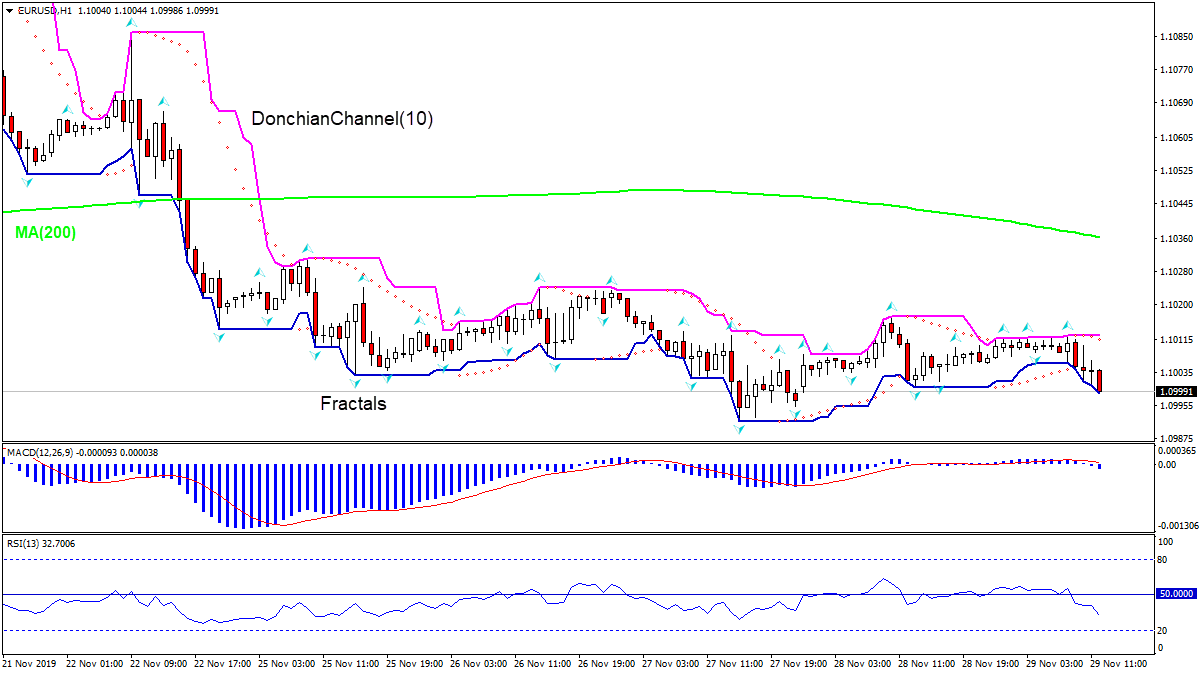
EURUSD has been under pressure today, as strength in the US dollar continues to weigh on the single currency. The latest CPI flash estimate for November came in higher than expected at 1% but still only halfway to the ECB’s 2% target, highlighting the remaining weakness in the economy. EURUSD trades 1.1004 last following some post-release volatility.
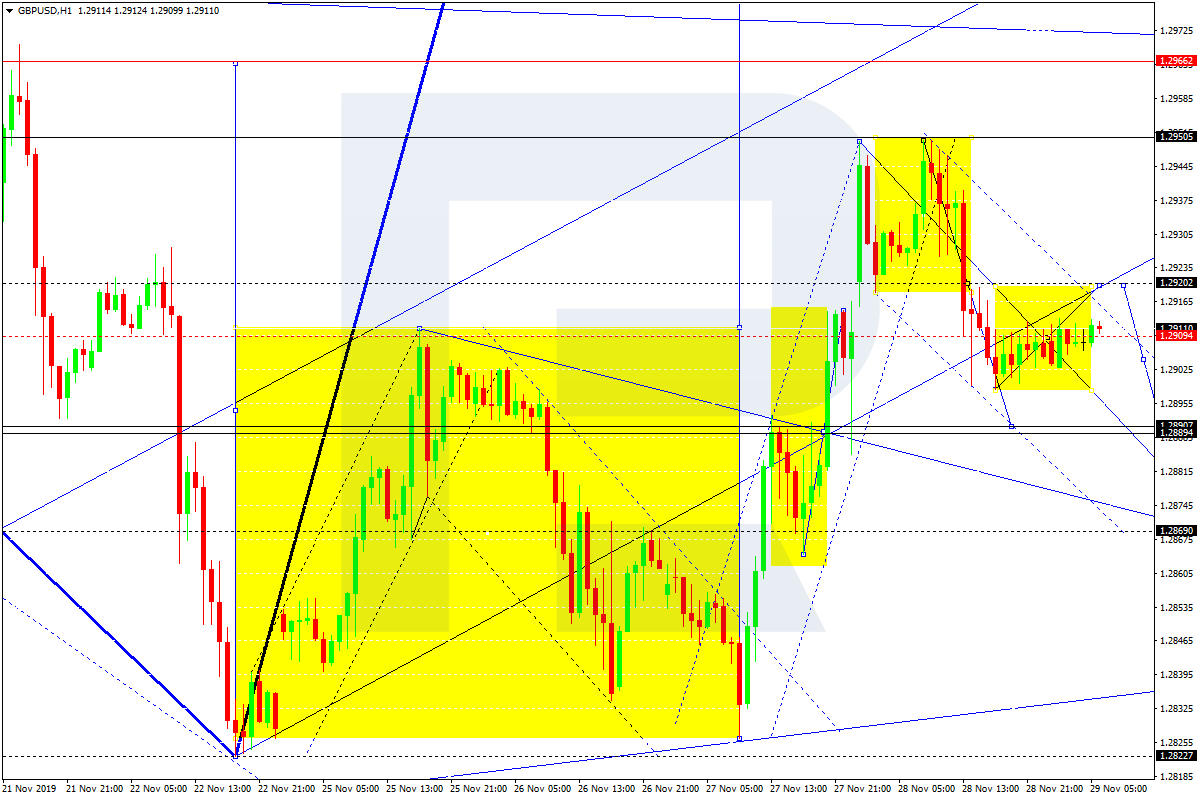
GBP Under Pressure

GBPUSD has been under pressure today as ongoing fluctuations in UK elections polls keep are fuelling uncertainty. The latest polls show the Conservative party are still in the lead, though without an overall majority as yet, meaning that a hung parliament is still the most likely outcome. GBPUSD trades 1.2887 last still above the 1.2782 level for now.

Risk Appetite Softens on Friday

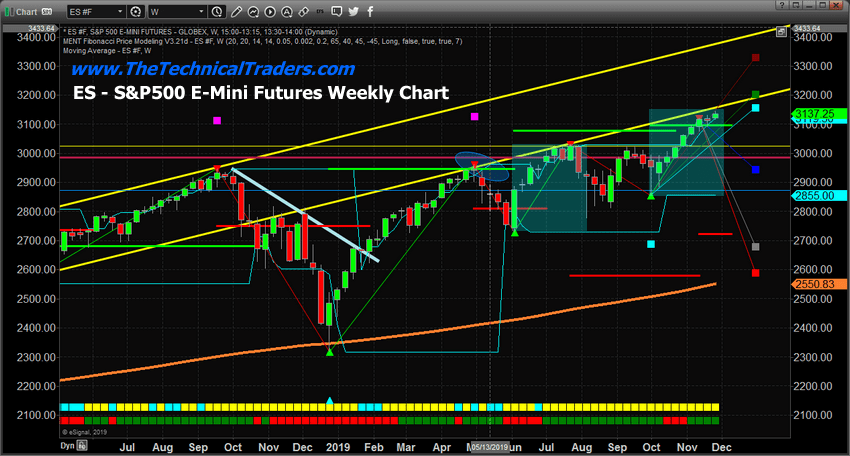
Risk assets have softened a little over the last 24 hours as traders pair some risk into the US Thanksgiving weekend. Recent commentary from both sides has been supportive, encouraging expectations that a trade deal is due in the coming weeks. However, news that the US has backed a bill supporting the rights of Hong Kong protestors has added some risk given the division between the US and China over the issue. SPX500 trades 3146.73 last.

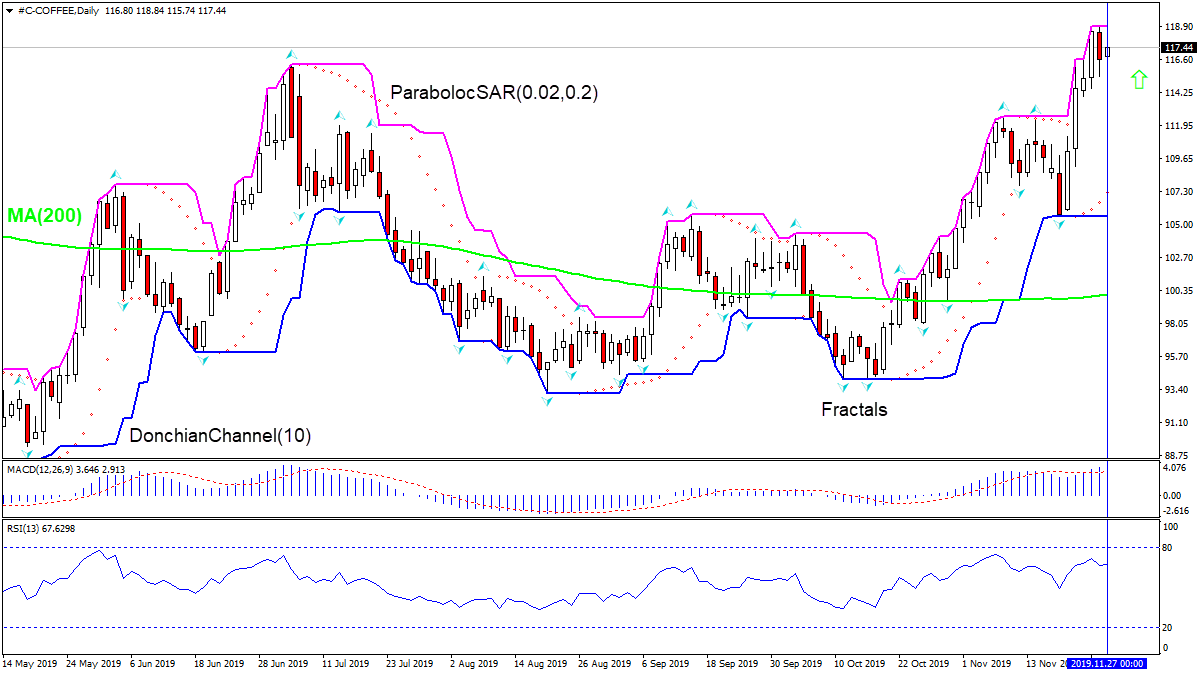
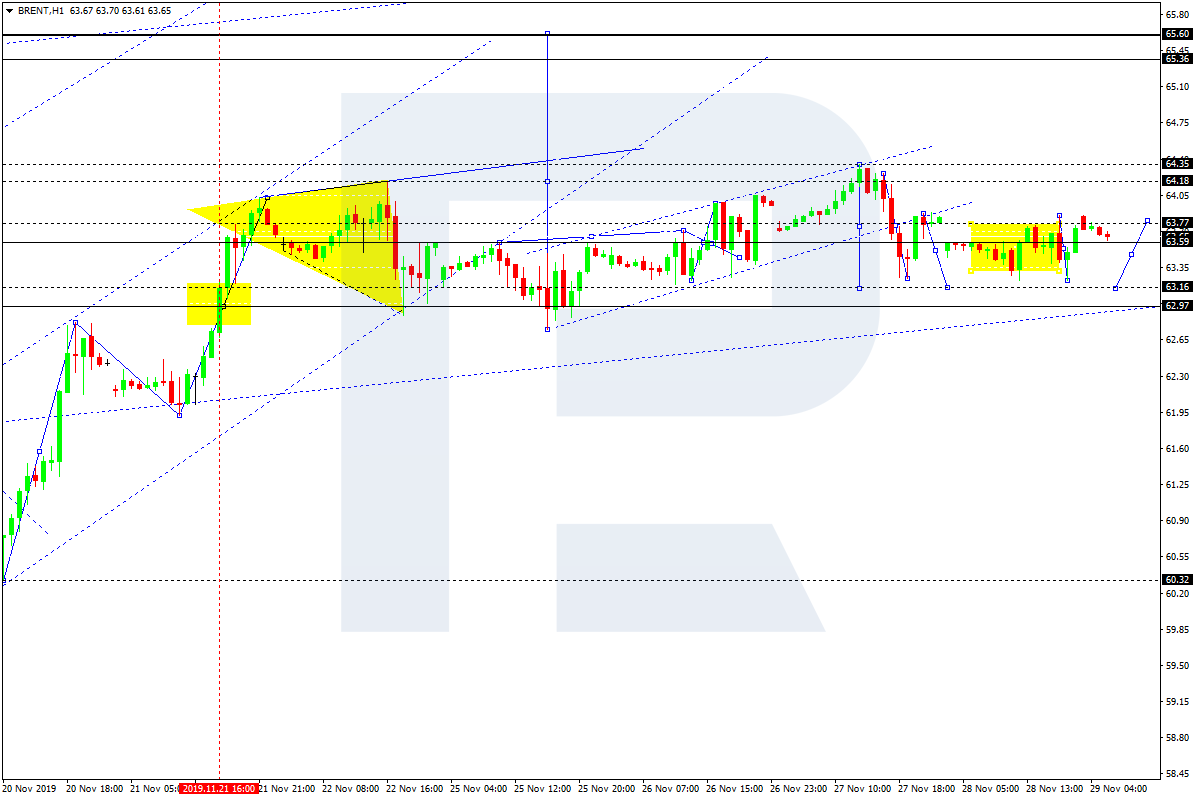
Oil Flat Following Bearish EIA Report

Oil prices have remained resilient into the end of the week. The EIA reported a further build in USD crude stores this week along with yet another record high in US crude production. The US & China expected to agree to a trade deal, however, and with OPEC expected to announce further production restrictions next week, crude has been able to offset downside. Crude trades 58.05 last.

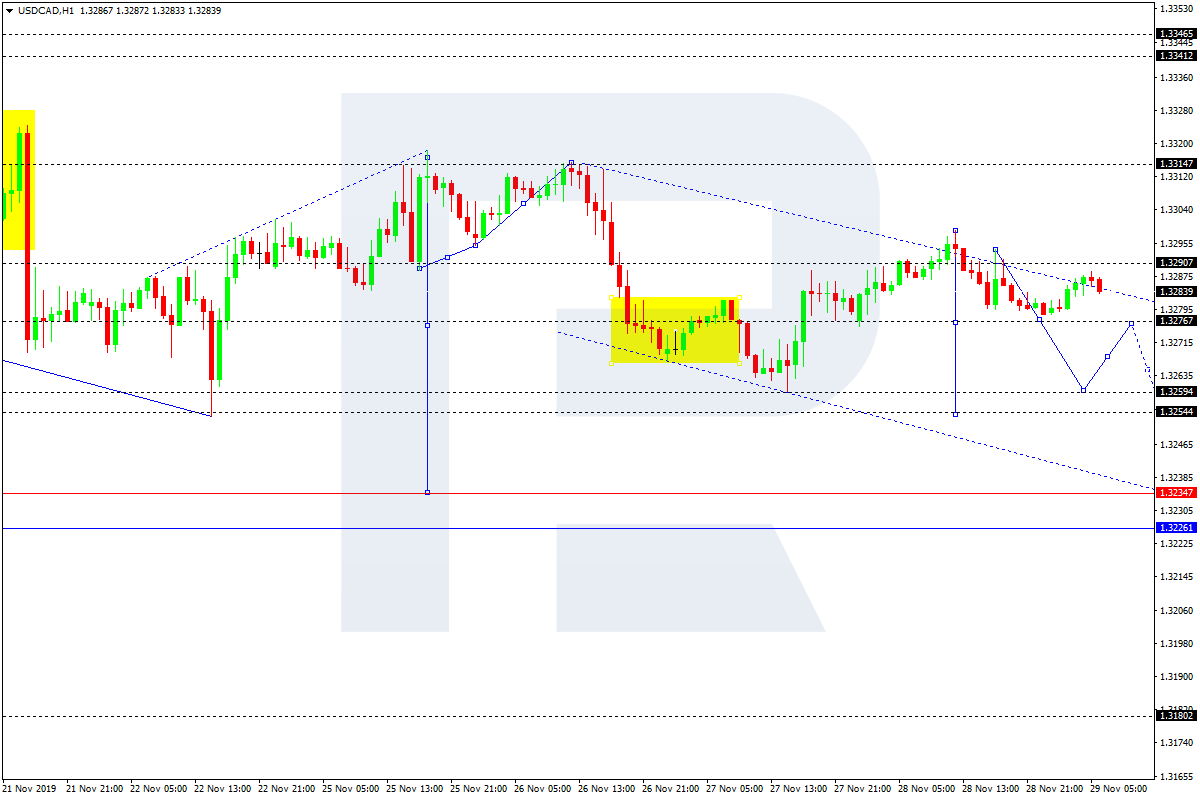
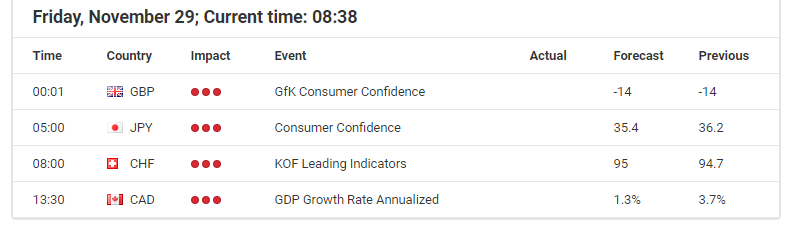
Loonie Trading Higher

USDCAD has been a little higher today, given the strength in USD and subdued oil prices over the morning. Looking ahead today, CAD traders will be focusing on domestic GDP which is forecast to remain unchanged at 0.1% on the month. Any weakness might see a lift in BOC easing expectations ahead of the December meeting next week. USDCAD trades 1.3291 last.

AUD a Little Lower

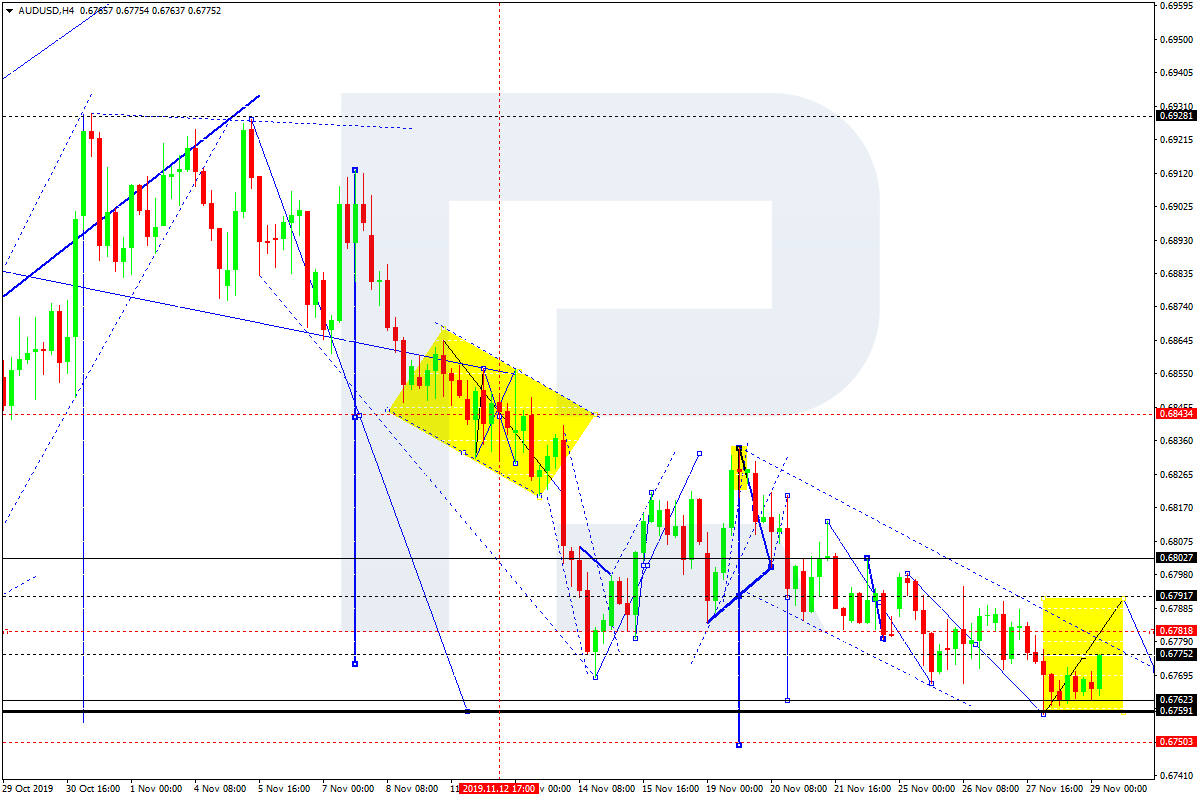
AUDUSD trades .6777 last. Seeing some softening over the morning so far as risk appetite has waned a little into the end of the week. The RBA meeting next week is not expected to see the RBA cut rates though traders will be keen to hear the bank’s latest assessment in light of recent comments regarding QE by Governor Lowe.


By Orbex

EURUSD Analysis: Euro-zone CPI rise bullish for EURUSD

By IFCMarkets

Euro-zone CPI rise bullish for EURUSD

Euro-zone annual inflation rose to 1.0% in November from 0.7% in October, according to a Eurostat flash estimate. Will the EURUSD rise?

EURUSD falling below MA(200)

The price chart on 1-hour timeframe shows EURUSD: H1 is trading sideways. The price is falling below the 200-period moving average MA(200) which is falling. And the RSI oscillator is below 50 level and has not reached the oversold zone. There is no trend yet formed, traders have to decide when it would be a best time to enter the market.

Market Analysis provided by IFCMarkets

COFFEE Analysis: Slower Honduras harvest bullish for coffee price

By IFCMarkets

Slower Honduras harvest bullish for coffee price

Coffee harvesting in Honduras has slowed due to dry weather. Will the coffee prices continue rising?

International Coffee Organization forecast last month that world coffee production in 2019-20 marketing year will decline by 0.9%, to about 10 million metric tons. A 2.7% decline in arabica production was stated as the main reason. Arabica output is estimated to hit the lowest level since 2015-16, according to ICO. And recently coffee prices are on the rise due to a slowdown in coffee harvesting in Honduras, the third-largest producer of arabica coffee in the world. The extremely dry conditions in Honduras are to blame for slow harvest. On the other hand, ICO estimates coffee demand is expected to rise globally, led by 3% consumption increase in Asia and the Pacific region. Strong demand and tighter supply estimates are bullish for coffee prices.

COFFEE:D1 is rising above MA(200) 11/29/2019 Technical Analysis IFC Markets chart

On the daily timeframe the COFFEE: D1 is above the 200-day moving average MA(200) which is level .

  • The Parabolic indicator gives a buy signal.
  • The Donchian channel indicates no trend: it is flat.
  • The MACD indicator gives a bullish signal: it is above the signal line and the gap is widening.
  • The RSI oscillator is rising but has not reached the overbought zone.

We believe the bullish momentum will continue as the price breaches above the upper Donchian boundary at 118.95. A pending order to buy can be placed above that level. The stop loss can be placed below the last fractal high at 112.36. After placing the order, the stop loss is to be moved every day to the next fractal low, following Parabolic signals. Thus, we are changing the expected profit/loss ratio to the breakeven point. If the price meets the stop loss level 112.36) without reaching the order (118.95), we recommend cancelling the order: the market has undergone internal changes which were not taken into account.

Technical Analysis Summary

OrderBuy
Buy stopAbove 118.95
Stop lossBelow 112.36

Market Analysis provided by IFCMarkets

Tajikistan cuts rate another 100 bps as inflation eases

By CentralBankNews.info
Tajikistan’s central bank cut its benchmark refinancing rate by another 100 basis points as inflation continued to decline in October due to the short-term drop in the price of domestic food products.
The National Bank of Tajikistan cut its rate to 12.25 percent and has now cut it by a net 175 basis points this year following a 150-basis point cut in May when it reversed course after raising the rate by 75 points in February.
The central bank said it expects an increase in capital flows and thus the exchange rate partly due to the U.S. Federal Reserve’s policy stance which should strengthen the national currency and help stabilize inflation, which is expected to remain within the target level in the medium term.
Tajikistan’s inflation rate accelerated in the first half of this year to hit 8.8 percent in May and remained high until September until it dropped to 8.1 percent and then 7.3 percent in October.
Tajikistan’s central bank currently targets inflation of 7.0 percent, plus/minus 2 percentage points but has lowered the 2020 target to 6.0 percent, plus/minus 2 percentage points.
Tajikistan’s gross domestic product grew 7.2 percent in the first nine months of the year, down from 7.5 percent in the first six months.
Tajikistan’s currency the somoni, which replaced the Tajikistani ruble in 2000, has been steadily depreciating since 2014 and was trading at 9.69 to the U.S. dollar today, down 2.7 percent this year  and down 9 percent since the start of 2018.
Dollarization of citizens deposits has been declining in recent years and has fallen to around 50 percent of deposits this year from over 70 percent in 2016.

www.CentralBankNews.info


100% Measured Moves May Signal A Top

By TheTechnicalTraders.com

One type of Fibonacci price structure we use to attempt to measure price trends and identify potential tops/bottoms is the “100% Measured Move” structure.  This is a price structure where a previous price move is almost perfectly replicated in a subsequent price trend after a brief period of retracement or price correction.  These types of patterns happen all the time in various forms across multitudes of symbols to create very solid trading signals for those that are capable of identifying trends and opportunities using this technique. If you want my daily analysis and trade ideas, be sure to get my updates by joining my free trend signals email list.

The first thing we look for is a strong price trend or the initially confirmed reversal of a price trend.  We find that these trending price ranges and initial “impulse trends” tend to prompt 100% measured moves fairly accurately.  The explosive middle-trend is where one can’t assume any type of Fibonacci 100% measured move will happen.  Those explosive moves in a trend that tend to happen in the middle of a price trend are what we call the “expansion wave” of a trend and will typically be 160% or more the size of the initial impulse trend.

These trade setups we call the “100% measured moves” are naturally occurring price rotations that skilled traders can use to identify strong trade potential setups.  They are more common in rotating markets where a moderate trend bias is in place (for example in the current YM or ES chart).

First, let’s take a look at this YM Weekly Chart to highlight the most recent 100% Measured Move.  The original upside price move between June 2019 and July 2019 resulted in a 2787 point price rally that replicated between August 2019 and November 2019 – after a brief price retracement.  Currently, price is rotating near the peak of this 100% measured price move near 27,875 while attempting to set up a new price trend.

In this ES Weekly example chart, we see a 100% Measured Move that originated in June 2019 and ended in July 2019 – just like on the YM chart.  Although the completion of the 100% measured move didn’t originate until the low that formed before price rallied to take out the previous high near 3029.50.  Remember, the other facets of Fibonacci price theory are also still at play in the markets while these 100% Measured Moves are taking place.  Thus, rotation between a previous price peak and valley (without establishing any new price highs or new price low) are considered “price rotation” – not trending.  The 100% Measured Move that did take place recently did complete a full 100% advancement and is now stalling near the 3040 level peak.

If you are not familiar with some of my forecasting and trading strategies for trading the S&P 500, or my gold trading signals be sure to click those links to see some pretty interesting charts like these.

SP500 Index Trend Identification and Trade Signal System

Cycle and Price Prediction System

Concluding Thoughts:

Once these 100% measured moves complete, price usually attempts to stall or wash out a bit before attempting to establish a new price trend.  At this point, given the examples we’ve illustrated, we believe the US market will enter a period of rotation and moderate volatility as these 100% measured moves have completed the upside price advance for now.  Some level of price rotation after these 100% measured moves have completed will potentially allow for another attempt at a future 100% price advance after setting up a new price leg.

These techniques don’t always work, we recently got stopped out on a TVIX (vix/volatility trade for a loss) but we just close out our thirst natural gas trade for a quick 7% profit. The previous UGAZ trade netted 20%, and the one before that was 7.95%.

I can tell you that huge moves are about to start unfolding not only in metals, but stocks, and currencies. Some of these supercycles are going to last years. Brad Matheny goes into great detail with his simple to understand charts and guide about this. His financial market research is one of a kind and a real eye-opener. PDF guide: 2020 Cycles – The Greatest Opportunity Of Your Lifetime

As a technical analysis and trader since 1997, I have been through a few bull/bear market cycles. I believe I have a good pulse on the market and timing key turning points for both short-term swing trading and long-term investment capital. The opportunities are massive/life-changing if handled properly.

I urge you to visit my Wealth Building Newsletter and if you like what I offer, join me with the 1 or 2-year subscription to lock in the lowest rate possible with our BLACK FRIDAY offer, PLUS get a FREE BAR OF GOLD and ride my coattails as I navigate these financial markets and build wealth while others lose nearly everything they own during the next set of crisis’.

Chris Vermeulen – TheTechnicalTraders.com


Forex Technical Analysis & Forecast 29.11.2019 (EURUSD, GBPUSD, USDCHF, USDJPY, AUDUSD, USDRUB, USDCAD, GOLD, BRENT, BTCUSD)

Article By RoboForex.com

EURUSD, “Euro vs US Dollar”

EURUSD is still consolidating around 1.1000. Possibly, today the pair may expand the range towards 1.1018 and then return to 1.1000. After breaking this level to the downside, the instrument may continue trading inside the downtrend with the short-term target at 1.0984.

EURUSD
Risk Warning: the result of previous trading operations do not guarantee the same results in the future

GBPUSD, “Great Britain Pound vs US Dollar”

GBPUSD is consolidating around 1.2909. Today, the pair may form one more ascending structure to reach 1.2920 and then start a new decline towards 1.2889.

GBPUSD
Risk Warning: the result of previous trading operations do not guarantee the same results in the future

USDCHF, “US Dollar vs Swiss Franc”

USDCHF is consolidating around 0.9988. Possibly, the pair may form a new descending structure towards 0.9974 and then resume growing to return to 0.9988. If later the price breaks this range to the downside, the market may continue the correction with the target at 0.9932.

USDCHF
Risk Warning: the result of previous trading operations do not guarantee the same results in the future

USDJPY, “US Dollar vs Japanese Yen”

USDJPY is still consolidating around 109.44. Possibly, today the pair may fall to break 109.32 and then start a new correction with the short-term target at 109.05.

USDJPY
Risk Warning: the result of previous trading operations do not guarantee the same results in the future

AUDUSD, “Australian Dollar vs US Dollar”

AUDUSD is consolidating above 0.6760. If the price breaks the descending channel at 0.6780, the market may start a new correction with the first target at 0.6792.

AUDUSD
Risk Warning: the result of previous trading operations do not guarantee the same results in the future

USDRUB, “US Dollar vs Russian Ruble”

USDRUB has reached its upside target; right now, it is correcting towards 63.89. After that, the instrument may form one more ascending structure to reach 64.04 and then continue trading inside the downtrend with the short-term target at 63.61.

USDRUB
Risk Warning: the result of previous trading operations do not guarantee the same results in the future

USDCAD, “US Dollar vs Canadian Dollar”

USDCAD is still consolidating above 1.3276. Possibly, today the pair may break this level to the downside and continue trading inside the downtrend with the short-term target at 1.3254.

USDCAD
Risk Warning: the result of previous trading operations do not guarantee the same results in the future

XAUUSD, “Gold vs US Dollar”

Gold is consolidating below 1458.15. Today, the pair may choose an alternative scenario to break this level to the upside and start a new correction towards 1462.50. However, the main scenario implies that the price may continue falling with the target at 1444.00.

GOLD
Risk Warning: the result of previous trading operations do not guarantee the same results in the future

BRENT

Brent continues consolidating below 63.77. Today, the pair may fall to reach 63.16 and then start another growth towards 64.40. If later the price breaks this level to the upside, the market may continue trading inside the uptrend with the short-term target at 65.50.

BRENT
Risk Warning: the result of previous trading operations do not guarantee the same results in the future

BTCUSD, “Bitcoin vs US Dollar”

BTCUSD is consolidating around 7487.00. Possibly, today the pair may continue the correction towards 7333.00 and then start a new growth to break 7645.00ю Later, the market may continue trading upwards with the short-term target at 7980.00.

BITCOIN

Article By RoboForex.com

Attention!
Forecasts presented in this section only reflect the author’s private opinion and should not be considered as guidance for trading. RoboForex LP bears no responsibility for trading results based on trading recommendations described in these analytical reviews.

Japanese Candlesticks Analysis 29.11.2019 (GOLD, NZDUSD)

Article By RoboForex.com

XAUUSD, “Gold vs US Dollar”

As we can see in the H4 chart, the ascending tendency continues. By now, XAUUSD has completed several reversal patterns, including Hammer, close to the support level. In general, the situation hasn’t changed much. At the moment, the pair is still reversing and may later grow towards 1475.50. At the same time, we shouldn’t exclude an opposite scenario, which implies that the instrument may continue falling towards 1445.50.

XAUUSD
Risk Warning: the result of previous trading operations do not guarantee the same results in the future

NZDUSD, “New Zealand vs. US Dollar”

As we can see in the H4 chart, the ascending channel continues. After forming several reversal patterns, including Doji, near the support level, NZDUSD has reversed; right now, it is moving sideways in the middle of the channel. After that, the market may complete another slight correction, which may later be followed by further growth to reach 0.6455. At the same time, one shouldn’t exclude an opposite scenario, according to which the instrument may fall towards 0.6385 and test the channel’s downside border.

NZDUSD

Article By RoboForex.com

Attention!
Forecasts presented in this section only reflect the author’s private opinion and should not be considered as guidance for trading. RoboForex LP bears no responsibility for trading results based on trading recommendations described in these analytical reviews.

Investors Expect Counter Measures from China

by JustForex

The US dollar is being traded without significant changes against a basket of currencies. Yesterday, the dollar index (#DX) closed in the green zone (+0.01%). Relations between China and the US are still in the spotlight after D. Trump signed two bills supporting anti-government protesters in Hong Kong. So, US President Donald Trump signed into law on human rights and democracy, which provides for the annual verification of the autonomous status of Hong Kong. Also, Hong Kong and the United States will now have a special relationship regime. Special status implies that Hong Kong will not be subject to the sanctions and duties that are imposed on China.

In response to the steps by US President, China promised to take strict measures. However, so far, no steps have been made. The conclusion of a trade agreement between the United States and China is likely to be at risk. China has largely adhered to a policy of “strategic calm.”

The “black gold” prices have risen slightly. Currently, futures for the WTI crude oil are testing the $58.00 mark per barrel.

Market Indicators

Yesterday, the US stock markets were closed due to Thanksgiving.

The 10-year US government bonds yield has not changed. At the moment, the indicator is at the level of 1.76-1.77%.

The Economic News Feed for 29.11.2019:
  • – German unemployment change at 10:55 (GMT+2:00);
  • – Consumer price index in the Eurozone at 12:00 (GMT+2:00);
  • – Canada GDP at 15:30 (GMT+2:00).

by JustForex

The Analytical Overview of the Main Currency Pairs on 2019.11.29

by JustForex

The EUR/USD currency pair

Technical indicators of the currency pair:
  • Prev Open: 1.09992
  • Open: 1.10122
  • % chg. over the last day: +0.01
  • Day’s range: 1.10069 – 1.10136
  • 52 wk range: 1.0884 – 1.1623

The EUR/USD currency pair is still in sideways movement. Financial market volatility was reduced due to Thanksgiving in the United States. The technical pattern is ambiguous. Negotiations between China and the United States remain in the spotlight. US President Donald Trump has signed two bills that support anti-government protesters in Hong Kong. Investors are now awaiting China’s response. Currently, the key support and resistance levels are 1.100000 and 1.10200, respectively. Open positions from these marks.

The Economic News Feed for 29.11.2019:

  • – German Unemployment Change (GER) – 10:55 (GMT+2:00);
  • – Consumer Price Index (EU) – 12:00 (GMT+2:00);
EUR/USD

The indicators do not give accurate signals: the price is trading between 50 MA and 100 MA.

The MACD histogram is near the 0 mark, which also does not give signals.

The Stochastic Oscillator is in the neutral zone, the %K line crosses the %D line. There are no signals.

Trading recommendations
  • Support levels: 1.10000, 1.09850
  • Resistance levels: 1.10200, 1.10400, 1.10650

If the price consolidates below the round level of 1.10000, expect the quotes to fall toward 1.09700-1.09600.

Alternatively, the quotes could grow toward 1.10400-1.10650.

The GBP/USD currency pair

Technical indicators of the currency pair:
  • Prev Open: 1.28542
  • Open: 1.29092
  • % chg. over the last day: -0.08
  • Day’s range: 1.29072 – 1.29175
  • 52 wk range: 1.1959 – 1.3385

The GBP/USD currency pair retreated from local highs. At the moment, quotes are moving in flat. The technical pattern is ambiguous. Market participants are waiting for new information regarding the Brexit process. At the moment, the key support and resistance levels are 1.29000 and 1.29350, respectively. We recommend opening positions from these marks.

The Economic News Feed for 29.11.2019 is calm.

GBP/USD

Indicators do not provide accurate signals: 50 MA has crossed 100 MA.

The MACD histogram is close to 0, which also does not give signals.

The Stochastic Oscillator is in the neutral zone, the %K line is below the %D line, which indicates a bearish sentiment.

Trading recommendations
  • Support levels: 1.29000, 1.28700, 1.28400
  • Resistance levels: 1.29350, 1.29700

If the price consolidates above 1.29350, expect the quotes to rise toward 1.29700-1.29850.

Alternatively, the quotes could fix below 1.29000 and descend toward 1.28700-1.28400.

The USD/CAD currency pair

Technical indicators of the currency pair:
  • Prev Open: 1.32821
  • Open: 1.32805
  • % chg. over the last day: +0.00
  • Day’s range: 1.32804 – 1.32872
  • 52 wk range: 1.2727 – 1.3664

The technical pattern on the USD/CAD currency pair is still ambiguous. Looney is in lateral movement. Local levels of support and resistance are still: 1.32800 and 1.33000, respectively. Participants in financial markets expect additional drivers. Today will be published important economic statistics in Canada. Open positions from key levels.

The Economic News Feed for 29.11.2019:

  • – GDP Report (CAD) – 15:30 (GMT+2:00);
USD/CAD

Indicators do not give accurate signals: the price has crossed 50 MA and 100 MA.

The MACD histogram is near the 0 mark, which also does not give signals.

The Stochastic Oscillator is in the neutral zone, the %K line is below the %D line, which indicates a bearish sentiment.

  • Support levels: 1.32800, 1.32650, 1.32400
  • Resistance levels: 1.33000, 1.33200, 1.33350

If the price consolidates above 1.33000, expect the quotes to rise toward 1.33200-1.33400.

Alternatively, the quotes could descend toward 1.32600-1.32400.

The USD/JPY currency pair

Technical indicators of the currency pair:
  • Prev Open: 109.549
  • Open: 109.512
  • % chg. over the last day: -0.04
  • Day’s range: 109.484 – 109.556
  • 52 wk range: 104.97 – 114.56

The USD/JPY currency pair is being traded in a flat. Investors expect additional drivers. We recommend you to keep track of current information regarding trade negotiations between the United States and China. The key support and resistance levels are 109.400 and 109.600, respectively. We recommend you to pay attention to the dynamics of yield on US government bonds. Open positions from key levels.

The Economic News Feed for 29.11.2019 is calm.

USD/JPY

Indicators point to the power of buyers: the price has fixed above 50 MA and 100 MA.

The MACD histogram is in the positive zone, but below the signal line, which gives a weak signal to buy USD/JPY.

The Stochastic Oscillator is in the neutral zone, the %K line is above the %D line, which gives a signal to buy USD/JPY.

Trading recommendations
  • Support levels: 109.400, 109.200, 109.050
  • Resistance levels: 109.600, 110.000

If the price consolidates above 109.600, expect further growth toward 110.000.

Alternatively, the quotes could fall below 109.400 and eventually decline to 109.200-109.000.

by JustForex

Black Friday and subdued volatility: calm before the storm for the USD/JPY?

By Admiral Markets

Economic Event

Source: Economic Events November 29, 2019 – Admiral Markets’ Forex Calendar

While we shouldn’t expect any moments of high volatility today during shortened US trading hours (also in bonds/yields), we will project what is to come in the USD/JPY over the next week of trading.

With the ISM Manufacturing (Monday) and Non-Manufacturing (Wednesday), ADP (also on Wednesday) and Non-Farm-Payrolls (Friday), the main focus will stay on the developments in 10-year US-Treasury yields which has driven the price action in the currency pair this month.

After the US data releases over the last few weeks showed solid prints, and with market participants expecting no moves from the Fed (according to the Fed Watch Tool) at the meeting on December 11, we remain sceptical if the USD/JPY has a serious chance to stabilise significantly above 109.00.

The reason for this is that if data exceeds expectations, it could result in short-term bullish stints which are then aggressively sold off again, leaving a test of the region around 108.00 over the next week of trading a topic.

In our opinion, the same is true with underperforming data, which could result in rising expectations of a more dovish stance from the Fed, which could result in a drop in US yields since such an expectation would add to the bearish yield outlook with the Fed expanding its balance sheet at a faster rate than during QE1, QE2 or QE3.

Nevertheless, we remain cautious in regards to an overly bearish USD/JPY outlook. As we approach the yearly close, volatility should be expected to stay low and we don’t expect an aggressive attack at the region around 106.80/107.00, at least not for now, which would definitely increase chances of a sharper drop from a technical perspective, as low as 105.00 and probably even lower:

USDJPY Daily Chart

Source: Admiral Markets MT5 with MT5-SE Add-on USD/JPY Daily chart (between September 20, 2018, to November 29, 2019). Accessed: November 29, 2019, at 10:00pm GMT – Please note: Past performance is not a reliable indicator of future results, or future performance.

In 2014, the value of the USD/JPY increased by 13.7%, in 2015, it increased by 0.5%, in 2016, it fell by 2.8%, in 2017, it fell by 3.6%, in 2018, it fell by 2.7%, meaning that after five years, it was up by 4.1%.

Discover the world’s #1 multi-asset platform

Admiral Markets offers professional traders the ability to trade with a custom, upgraded version of MetaTrader 5, allowing you to experience trading at a significantly higher, more rewarding level. Experience benefits such as the addition of the Market Heat Map, so you can compare various currency pairs to see which ones might be lucrative investments, access real-time trading data, and so much more. Click the banner below to start your FREE download of MT5 Supreme Edition!

Download MetaTrader 5 and begin trading today!

Disclaimer: The given data provides additional information regarding all analysis, estimates, prognosis, forecasts or other similar assessments or information (hereinafter “Analysis”) published on the website of Admiral Markets. Before making any investment decisions please pay close attention to the following:

  1. This is a marketing communication. The analysis is published for informative purposes only and are in no way to be construed as investment advice or recommendation. It has not been prepared in accordance with legal requirements designed to promote the independence of investment research, and that it is not subject to any prohibition on dealing ahead of the dissemination of investment research.
  2. Any investment decision is made by each client alone whereas Admiral Markets shall not be responsible for any loss or damage arising from any such decision, whether or not based on the Analysis.
  3. Each of the Analysis is prepared by an independent analyst (Jens Klatt, Professional Trader and Analyst, hereinafter “Author”) based on the Author’s personal estimations.
  4. To ensure that the interests of the clients would be protected and objectivity of the Analysis would not be damaged Admiral Markets has established relevant internal procedures for prevention and management of conflicts of interest.
  5. Whilst every reasonable effort is taken to ensure that all sources of the Analysis are reliable and that all information is presented, as much as possible, in an understandable, timely, precise and complete manner, Admiral Markets does not guarantee the accuracy or completeness of any information contained within the Analysis. The presented figures refer that refer to any past performance is not a reliable indicator of future results.
  6. The contents of the Analysis should not be construed as an express or implied promise, guarantee or implication by Admiral Markets that the client shall profit from the strategies therein or that losses in connection therewith may or shall be limited.
  7. Any kind of previous or modeled performance of financial instruments indicated within the Publication should not be construed as an express or implied promise, guarantee or implication by Admiral Markets for any future performance. The value of the financial instrument may both increase and decrease and the preservation of the asset value is not guaranteed.
  8. The projections included in the Analysis may be subject to additional fees, taxes or other charges, depending on the subject of the Publication. The price list applicable to the services provided by Admiral Markets is publicly available from the website of Admiral Markets.
  9. Leveraged products (including contracts for difference) are speculative in nature and may result in losses or profit. Before you start trading, you should make sure that you understand all the risks.

By Admiral Markets