Preparing for the publication of significant statistics
This week, data on industrial production will be published in Germany.Is there a possibility for the DE30 to decline?
The Markit/BME Germany Manufacturing PMI will be released on December 2, the German Factory Orders will come out on December 5 and the German Industrial Production – on December 6. Preliminary forecasts are a bit negative. German retail sales data for October were released on Friday. They showed a 1.9% decrease compared to September, which significantly reduced the growth year over year (from 3.4% in September to 0.8% in October). Since the beginning of 2019, the DAX has grown by 25.4% and is now traded with the P/E ratio of 18.
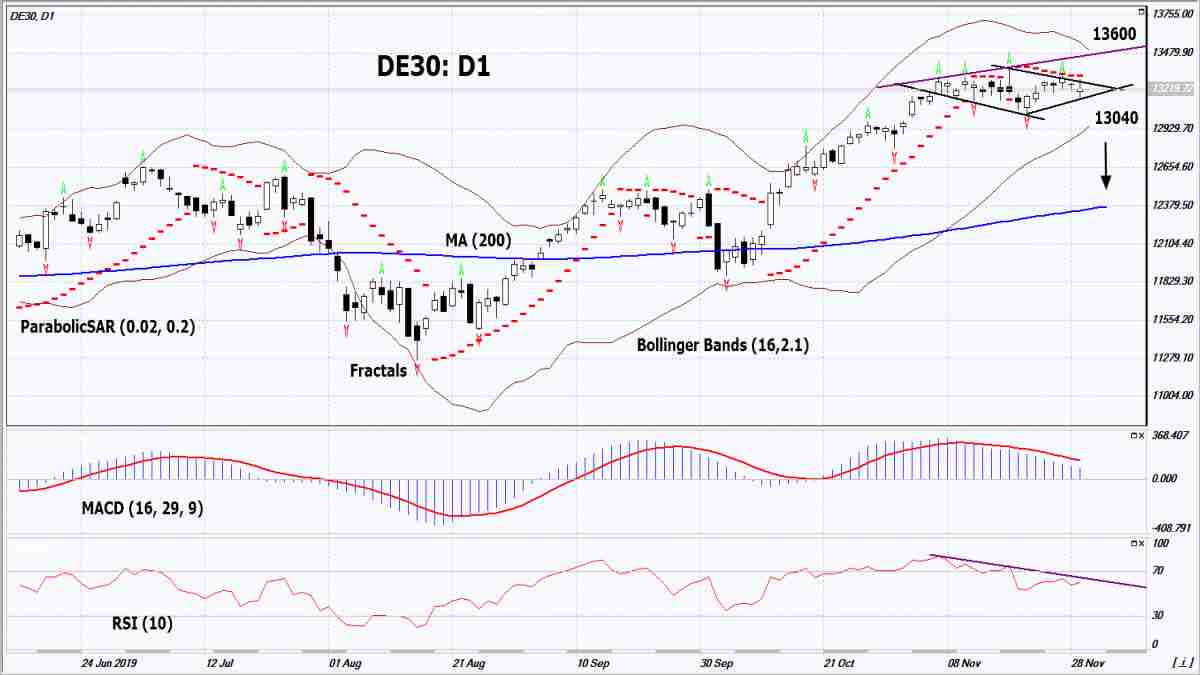
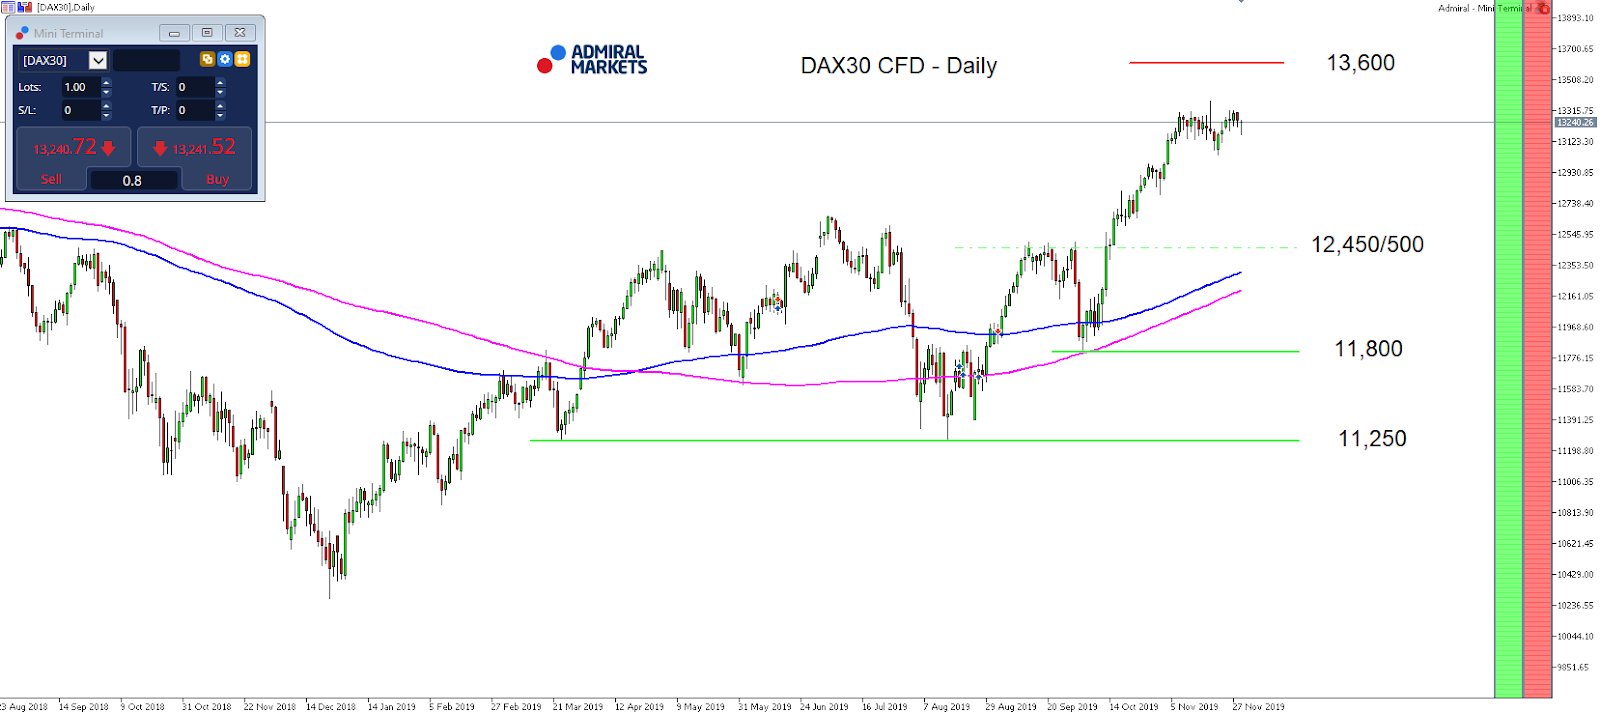
On the daily timeframe, DE30: D1 formed the figure of technical analysis “diamond”. It continues to be in an uptrend, but its growth has slowed down. A number of technical analysis indicators formed sell signals. It is possible in case of the publication of weak macroeconomic data in Germany.
The Parabolic indicator gives a bearish signal
The Bollinger bands have narrowed, which indicates low volatility. The upper Bollinger band is titled down
The RSI indicator is above 50. It has formed a negative divergence
The bearish momentum may develop in case DE30 falls below the last fractal low at 13040. This level may serve as an entry point. The initial stop loss may be placed above the two last fractal highs, the historic high, the upper Bollinger band and the Parabolic signal at 13600. After opening the pending order, we shall move the stop to the next fractal low following the Bollinger and Parabolic signals. Thus, we are changing the potential profit/loss to the breakeven point. More risk-averse traders may switch to the 4-hour chart after the trade and place there a stop loss moving it in the direction of the trade. If the price meets the stop level (13600) without reaching the order (13040), we recommend closing the position: the market sustains internal changes that were not taken into account.
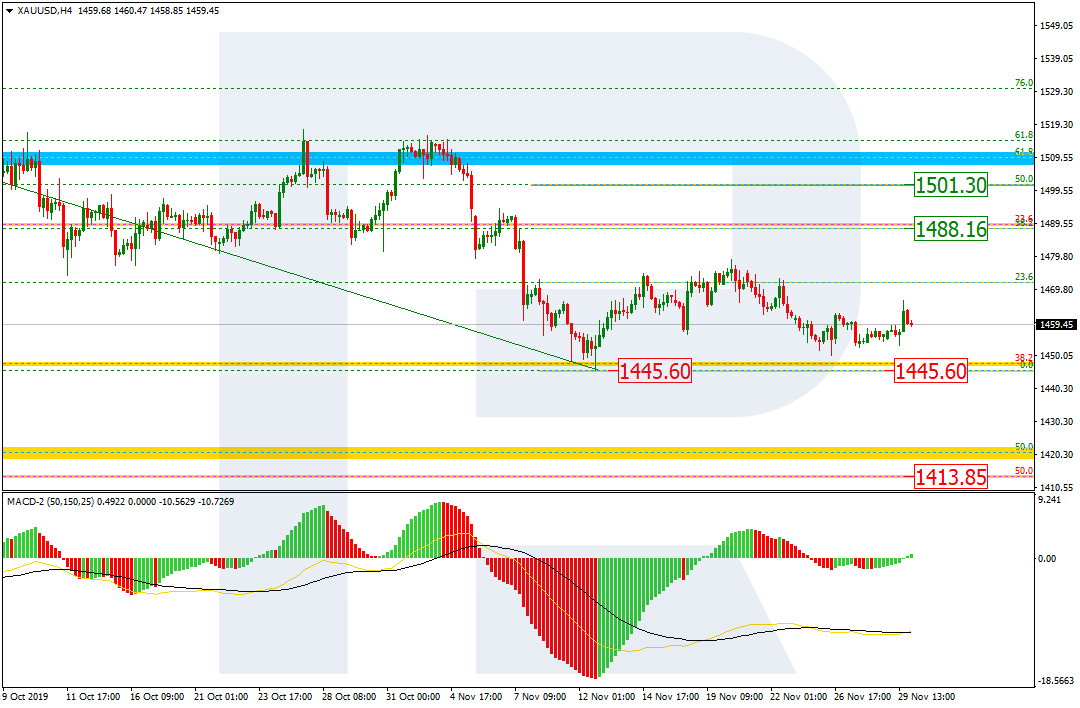
As we can see in the H4 chart, after finishing the descending wave at 38.2% fibo, XAUUSD is correcting; the first correctional wave has already reached 23.6% fib and may yet continue towards 38.2% and 50.05% fibo 1488.16 and 1501.30 respectively. Completing the correctional uptrend, the instrument may break the local low at 1445.60 and continue falling towards its mid-term target, which is 50.0% fibo at 1413.85.
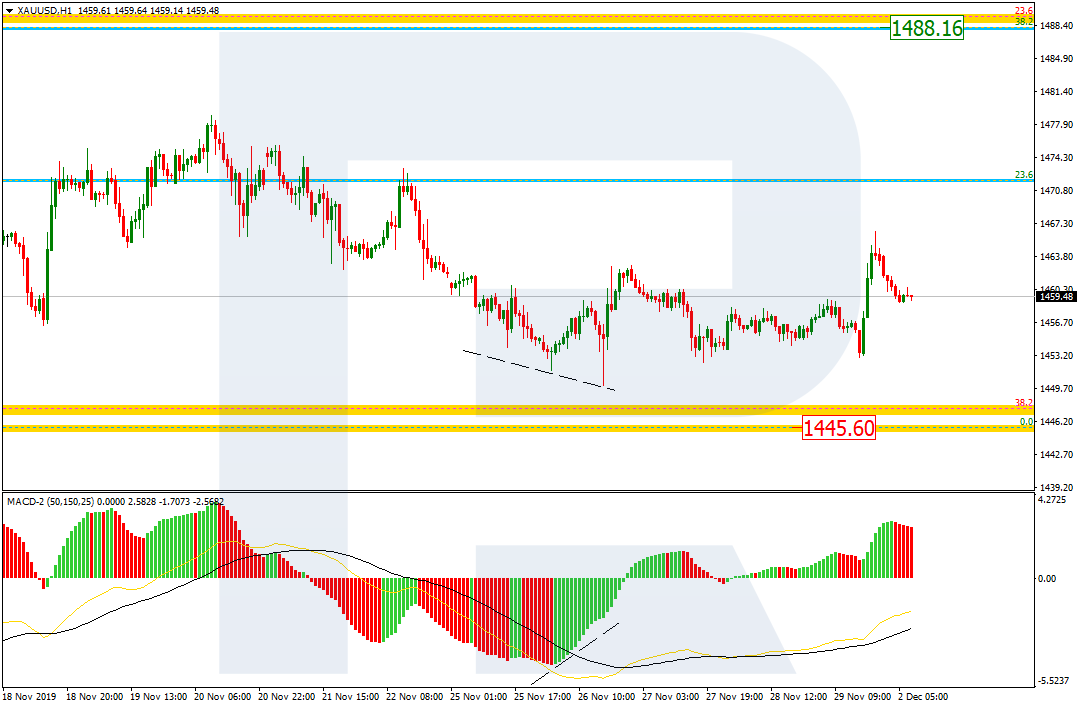
In the H1 chart, the convergence made the pair finish the descending correctional wave, thus indicating a new wave to the upside to reach 38.2% fibo at 1488.16.
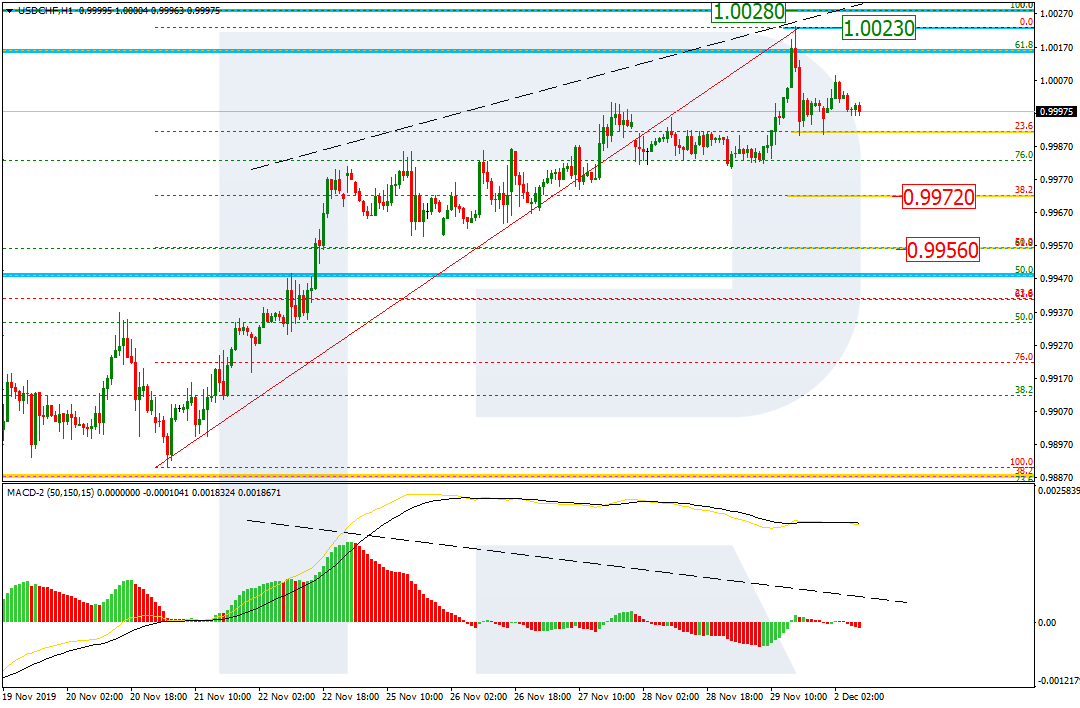
USDCHF, “US Dollar vs Swiss Franc”
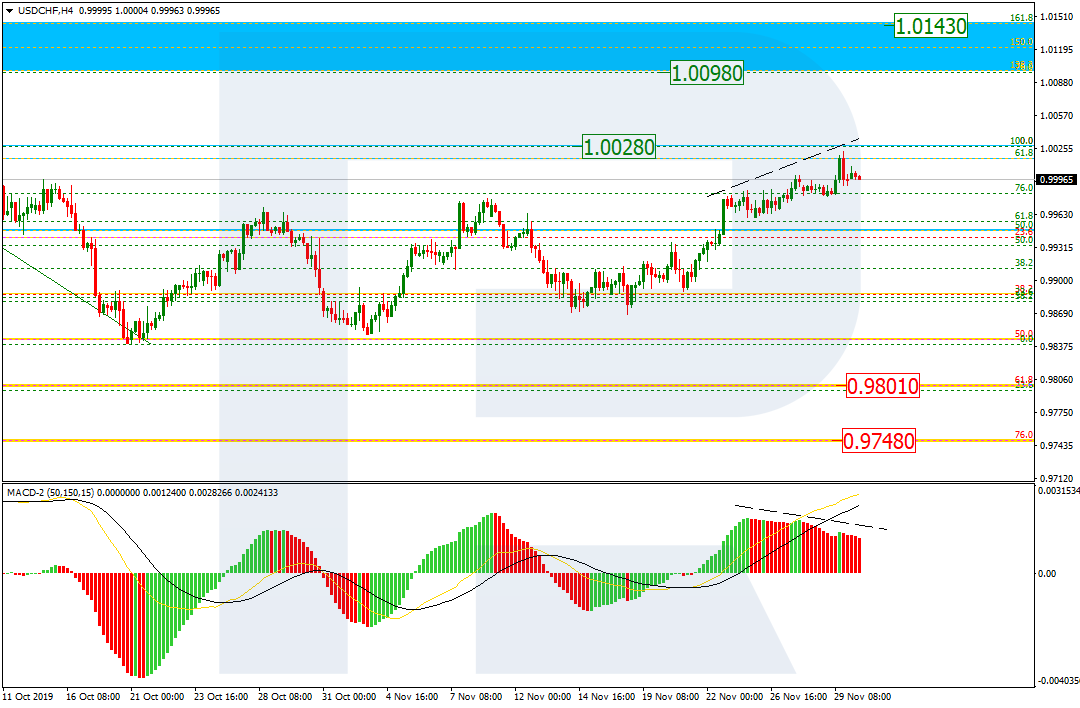
As we can see in the H4 chart, after completing the pullback at 50.0% fibo, USDCHF is growing towards the high at 1.0028. If the price breaks this level, the pair may continue growing to reach the long-term target, 76.0% fibo at 1.0098, which is inside the post-correctional extension area between 138.2% and 161.8% fibo at 1.0098 and 1.0143 respectively. At the same time, there is divergence on MACD, which may indicate a possible pullback.
In the H1 chart, the divergence made the pair start a new correction to the downside, which has already reached 23.6% fibo. The next correctional targets may be 38.2% and 50.0% fibo at 0.9972 and 0.9956 respectively. The resistance is the high at 1.0023.
Attention! Forecasts presented in this section only reflect the author’s private opinion and should not be considered as guidance for trading. RoboForex LP bears no responsibility for trading results based on trading recommendations described in these analytical reviews.
As the Thanksgiving holiday passes, traders should begin to understand that liquidity and volume in the US and global markets typically begin to diminish over the next 30 to 45+ days. Typically, between mid-November and early January, trading volumes weaken dramatically as institutional and retail investors move away from the markets in preparation for year-end celebrations and tax planning.
Historically, the month of November is vastly more positive than negative in terms of overall price action. Over the past 21 years in the NQ, a total of 15 months have resulted in an average of +122.75 pts whereas only 6 months have resulted in an average of -194.83 pts. This suggests the downside price moves, when they happen, are nearly 40% larger than the average upside price move for November. So far for 2019, the NQ is +320.25 pts for November 2019.
– Largest Monthly POS : 332.25 NEG -768 – Total Monthly NEG : -1169 across 6 bars – Avg = -194.83 – Total Monthly POS : 1841.25 across 15 bars – Avg = 122.75
——————————————–
– Total Monthly Sum : 672.25 across 21 bars Analysis for the month = 11
For December, the historical data is split evenly – 10 months show positive results and 10 months show negative results. The positive average is +129.15 and the negative average is -117.95. This data suggests that December is historically slightly more positive than negative – but overall, December is a very FLAT month for trading in the NQ.
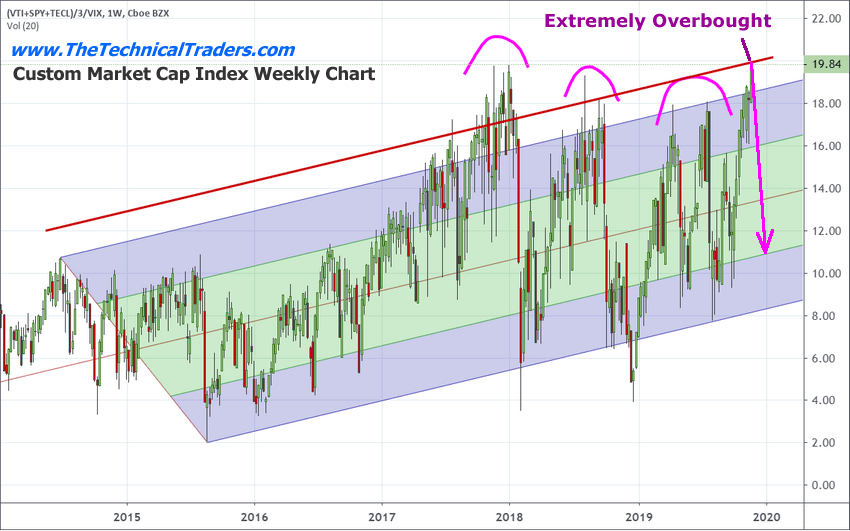
It is very likely that the recent rally in the US stock markets has reached very near to a price peak headed into the end of 2019. Our custom Market Cap Index is suggesting the US/Global markets could be setting up for a broader price rotation over the next few weeks and months.
When the Custom Market Cap Index reaches these Extreme Overbought levels, it is very common for the markets to enter a retracement period that will likely result in a downside move in the Custom Market Cap Index towards the middle “Green” area. The only time we’ve seen any type of extended upside price pressure was in late-2017 when the globe rallied after President Trump was elected expecting a boost in global economic activity. Still, if you pay attention to the rotation near this period of time, you’ll see that violent price rotation did take place just before the peak in January 2018. Take 8 seconds and enter your email address and join my free trend signals email list.
Our Adaptive Dynamic Learning (ADL) predictive modeling system is also suggesting a downside price rotation for the NQ which further validates our expectations that the US and Global markets have reached levels that are extremely overbought. We authored a research post titled “Welcome To The Zombie-Land Of Investing” in early November – prior to this melt-up price rally. You can read that article here: https://www.thetechnicaltraders.com/welcome-to-the-zombie-land-of-investing-part-ii/
We continue to believe the collapsing foreign markets have driven capital and investment into the US stock market and further investment into more mature economic markets as investors flee risks and pricing pressures throughout the world. Current news continues to support this premise and we believe the global pressures related to economic output and expectations will begin to weigh more heavily in the US stock market – specifically in regards to profitability, debt levels, and future expectations.
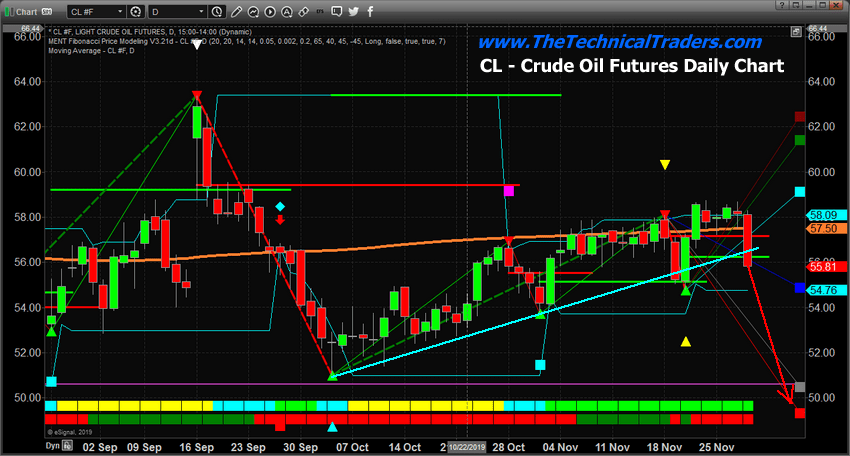
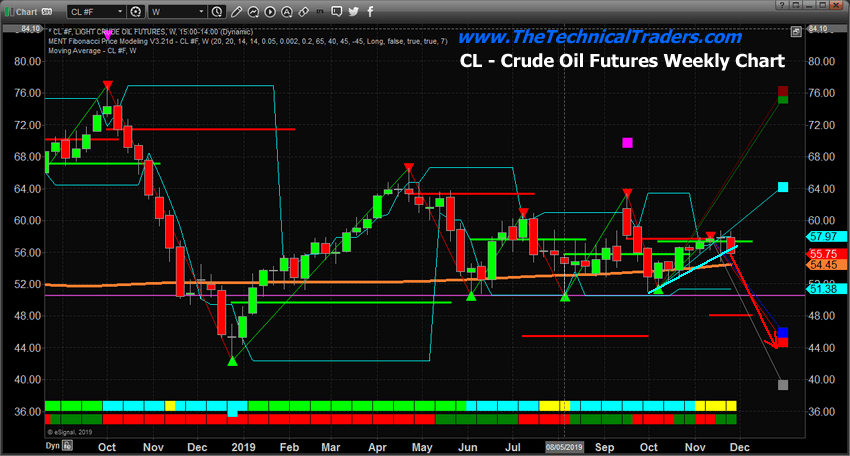
Additionally, we believe the continued collapse in Crude Oil is a very strong sign the global economy is contracting faster than anyone really expected and that continued price weakness may result in a price reversion event in the near future. We authored a number of research articles about these facets of the global markets over the past few months…
Our ADL predictive modeling system suggested Crude Oil would collapse from levels near $57~58 to levels just below $49 in November 2019. This prediction was made in early July 2019. It is amazing how our ADL predictive modeling system can see into the future like this. Now, all we are waiting for is the further price contraction in Crude Oil to our expected price levels for November. Once that sets up, then we should see a brief pause in price rotation in December 2019, then further selling in early 2020 reaching near a bottom in February or March 2020.
Demand for Crude Oil is waning dramatically near the end of 2019. There appears to be some level of chaos throughout much of the world and we believe additional uncertainty related to the US Presidential Elections, Super-Cycle events/expectations, and a mature global market contraction will continue to put demand/pricing pressures on many commodities/global markets.
The one thing we’ve been warning about for almost 14+ months is the incredible opportunity setting up in Precious Metals.
Now is the time to prepare for some of these big rotation expectations over the next 15+ months. The end of 2019 and almost all of 2020 are certain to be filled with extreme volatility, liquidity issues and more. If you are a skilled trader and want better insight into what is happening and how to profit from these fantastic setups, take a minute to see how we can provide you with winning trades to stay months ahead of these moves and ride the wave of success!
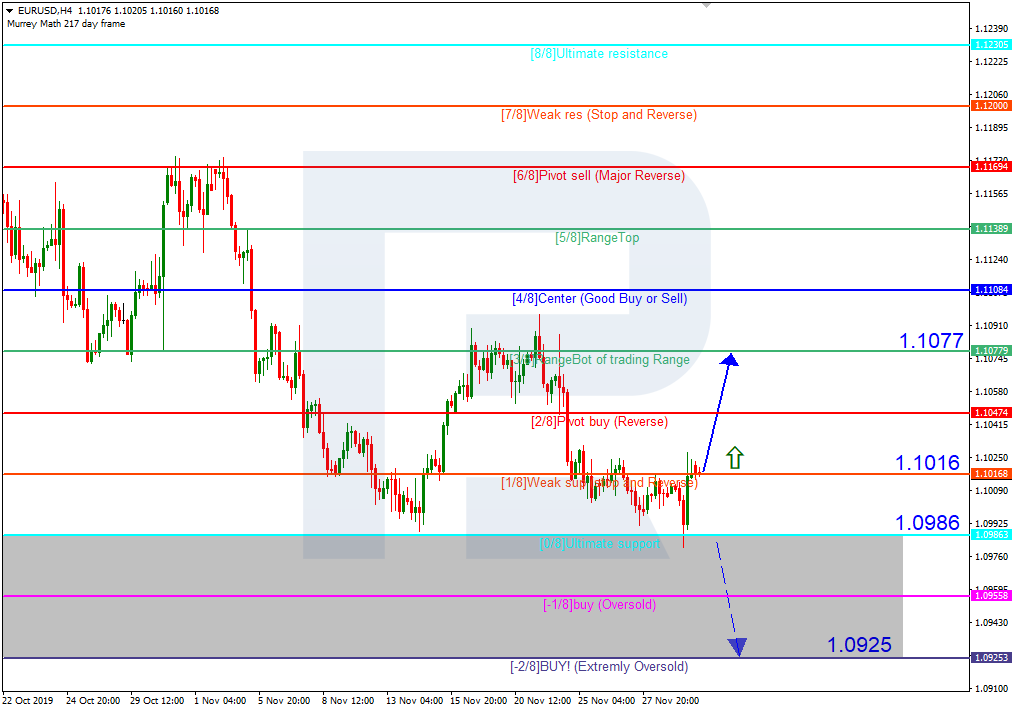
In the H4 chart, EURUSD rebounded from the support at 0/8 last Friday. In this case, the price is expected to resume continue trading upwards to reach the resistance at 3/8. However, this scenario may no longer be valid if the price breaks 0/8 to the downside. After that, the instrument may continue falling towards the support at -2/8.
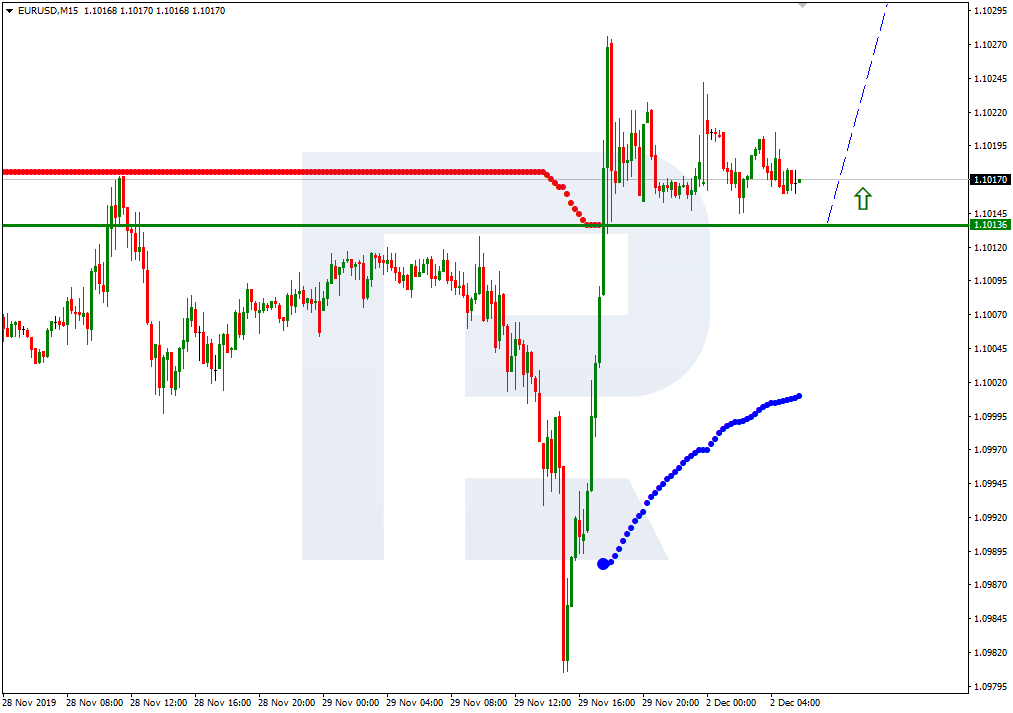
As we can see in the M15 chart, the pair has broken the upside line of the VoltyChannel indicator and, as a result, may continue moving upwards.
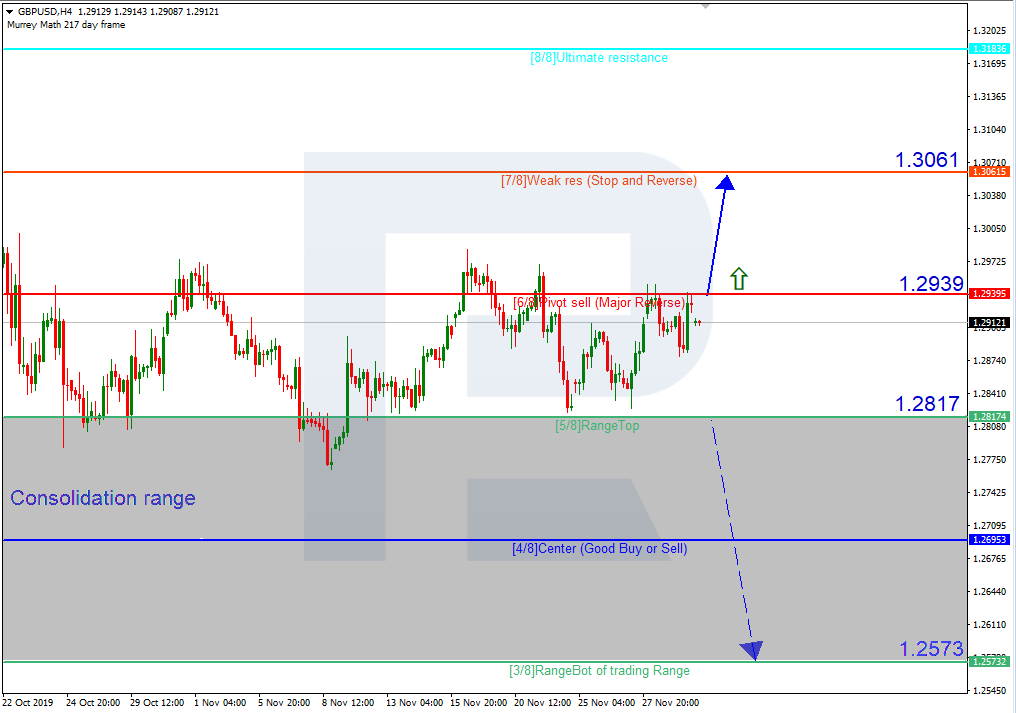
GBPUSD, “Great Britain Pound vs US Dollar”
As we can see in the H4 chart, GBPUSD is still moving between 5/8 and 6/8. In this case, the price is expected to break 6/8 and then continue growing to reach the resistance at 7/8. However, this scenario may no longer be valid if the price breaks 5/8. After that, the instrument is expected to continue falling towards the support at 3/8.
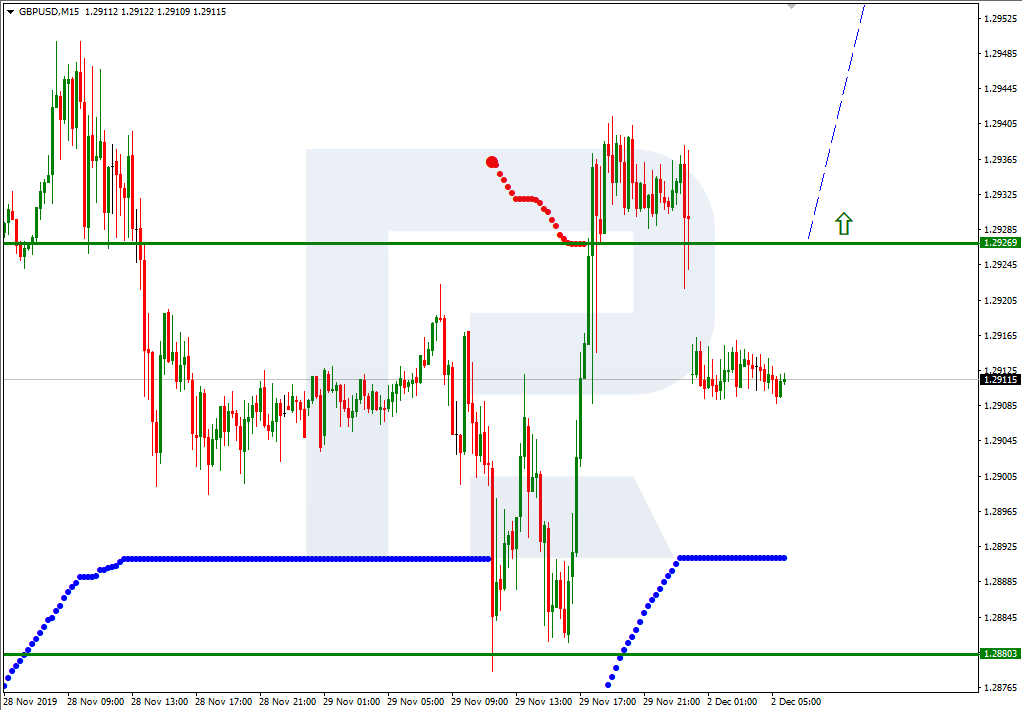
In the M15 chart, the pair may break the upside line of the VoltyChannel indicator and, as a result, continue trading upwards.
Attention! Forecasts presented in this section only reflect the author’s private opinion and should not be considered as guidance for trading. RoboForex LP bears no responsibility for trading results based on trading recommendations described in these analytical reviews.
Euro-zone manufacturing decline bearish for EURUSD
Euro-zone manufacturing sector continued contraction in November, albeit at the slowest rate for three months. Will the EURUSD decline?
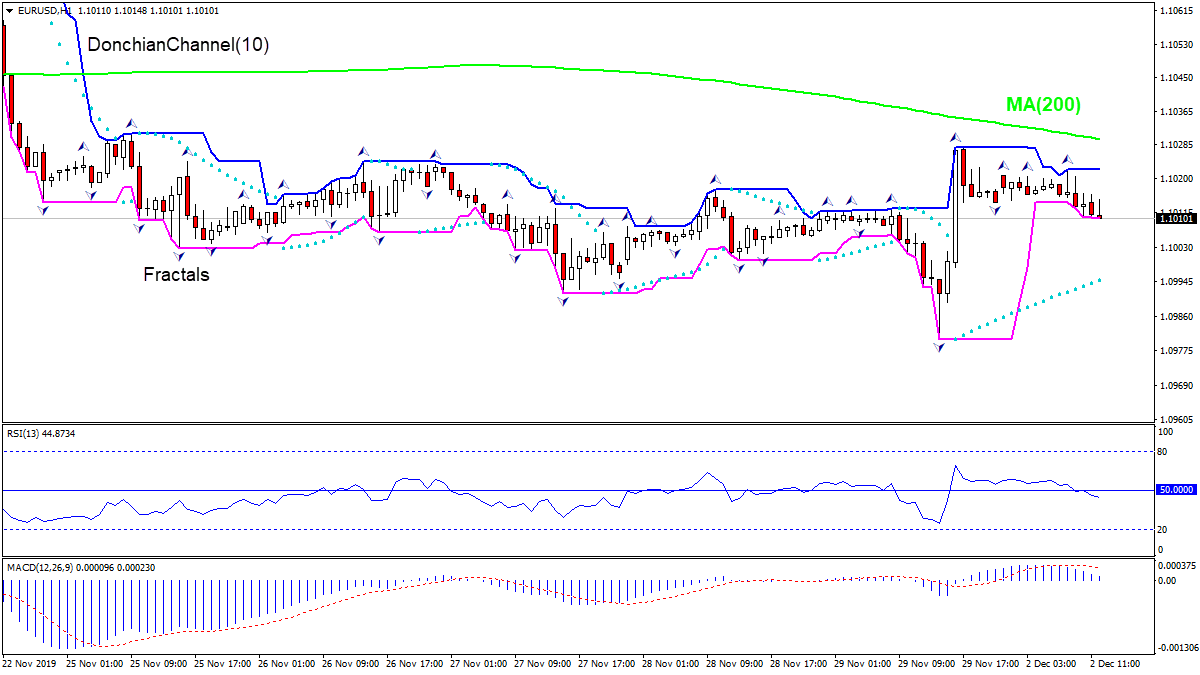
The price chart on 1-hour timeframe shows EURUSD: H1 is trading sideways. The price is falling below the 200-period moving average MA(200) which is falling. And the RSI oscillator is below 50 level and has not reached the oversold zone. There is no trend yet formed, traders have to decide when it would be a best time to enter the market.
On Friday, the EUR/USD currency pair showed mixed trends. Traders remain focused on US-China trade negotiations. Earlier it was reported that China and the United States are close to concluding an interim trade agreement. However, the situation around Hong Kong has complicated relations between countries. China imposed sanctions on the American non-governmental human rights organization Human Rights Watch (HRW) in response to the recent actions of D. Trump. In this regard, negotiations on a trade agreement were suspended. At the moment, the key support and resistance levels are 1.10100 and 1.10250, respectively. Open positions from these marks.
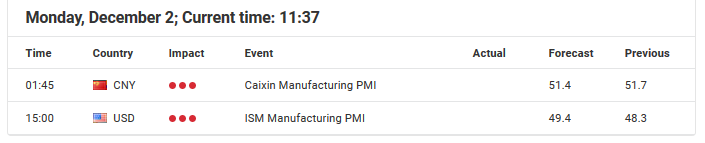
The Economic News Feed for 02.12.2019:
– PMI of the manufacturing industry (GER) – 10:55 (GMT+2:00);
– ISM’s PMI of the manufacturing industry (US) – 17:00 (GMT+2:00);
The indicators do not give accurate signals: the price is trading between 50 MA and 100 MA.
The MACD histogram is in the positive zone, but below the signal line, which gives a weak signal to buy EUR/USD.
The Stochastic Oscillator is in the neutral zone, the %K line is below the %D line, which gives a signal to sell EUR/USD.
Trading recommendations
Support levels: 1.10100, 1.09900, 1.09600
Resistance levels: 1.10250, 1.10500, 1.10800
If the price consolidates below 1.10100б expect the quotes to descend toward 1.09900-1.09700.
Alternatively, the quotes could grow toward 1.10500-1.10650.
The GBP/USD currency pair
Technical indicators of the currency pair:
Prev Open: 1.29092
Open: 1.29093
% chg. over the last day: +0.16
Day’s range: 1.29114 – 1.29228
52 wk range: 1.1959 – 1.3385
On Friday, the GBP/USD currency pair was moving in several directions at once. Market participants are tracking information regarding the Brexit process. British Prime Minister Boris Johnson said Britain would leave the European Union no later than January 31 if its Conservative Party won the majority of the vote in two weeks. He also reiterated that he sees no reason why Britain should extend the transitional period after Brexit after the end of 2020. At the moment, the key support and resistance levels are still 1.29000 and 1.29350, respectively. We recommend opening positions from these marks.
The Economic News Feed for 02.12.2019:
– PMI report (UK) – 11:30 (GMT+2:00);
Indicators do not give accurate signals: the price crossed 50 MA.
The MACD histogram is close to 0, which does not provide signals.
The Stochastic Oscillator is in the neutral zone, the %K line is below the %D line, which points to a bearish sentiment.
Trading recommendations
Support levels: 1.29000, 1.28700, 1.28400
Resistance levels: 1.29350, 1.29700
If the price consolidates above 1.29350, expect the quotes to rise toward 1.29700-1.29850.
Alternatively, the quotes could descend toward 1.28700-1.28400.
The USD/CAD currency pair
Technical indicators of the currency pair:
Prev Open: 1.32805
Open: 1.32728
% chg. over the last day: -0.02
Day’s range: 1.32760 – 1.32865
52 wk range: 1.2727 – 1.3664
The technical pattern on the USD/CAD currency pair is still ambiguous. On Friday, the USD/CAD quotes were moving in several directions at once. At the end of last week, a positive Canadian GDP report was released, which supported the Canadian dollar. At the moment, the local support and resistance levels are still 1.32800 and 1.33000, respectively. Participants in financial markets expect additional drivers. Open positions from key levels.
The Economic News Feed for 02.12.2019 is calm.
Indicators do not give accurate signals: the price has crossed 50 MA.
The MACD histogram is close to 0, which also does not give signals.
The Stochastic Oscillator is in the neutral zone, the %K line is below the %D line, which indicates a bearish sentiment.
Trading recommendations
Support levels: 1.32800, 1.32650, 1.32400
Resistance levels: 1.32950, 1.33150, 1.33400
If the price consolidates above 1.32950, expect the quotes to grow toward 1.33150-1.33400.
Alternatively, the quotes could descend toward 1.32650-1.32400.
The USD/JPY currency pair
Technical indicators of the currency pair:
Prev Open: 109.512
Open: 109.520
% chg. over the last day: +0.00
Day’s range: 109.662 – 109.696
52 wk range: 104.97 – 114.56
A variety of trends were observed on Friday on the USD/JPY currency pair. Today in the Asian trading session, quotes moved to growth. A trading instrument has overcome a key level of resistance. At the moment, the key support and resistance levels are: 109.600 and 109.800, respectively. We recommend you to pay attention to the dynamics of yield on US government bonds. Open positions from key levels.
The news background on the Japanese economy is calm.
Indicators point to the power of buyers: the price has fixed above 50 MA and 100 MA.
The MACD histogram is in the positive zone, above the signal line, which gives a strong signal to buy USD/JPY.
The Stochastic Oscillator is in the neutral zone, the %K line is above the %D line, which gives a signal to buy USD/JPY.
Trading recommendations
Support levels: 109.600, 109.400, 109.150
Resistance levels: 109.800, 110.000
If the price consolidates above 109.800, expect further growth toward 110.000.
Alternatively, the quotes can decline below 109.600 and eventually move beyond 109.400-109.150.
Africa has been slowly becoming the hub of all the innovative technologies and mining has been a big part of it. But the other sector that has been thriving on the continent is Forex. The fact is that Africa is full of potential in both of these fields and the investors and brokers from across the world know that. Industry professionals are doing their best to get the most out of African talent and resources, which is definitely substantial.
Some countries are more successful in this regard than others, with South Africa, Kenya and Nigeria being the most developed ones in those industries. But the trend seems to be spreading across the continent and it’s not unlikely that we will soon see these trends evolve in other African countries as well. Youth unemployment has been a major issue in Africa and with mining and forex trading this problem has finally been solved, even if partially.
When it comes to bitcoin adoption, and fintech in general African countries have displayed outstanding abilities and have been one of the driving forces in the industry. The questions that largely circles around right now is whether mining or forex will become the dominant industry and source of income in Africa. Now the question is whether or not Forex will replace mining across Africa
Although, as mentioned above the forex scene is not the same in every African country, the general trends are very prominent. Forex in Africa has been widely talked about the phenomenon and it started about a decade ago. Some of the most successful brokers can be found in Nigeria, South Africa, Kenya, Tanzania, Rwanda, Botswana, Namibia, and Angola. In these countries, the forex is thriving while the interest from the public is increasing daily.
You might think that the African Brokerage scene is full of native but actually there has been a huge wave of European brokers flooding in Africa. Part of what pushed the growth in this direction was the 2018 ESMA regulations. The European Securities Markets Authority introduced regulations for the retail Forex market in the EU.
These regulations included limits on leverage, banning bonuses and promotions and binary options as well as mandatory negative balance protection for all customers. With these strict additions to the existing regulation, it’s not surprising that these brokers fleed to Africa where regulations arent as strict and it’s easier to penetrate the market. African forex markets offer their trading platforms on mobile devices and require very low deposits starting as low as $1.
Considering the very favorable conditions Africa forex market is very attractive to anyone working in the industry. And with the raised popularity of the market, the interest is rising from the investors and broker alike. Compared to the very tight regulations especially, this specific market is very profitable especially if you’re small a broker or are just starting out in this field. While some countries have more favorable regulations, some have absolutely none for example Nigeria. And these countries are not taking too much effort to create regulations.
They’re gaining a lot of benefits from these markets so are the customers. These countries don’t shy away from speaking about the lack of regulations openly. But for example, South Africa has been working hard to create a healthy, regulated market for Forex and has been actively cracking down on criminal Forex brokers that have become a problem with the largely unregulated ecosystems. The problems with regulations seem to run across all the major industries that have been gaining momentum on the continent.
Mining has also been faced with criticism connected to regulations and the safety of the process which is the universal process across the world with government wanting to adopt the blockchain technologies and to dive into cryptocurrencies but struggling to come up with a solution to ensure the safety and the privacy of the process without taking away its most valuable characteristics. And Africa isn’t an exception in this case. But for what it’s worth Forex trading while driving some criminal action has largely been beneficial for the countries and has helped put a lot of them on the map for Forex Industry potential.
While the trend of stricter regulations has long exceeded Europe and is now becoming more widespread there is a chance that the Forex heaven that is Africa might lose its magic qualities soon enough. South Africa leading the way with the regulated market is a sign that these countries are waking up to all the risks of unregulated markets, even if the benefits are good. But considering that Africa has been hit with the wave of fraudulent Forex activities it’s evident that it can’t be all good when you take a risk of having the unregulated market.
While restricted regulation swill probably scares off some brokers the benefits of having low entrance deposits will remain. We already have examples of other African countries following the footsteps of SA, with Kenya recently adopting a new set of regulations and issuing public warnings about working with unlicensed operators in the country. Before that can happen across the continent the consumers are advised to treat all forex brokers with caution since it has become a little difficult to distinguish between the scammers and the actually good ones.
Africa is full of potential and the countries are slowly starting to build on that potential. But like with everything that goes largely unregulated the risks are high and sometimes they might not be worth it. With this new trend of implementing new regulations, Africa has a chance to eliminate the crime, therefore gain the trust of customers and possibly get some new ones as well. It isn’t its broker’s benefits that matter and the public are waking up to that.
There have been multiple cases of fraudulent brokers going after young men through social media to trying to get them to invest into a scam, if Africa can eliminate this aspect of its Forex market it will have a higher chance of growing and succeeding and hopefully this trend will continue at the same speed in the future.
On Friday, the US dollar showed a variety of trends. The dollar index (#DX) closed yesterday in the green zone (-0.09%). Traders are still focused on US-China trade negotiations. Earlier it was reported that China and the United States were close to concluding an interim trade agreement. However, the situation concerning Hong Kong has complicated relations between countries. China imposed sanctions on the American non-governmental organization Human Rights Watch (HRW) in response to the recent D. Trump’s actions. Therefore, negotiations on a trade agreement were suspended.
Today, during the Asian trading session, positive economic data have been published in China, which have supported the Chinese yuan. So, the Chinese Caixin manufacturing PMI index was published, which counted to 51.8 in November, while experts expected a value of 51.4. Also, today, important economic data are expected from the Eurozone, the UK and the US. In general, the week will be full of releases of economic statistics from the UK, US and Canada.
The “black gold” prices have been declining. At the moment, futures for the WTI crude oil are testing the $56.50 mark per barrel.
Market Indicators
On Friday, there was the bearish sentiment in the US stock market: #SPY (-0.37%), #DIA (-0.34%), #QQQ (-0.46%).
The 10-year US government bonds yield has been growing. At the moment, the indicator is at the level of 1.83-1.84%.
The Economic News Feed for 02.12.2019:
– German manufacturing PMI at 10:55 (GMT+2:00);
– Manufacturing PMI in the UK at 11:30 (GMT+2:00);
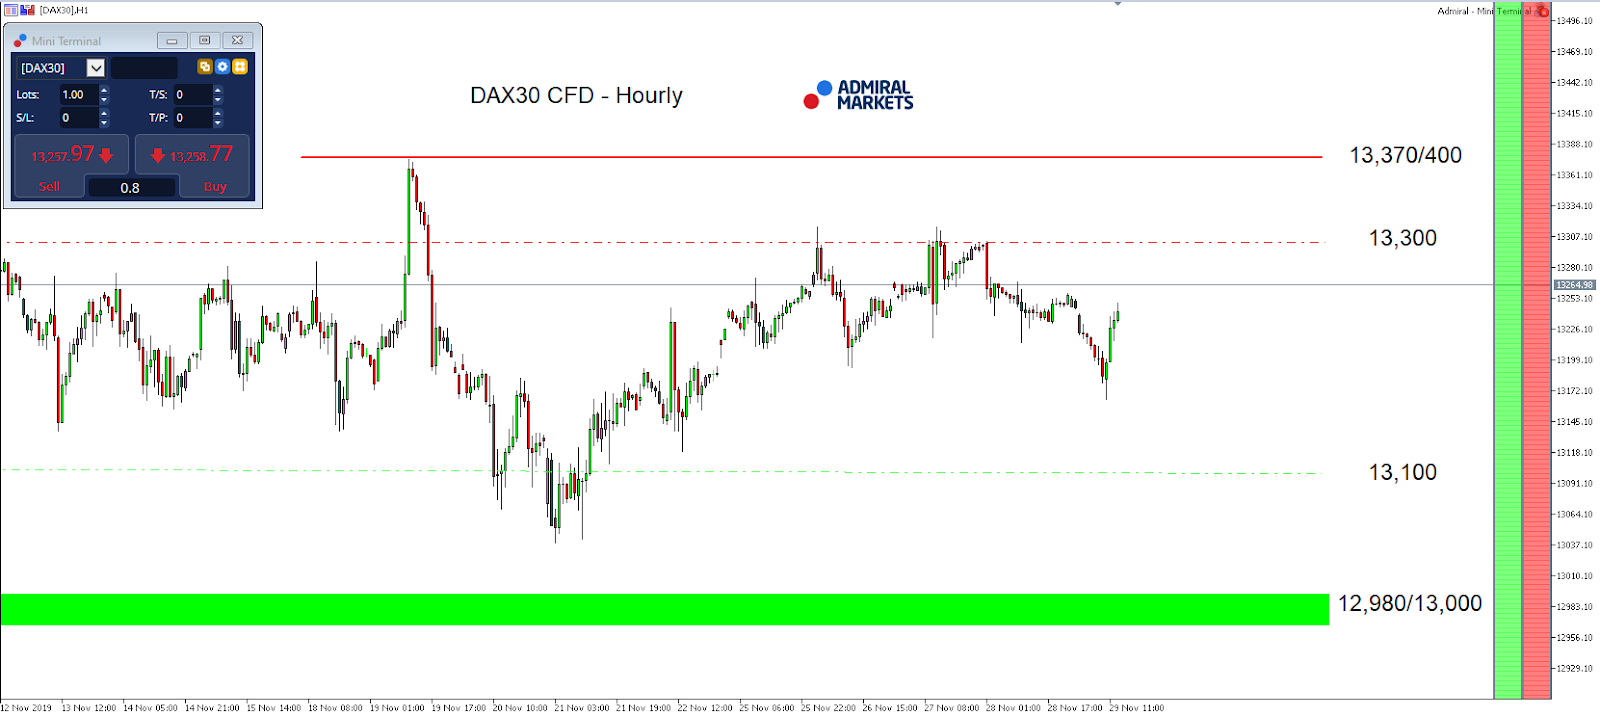
While the last week of trading primarily saw subdued volatility in the DAX30 CFD, this will likely change as we start this trading week.
Technically, the German index continues to trade sideways between 13,100 and 13,300 points. Due to its proximity to the 13,300 region, it is generally more likely to get to see a break on the upside, with a first potential target being seen around 13,370 / 13,400 points.
A break higher could be initiated by the upcoming US ISM manufacturing figures, which are due at 3 pm GMT. A better-than-expected dataset could initially dampen recession concerns for the world’s largest economy. A lower-than-expected data set could, on the other hand, fuel speculation that a more dovish approach by the Fed at the policy meeting on December 11 would be more likely. Or to put it another way: the DAX could be off to a win-win in the start of the week.
On the flip side, however, there is also the danger of a renewed escalation in the US-Chinese trade conflict, after US President Trump signed a Legislation Bill on developments in Hong Kong during the night from last Wednesday to Thursday.
The resulting support for Hong Kong and clear US position against China could spark a response from the Chinese that China could for the time being fail the current Phase 1 trade talks and put the DAX under pressure.
This would then put the region around 13,100 into focus and below the area around 13,040 / 050 points at the center of the action.
Source: Admiral Markets MT5 with MT5-SE Add-on DAX30 CFD Daily chart (between November 12, 2019, to November 29, 2019). Accessed: November 29, 2019, at 10:00pm GMT – Please note: Past performance is not a reliable indicator of future results, or future performance.
Source: Admiral Markets MT5 with MT5-SE Add-on DAX30 CFD Daily chart (between August 23, 2018, to November 29, 2019). Accessed: November 29, 2019, at 10:00pm GMT
In 2014, the value of the DAX30 CFD increased by 2.65%, in 2015, it increased by 9.56%, in 2016, it increased by 6.87%, in 2017, it increased by 12.51%, in 2018, it fell by 18.26%, meaning that after five years, it was up by 10.5%.
Discover the world’s #1 multi-asset platform
Admiral Markets offers professional traders the ability to trade with a custom, upgraded version of MetaTrader 5, allowing you to experience trading at a significantly higher, more rewarding level. Experience benefits such as the addition of the Market Heat Map, so you can compare various currency pairs to see which ones might be lucrative investments, access real-time trading data, and so much more. Click the banner below to start your FREE download of MT5 Supreme Edition!
Disclaimer: The given data provides additional information regarding all analysis, estimates, prognosis, forecasts or other similar assessments or information (hereinafter “Analysis”) published on the website of Admiral Markets. Before making any investment decisions please pay close attention to the following:
This is a marketing communication. The analysis is published for informative purposes only and are in no way to be construed as investment advice or recommendation. It has not been prepared in accordance with legal requirements designed to promote the independence of investment research, and that it is not subject to any prohibition on dealing ahead of the dissemination of investment research.
Any investment decision is made by each client alone whereas Admiral Markets shall not be responsible for any loss or damage arising from any such decision, whether or not based on the Analysis.
Each of the Analysis is prepared by an independent analyst (Jens Klatt, Professional Trader and Analyst, hereinafter “Author”) based on the Author’s personal estimations.
To ensure that the interests of the clients would be protected and objectivity of the Analysis would not be damaged Admiral Markets has established relevant internal procedures for prevention and management of conflicts of interest.
Whilst every reasonable effort is taken to ensure that all sources of the Analysis are reliable and that all information is presented, as much as possible, in an understandable, timely, precise and complete manner, Admiral Markets does not guarantee the accuracy or completeness of any information contained within the Analysis. The presented figures refer that refer to any past performance is not a reliable indicator of future results.
The contents of the Analysis should not be construed as an express or implied promise, guarantee or implication by Admiral Markets that the client shall profit from the strategies therein or that losses in connection therewith may or shall be limited.
Any kind of previous or modeled performance of financial instruments indicated within the Publication should not be construed as an express or implied promise, guarantee or implication by Admiral Markets for any future performance. The value of the financial instrument may both increase and decrease and the preservation of the asset value is not guaranteed.
The projections included in the Analysis may be subject to additional fees, taxes or other charges, depending on the subject of the Publication. The price list applicable to the services provided by Admiral Markets is publicly available from the website of Admiral Markets.
Leveraged products (including contracts for difference) are speculative in nature and may result in losses or profit. Before you start trading, you should make sure that you understand all the risks.
On Friday the 29th of November, the euro was up at the end of trading. It was a short day in the USA, and therefore the volume of trading operations on the market was relatively low. In the thin market, the EURUSD pair set its new weekly low at 1.0981, as well as a new daily high of 1.1028. There were no significant news items published to explain the rebound.
Day’s news (GMT +3):
11:55 Germany: Markit Manufacturing PMI (Nov).
12:30 UK: Markit Manufacturing PMI (Nov).
17:00 Eurozone: ECB’s President Lagarde speech.
18:00 USA: ISM Manufacturing PMI (Nov).
Current situation:
Markets opened with growth amid the release of strong Chinese statistics on Saturday. The official index of business activity in the manufacturing sector in China in November rose to 50.2 from 49.3 points. In the morning, China Ccaixin/IHS Markit PMI came out. The index rose to 51.8 against October’s figure of 51.7.
Growth was limited because it was reported that ongoing negotiations aimed at reaching a US-China trade agreement had been suspended due to the passing of the United States Democracy and Human Rights Act in Hong Kong. This was announced on Sunday by the information portal Axios, citing its sources in the Washington administration.
Today, traders’ attention is aimed at the upcoming UK general election, which will take place in two weeks. At 17:00 (Moscow time), a speech will be made by the head of the ECB Christine Lagarde. In the US, the ISM in the manufacturing sector will be released (November).
According to the forecast, we are expecting a correction to Friday’s growth to 1.1002. The fall may stop at 1.1010. There, most likely, the balance line will provide support. Since Friday, buyers were able to exceed the highs of 1.1013 and 1.1018, and it could be interesting to consider pullbacks to enter long positions. The initial target is the 45th degree – 1.1033. This week is full of important events: decisions on the interest rate of the RBA and the Bank of Canada, a change in Australia’s GDP, as well as payrolls (the US labour market).