USD Crashes On Manufacturing Miss

By Orbex

The US dollar tanked yesterday as the lSM Manufacturing reading for November came in below expectations. The index printed 48.1 last month, marking a contraction form the prior month’s 48.3 reading. Notably, the reading was also below the expected 49.4 reading. This is the fifth month of weakness in the US factory sector and the fourth consecutive month of below-neutral readings.

New Exports Down

The drop in last month’s manufacturing reading has been mainly attributed to weakness in new exports and a decline in inventories. With manufacturing having been in contractionary territory for the last four months, the outlook for the US economy is looking fairly subdued.

Fed Easing Still Possible

At its recent meeting, the Fed noted that it would hold off on further rate cuts while it waited to assess the impact of its recent cuts and the path of incoming data. With key readings like this remaining in negative territory, there is still a case for further easing from the Fed. The Fed itself noted that should any further weakness materialize in the US economy, then it could be forced to ease further. While the Fed is not expected to ease at the upcoming December meeting, pricing for a further rate cut in the early part of next year is starting to rise again.

Trade Talks In Focus

The key driver here is the US/China trade talks. While there has been plenty of talks recently regarding the likelihood of a deal coming before the end of the year, uncertainty is starting to creep back in and recent reports have cast doubt on the prospect of a deal. China reportedly suspended a US warship visit to Hong Kong this week. This was in retaliation to the US approving a bill in support of the rights of pro-democracy protestors in Hong Kong. The protests have been a difficult issue for Trump. He has been warned by China not to interfere. However, with Trump having now approved the bill, the stand-off between himself and Xi is once again threatening to disrupt trade talks.

As recently as last week, Trump had told reporters that a deal was very close and that the two sides were in the “final throes” of negotiations. However, in light of this latest development, there is a very real fear that talks will falter. This fear has been reflected in the broad reversal seen across equities markets this week.

US Employment Reports Next

Looking ahead this week, traders will be focusing on the US employment reports due on Friday. Should we see any weakness in labor market data, this would likely add further bearish pressure to the US dollar. Ahead of that, we also get the US ISM Non-Manufacturing reading on Wednesday. Given that this reflects a much larger portion of the US economy, this reading could be a key source of volatility. Again, any downside surprise will likely see USD sharply sold.

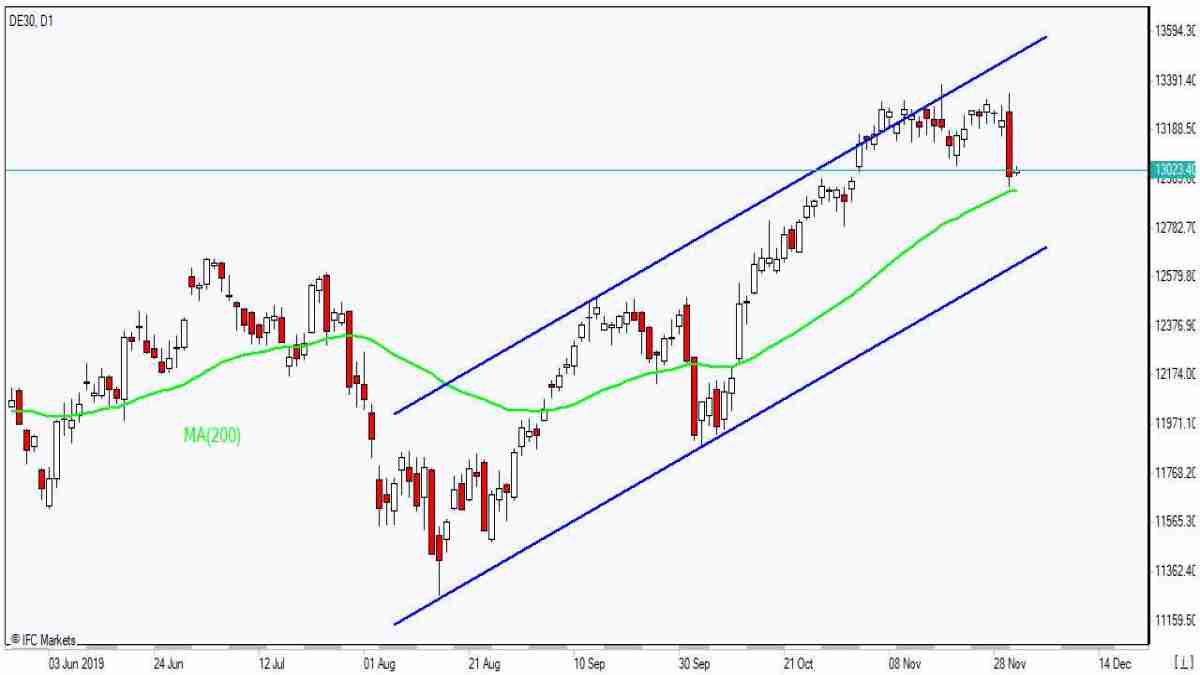
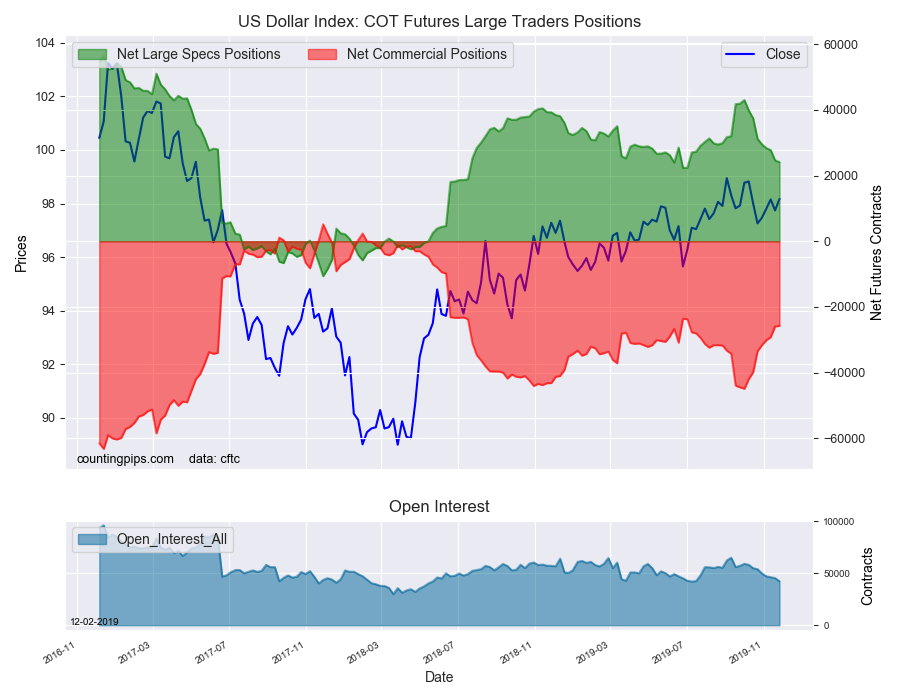
Technical Perspective

The reversal in the USD index this week has seen price moving sharply back under the 98.24 level. The index is now fast approaching support at the 97.69 level. The rising trend line from last year’s lows comes in just below. While above here, we could see a further rotation higher. However, if the price breaks back below here, focus will turn to the 97 level next.

By Orbex


Fresh Trump tariff threats blunt risk appetite

By Han Tan, Market Analyst, ForexTime

Asian stocks erased Monday’s gains following the selloff in US equities overnight, as US President Donald Trump appeared to have launched into a fresh tariff tantrum. The US administration has proposed tariffs on $2.4 billion worth of French goods, in response to France’s digital tax that the US government says hurts American tech companies such as Google, Facebook, and Amazon. This announcement by the office of the United States Trade Representative follows President Trump’s tweets saying that he will reinstate steel and aluminum tariffs on Brazil and Argentina.

While there is a clear risk-off mode in the markets today, the hit to risk appetite appears limited, with moves in safe haven assets relatively contained. Gold climbed about $10 to trade around $1463 at the time of writing, USDJPY weakened by about 0.6 percent before bouncing off the 109.0 support level, while 10-year US Treasury yields are holding above the 1.80 mark.

Investors remain primarily focused on the outcome of the US-China trade talks, with less than two weeks to go before President Trump has to decide by December 15 whether to impose more tariffs on $160 billion worth of Chinese goods. Investors are expected to hold back from making large moves in the interim, unless signaled otherwise, amid hopes that a limited trade deal remains a likely outcome.

Dollar index drops back below 98.0

The Dollar Index (DXY) fell 0.56 percent before paring losses to trade around the 97.9 level, after the US November ISM manufacturing PMI came in below expectations to mark four consecutive months in contraction territory. Still, the weaker DXY has not translated into broad gains for Asian currencies, considering the risk-off tone in the markets triggered by President Trump’s latest tariff tantrum.

The unexpected slump in US manufacturing was incongruent with the better-than-expected readings out of China and Europe. While it’s still too soon to predict a sustained recovery for the global manufacturing sector, any potential green shoots may be wiped out if the barriers to global trade are heightened. More imposed tariffs would trigger another wave of risk aversion while playing into the hands of Dollar bulls.


Disclaimer: The content in this article comprises personal opinions and should not be construed as containing personal and/or other investment advice and/or an offer of and/or solicitation for any transactions in financial instruments and/or a guarantee and/or prediction of future performance. ForexTime (FXTM), its affiliates, agents, directors, officers or employees do not guarantee the accuracy, validity, timeliness or completeness, of any information or data made available and assume no liability as to any loss arising from any investment based on the same.


Forex-Time-LogoArticle by ForexTime

ForexTime Ltd (FXTM) is an award winning international online forex broker regulated by CySEC 185/12 www.forextime.com

Stocks tumble on poor ISM data

By IFCMarkets

Dollar strengthening halted

US stocks pullback deepened on Monday with investor optimism undermined by weak data and lingering trade uncertainty. The Office of the US Trade Representative threatened to impose tariffs of up to 100% on about $2.4 billion in French imports. The S&P 500 finished 0.85% lower at 3113.87. Dow Jones industrial fell 0.96% to 27783.04. The Nasdaq slumped 1.1% to 8567.99. The dollar weakening accelerated as data showed the Institute for Supply Management’s purchasing manager’s index unexpectedly fell to 48.1 in November from 48.3 in the previous month. The live dollar index data show the ICE US Dollar index, a measure of the dollar’s strength against a basket of six rival currencies, slid 0.3% to 98.28 and is lower currently. Futures on three main US stock indices indicate higher openings today.

European stocks fall third straight session

European stock indexes retreat broadened on Monday as president Trump tweeted he “will restore the Tariffs on all Steel & Aluminum” that Brazil and Argentine ship to US. Both the EUR/USD and GBP/USD speeded up their climb yesterday with euro reversing currently while Pound higher still. The Stoxx Europe 600 index ended 1.6% lower as Markit reported euro zone manufacturing activity shrank for the tenth month in a row in November. The DAX 30 fell 2.1% to 12964.68. France’s CAC 40 lost 2% while UK’s FTSE 100 slid 0.85% to 7285.94.

DE30 testing MA(200)    12/2/2019 Market Overview IFC Markets chart

Australia’s All Ordinaries Index leads Asian indexes losses

Asian stock indices are mixed today as trade concerns rose following US threat to impose tariffs on steel imports from Brazil and Argentine. Nikkei fell 0.6% to 23,379.81 despite resumed yen decline against the dollar. Markets in China are mixed as Beijing announced sanctions Monday against several US non-government organisations for supporting Hong Kong protesters: the Shanghai Composite Index is up 0.3% while Hong Kong’s Hang Seng Index is 0.3% lower. Australia’s All Ordinaries Index dropped 2.1% as Australian dollar continued climbing against the greenback following central bank’s decision to hold policy steady while the current account surplus widened in Q3.

Brent gaining

Brent futures prices are extending gains today. Prices rose yesterday after Iraq’s oil minister remarks over the weekend that OPEC and its allies would consider deepening cuts by 400,000 barrels a day to 1.6 million barrels: January Brent crude closed 0.7% higher at $60.92 a barrel on Monday.

Market Analysis provided by IFCMarkets

Note:
This overview has an informative and tutorial character and is published for free. All the data, included in the overview, are received from public sources, recognized as more or less reliable. Moreover, there is no guarantee that the indicated information is full and precise. Overviews are not updated. The whole information in each overview, including opinion, indicators, charts and anything else, is provided only for familiarization purposes and is not financial advice or а recommendation. The whole text and its any part, as well as the charts cannot be considered as an offer to make a deal with any asset. IFC Markets and its employees under any circumstances are not liable for any action taken by someone else during or after reading the overview.

COT Speculators continued to trim US Dollar bets. Crude bets surge while Gold bets fall

By CountingPips.comReceive our weekly COT Reports by Email

Here are the latest links to our coverage of the Commitment of Traders data changes. This latest data was delayed to a Monday release (usually Fridays) due to the Thanksgiving day holiday last week. Our coverage is abbreviated this week due to the delay and next week will be back to a regular release schedule.


Speculators reduced US Dollar Index bets for 8th straight week. AUD & Euro bets rise

Large currency speculators decreased their net positions in the US Dollar Index futures markets this week, according to the latest Commitment of Traders (COT) data released by the Commodity Futures Trading Commission (CFTC) on Friday. See full article.


WTI Crude Oil Speculators sharply boosted their bullish bets last week, higher for 7th week

The large speculator contracts of WTI crude futures totaled a net position of 470,936 contracts, according to the latest data this week. This was a change of 40,961 contracts from the previous weekly total. See full article.


10-Year Note Speculators trimmed their bearish bets last week

Large speculator contracts of the 10-Year Bond futures totaled a net position of -145,745 contracts, according to the latest data this week. This was a change of 37,779 contracts from the previous weekly total. See full article.


Gold Speculators cut back on their bullish bets last week

Large precious metals speculator contracts of the Gold futures totaled a net position of 271,634 contracts, according to the latest data this week. This was a change of -14,225 contracts from the previous weekly total. See full article.


Article By CountingPips.comReceive our weekly COT Reports by Email

*COT Report: The COT data, released weekly to the public each Friday, is updated through the most recent Tuesday (data is 3 days old) and shows a quick view of how large speculators or non-commercials (for-profit traders) were positioned in the futures markets.

The CFTC categorizes trader positions according to commercial hedgers (traders who use futures contracts for hedging as part of the business), non-commercials (large traders who speculate to realize trading profits) and nonreportable traders (usually small traders/speculators).

Find CFTC criteria here: (http://www.cftc.gov/MarketReports/CommitmentsofTraders/ExplanatoryNotes/index.htm).

WTI Crude Oil Speculators sharply boosted their bullish bets last week, higher for 7th week

December 2nd – By CountingPips.comReceive our weekly COT Reports by Email

WTI Crude Oil Non-Commercial Speculator Positions:

Large energy speculators sharply advanced their bullish net positions in the WTI Crude Oil futures markets last week, according to the latest Commitment of Traders (COT) data released by the Commodity Futures Trading Commission (CFTC) on Monday (delayed due to Thanksgiving holiday).

The non-commercial futures contracts of WTI Crude Oil futures, traded by large speculators and hedge funds, totaled a net position of 470,936 contracts in the data reported through Tuesday November 26th. This was a weekly gain of 40,961 net contracts from the previous week which had a total of 429,975 net contracts.

The week’s net position was the result of the gross bullish position (longs) growing by 12,317 contracts (to a weekly total of 553,737 contracts) while the gross bearish position (shorts) dropped by -28,644 contracts for the week (to a total of 82,801 contracts).

Crude oil speculators continued to raise their bullish positions for a seventh straight week and now by a total of +115,851 contracts over that time-frame. The boost in bets last week brings the overall position to the most bullish level in twenty-seven weeks.

WTI Crude Oil Commercial Positions:

The commercial traders position, hedgers or traders engaged in buying and selling for business purposes, totaled a net position of -474,776 contracts on the week. This was a weekly shortfall of -33,632 contracts from the total net of -441,144 contracts reported the previous week.

WTI Crude Oil Futures:

Over the same weekly reporting time-frame, from Tuesday to Tuesday, the WTI Crude Oil Futures (Front Month) closed at approximately $58.41 which was an advance of $3.06 from the previous close of $55.35, according to unofficial market data.

*COT Report: The COT data, released weekly to the public each Friday, is updated through the most recent Tuesday (data is 3 days old) and shows a quick view of how large speculators or non-commercials (for-profit traders) as well as the commercial traders (hedgers & traders for business purposes) were positioned in the futures markets.

The CFTC categorizes trader positions according to commercial hedgers (traders who use futures contracts for hedging as part of the business), non-commercials (large traders who speculate to realize trading profits) and nonreportable traders (usually small traders/speculators).

Find CFTC criteria here: (http://www.cftc.gov/MarketReports/CommitmentsofTraders/ExplanatoryNotes/index.htm).

Article By CountingPips.comReceive our weekly COT Reports by Email

10-Year Note Speculators trimmed their bearish bets last week

December 2nd – By CountingPips.comReceive our weekly COT Reports by Email

10-Year Note Non-Commercial Speculator Positions:

Large bond speculators reduced their bearish net positions in the 10-Year Note futures markets last week, according to the latest Commitment of Traders (COT) data released by the Commodity Futures Trading Commission (CFTC) on Monday (delayed due to Thanksgiving holiday).

The non-commercial futures contracts of 10-Year Note futures, traded by large speculators and hedge funds, totaled a net position of -145,745 contracts in the data reported through Tuesday November 26th. This was a weekly change of 37,779 net contracts from the previous week which had a total of -183,524 net contracts.

The week’s net position was the result of the gross bullish position (longs) gaining by 30,587 contracts (to a weekly total of 708,296 contracts) while the gross bearish position (shorts) fell by -7,192 contracts for the week (to a total of 854,041 contracts).

Ten-year speculators cut back on their bearish bets for the second time in the past three weeks and for the ninth time out of the past twelve weeks. The overall net position has now been under the -200,000 contract level for ten straight weeks, dating back to September 24th.

10-Year Note Commercial Positions:

The commercial traders position, hedgers or traders engaged in buying and selling for business purposes, totaled a net position of 125,305 contracts on the week. This was a weekly fall of -57,333 contracts from the total net of 182,638 contracts reported the previous week.

10-Year Note Futures:

Over the same weekly reporting time-frame, from Tuesday to Tuesday, the 10-Year Note Futures (Front Month) closed at approximately $129.75 which was an advance of $0.28 from the previous close of $129.46, according to unofficial market data.

*COT Report: The COT data, released weekly to the public each Friday, is updated through the most recent Tuesday (data is 3 days old) and shows a quick view of how large speculators or non-commercials (for-profit traders) as well as the commercial traders (hedgers & traders for business purposes) were positioned in the futures markets.

The CFTC categorizes trader positions according to commercial hedgers (traders who use futures contracts for hedging as part of the business), non-commercials (large traders who speculate to realize trading profits) and nonreportable traders (usually small traders/speculators).

Find CFTC criteria here: (http://www.cftc.gov/MarketReports/CommitmentsofTraders/ExplanatoryNotes/index.htm).

Article By CountingPips.comReceive our weekly COT Reports by Email

Gold Speculators cut back on their bullish bets last week

December 2nd – By CountingPips.comReceive our weekly COT Reports by Email

Gold Non-Commercial Speculator Positions:

Large precious metals speculators lowered their bullish net positions in the Gold futures markets last week, according to the latest Commitment of Traders (COT) data released by the Commodity Futures Trading Commission (CFTC) on Monday (delayed due to Thanksgiving holiday).

The non-commercial futures contracts of Gold futures, traded by large speculators and hedge funds, totaled a net position of 271,634 contracts in the data reported through Tuesday November 26th. This was a weekly change of -14,225 net contracts from the previous week which had a total of 285,859 net contracts.

The week’s net position was the result of the gross bullish position (longs) tumbling by -12,010 contracts (to a weekly total of 325,286 contracts) while the gross bearish position (shorts) rose by 2,215 contracts for the week (to a total of 53,652 contracts).

Gold speculators had increased their bullish positions in four out of the previous five weeks before last week’s decline. The overall bullish position remains strong and above the +250,000 net contract level for a nineteenth straight week.

Gold Commercial Positions:

The commercial traders position, hedgers or traders engaged in buying and selling for business purposes, totaled a net position of -305,467 contracts on the week. This was a weekly rise of 13,628 contracts from the total net of -319,095 contracts reported the previous week.

Gold Futures:

Over the same weekly reporting time-frame, from Tuesday to Tuesday, the Gold Futures (Front Month) closed at approximately $1467.40 which was a decrease of $-6.90 from the previous close of $1474.30, according to unofficial market data.

*COT Report: The COT data, released weekly to the public each Friday, is updated through the most recent Tuesday (data is 3 days old) and shows a quick view of how large speculators or non-commercials (for-profit traders) as well as the commercial traders (hedgers & traders for business purposes) were positioned in the futures markets.

The CFTC categorizes trader positions according to commercial hedgers (traders who use futures contracts for hedging as part of the business), non-commercials (large traders who speculate to realize trading profits) and nonreportable traders (usually small traders/speculators).

Find CFTC criteria here: (http://www.cftc.gov/MarketReports/CommitmentsofTraders/ExplanatoryNotes/index.htm).

Article By CountingPips.comReceive our weekly COT Reports by Email

Speculators reduced US Dollar Index bets for 8th straight week. AUD & Euro bets rise

December 2nd – By CountingPips.comReceive our weekly COT Reports by Email

US Dollar Index Speculator Positions

Large currency speculators continued to decrease their bullish net positions in the US Dollar Index futures markets last week, according to the latest Commitment of Traders (COT) data released by the Commodity Futures Trading Commission (CFTC) on Monday (delayed due to Thanksgiving holiday).

The non-commercial futures contracts of US Dollar Index futures, traded by large speculators and hedge funds, totaled a net position of 24,138 contracts in the data reported through Tuesday November 26th. This was a weekly decline of -487 contracts from the previous week which had a total of 24,625 net contracts.

The week’s net position was the result of the gross bullish position (longs) tumbling by -2,276 contracts (to a weekly total of 29,233 contracts) compared to the gross bearish position (shorts) which saw a fall by -1,789 contracts on the week (to a total of 5,095 contracts).

US Dollar Index speculators have now cut back on their bullish positions for an eighth consecutive week and by a total of -18,890 contracts over that time-frame.The current spec bullish level is now at the lowest level in the past twenty-one weeks, dating back to early July.


Individual Currencies Data this week:

In the overall major currency contracts data, the major currencies that saw improving speculator positions last week were just the euro (1,087 weekly change in contracts) and the Australian dollar (1,885 contracts).

The currencies whose speculative bets declined last week were the US dollar index (-487 weekly change in contracts), British pound sterling (-4,673 contracts), Japanese yen (-4,560 contracts), Swiss franc (-4,783 contracts), Canadian dollar (-8,521 contracts), New Zealand dollar (-727 contracts) and the Mexican peso (-4,172 contracts).


Chart: Current Strength of Each Currency compared to their 3-Year Range

See the table and individual currency charts below.


Table of Large Speculator Levels & Weekly Changes:

CurrencyNet Speculator PositionSpecs Weekly Change
USD Index24,138-487
EuroFx-61,4161,087
GBP-36,576-4,673
JPY-39,591-4,560
CHF-20,975-4,783
CAD20,344-8,521
AUD-45,3551,885
NZD-35,826-727
MXN135,649-4,172


This latest COT data is through Tuesday and shows a quick view of how large speculators or non-commercials (for-profit traders) were positioned in the futures markets. All currency positions are in direct relation to the US dollar where, for example, a bet for the euro is a bet that the euro will rise versus the dollar while a bet against the euro will be a bet that the dollar will gain versus the euro.


Weekly Charts: Large Trader Weekly Positions vs Price

EuroFX:

The Euro large speculator standing this week totaled a net position of -61,416 contracts in the data reported through Tuesday. This was a weekly increase of 1,087 contracts from the previous week which had a total of -62,503 net contracts.


British Pound Sterling:

The large British pound sterling speculator level totaled a net position of -36,576 contracts in the data reported this week. This was a weekly decrease of -4,673 contracts from the previous week which had a total of -31,903 net contracts.


Japanese Yen:

Large Japanese yen speculators totaled a net position of -39,591 contracts in this week’s data. This was a weekly lowering of -4,560 contracts from the previous week which had a total of -35,031 net contracts.


Swiss Franc:

The Swiss franc speculator standing this week reached a net position of -20,975 contracts in the data through Tuesday. This was a weekly fall of -4,783 contracts from the previous week which had a total of -16,192 net contracts.


Canadian Dollar:

Canadian dollar speculators reached a net position of 20,344 contracts this week. This was a decrease of -8,521 contracts from the previous week which had a total of 28,865 net contracts.


Australian Dollar:

The large speculator positions in Australian dollar futures reached a net position of -45,355 contracts this week in the data ending Tuesday. This was a weekly increase of 1,885 contracts from the previous week which had a total of -47,240 net contracts.


New Zealand Dollar:

The New Zealand dollar speculative standing equaled a net position of -35,826 contracts this week in the latest COT data. This was a weekly lowering of -727 contracts from the previous week which had a total of -35,099 net contracts.


Mexican Peso:

Mexican peso speculators totaled a net position of 135,649 contracts this week. This was a weekly reduction of -4,172 contracts from the previous week which had a total of 139,821 net contracts.


Article By CountingPips.comReceive our weekly COT Reports by Email

*COT Report: The COT data, released weekly to the public each Friday, is updated through the most recent Tuesday (data is 3 days old) and shows a quick view of how large speculators or non-commercials (for-profit traders) were positioned in the futures markets.

The CFTC categorizes trader positions according to commercial hedgers (traders who use futures contracts for hedging as part of the business), non-commercials (large traders who speculate to realize trading profits) and nonreportable traders (usually small traders/speculators).

Find CFTC criteria here: (http://www.cftc.gov/MarketReports/CommitmentsofTraders/ExplanatoryNotes/index.htm).

Why Nobody Talks About Ballooning Federal Deficits

By Money Metals News Service

The presidential race will mesmerize Americans over the next 11 months. The country hasn’t been this polarized since the Civil War.

Voters on the left desperately want a story which undermines support for President Trump. They are also searching for a candidate who can actually win.

Many Republicans are outraged about the Deep State and corporate media campaign obsession with unseating a duly elected president – and they worry an avowed socialist could win the Democratic primary and, just possibly, the general election.

Plenty about the year ahead is unpredictable. Massive federal budget deficits and unrestrained borrowing, however, are a certainty.

The federal government is not going to voluntarily shrink itself, regardless of who wins in 2020. It has been hopelessly insolvent for a good long while.

The federal government has returned to trillion-dollar deficits – levels last seen following the 2008 financial crisis.

But this time is that federal tax receipts are the highest ever seen. Despite President Trump’s 2017 tax cuts, the IRS pulled in $3.44 trillion in 2019. Politicians may be divided, but they managed to find enough bi-partisan support to spend all that… plus another $984 billion.

Under current economic conditions, forecasters expect trillion-dollar deficits as far as the eye can see.

U.S. Debt Bubble

Imagine what the deficit will be the next time tax receipts fall to recessionary levels and/or Congress launches a major stimulus program. Multi-trillion-dollar deficits are on the way, perhaps when the U.S. economy next hits the skids.

Nobody in Washington DC leadership cares about sound money. Voters have forgotten the Fed’s unpopular decision to bailout crooked banksters and stick Main Street with the losses in 2008.

They stopped insisting upon limited government a long time ago. The Tea Party movement to restrain spending is all but dead, a victim of the partisan battles which have shifted attention to other issues.

Big Government Democrats and Republicans may occasionally pay lip service to the idea of fiscal restraint. But they know the Fed’s printing press will get them out of having to make any difficult cuts.

The return to sound money and limited government requires a 180-degree shift in ideology in Washington and an informed electorate. That isn’t going to happen until some hard lessons have been administered – most likely in the form of a dollar crisis.

Trouble is, the political theater has become such a distraction. It’s harder to keep track of which problems have a political solution and which do not.

The long slide into national bankruptcy is in the latter category. Prepare accordingly.


The Money Metals News Service provides market news and crisp commentary for investors following the precious metals markets.

Where to go if the S&P 500 Repeats History?

By Paul Farrugia, First Macro Capital


While many are wondering how high the S&P 500 will go. When looking to past decades what happened when all the market’s attention is primarily focused on one equity geography over others? After every major equity bubble, the Nikkei in the 80’s, then Europe in the 90’s, followed by Emerging Markets in the 00’s, each of these equity markets has yet to recover from their peaks. Now to today, is the S&P 500 setting up to repeat? Big Tech is more than 20% of the S&P 500 and the Nasdaq 100. If investors are going to be selling the S&P 500, which is primarily big tech stocks, investors need to buy something else, but what is it?

What would indicate a slowdown in the U.S is coming? A slowdown in Core CAPEX orders on a YoY basis is highlighting the peak in the S&P 500 is near, with 2019-Q4 GDP approaching zero.

This all coincides a top in the US dollar.

We think this recession will be less severe than 2008 because it is never the same as the most recent recession, where many investors get caught up in recency bias, and with 2008 being a severe recession, we don’t see it in the cards.

During the last commodity cycle, the S&P 500 was essentially flat from 2001-2008 and was down even further when you adjust for a fall in the US Dollar Trade Weighted Index that fell from 130 to below 100 during that time.


If money flows out of the U.S. as we finish this cycle and enter the next cycle, where will the money go? First off, it’s to the emerging market countries that are expected to power ahead the world growth over the next 4-5.

As we can see here, the US accounted for 13.8% of the world’s growth in 2019, with expectations it will be 9.2% of the growth in 2024.

This is not good for the US Dollar and US Equities.

It is good for commodities countries within emerging markets will surprise investors to the upside because of the rotation into commodities during this time period, like Brazil and Russia.

In U.S. Dollar terms, Brazil and Russia have outperformed the S&P 500 since 2016, and we think they are only getting started. Why? Their economies are heavily weighted to commodities and will benefit from an accelerating commodity cycle.

  • Could we see this again?
  • Even the legendary investor, Warren Buffet was willing to invest in emerging markets during the last cycle.
  • Brazil was both the emerging market and a commodity country.

Emerging market stocks are back to their 2003 lows relative to the S&P 500. Emerging markets in dollars terms continues to set higher lows since 2002 after being in a decade of sideways trading, a breakout is potentially coming in 2020. We will let it show us the way to avoid any near-term value trap.

Let’s be clear

  • A blow-off top in the US stocks is 100% possible. We are in it, which we let our clients know back in May 2020 that a blowoff top was possible.
  • The US equity bubble ending will and a weaker US dollar and will be the catalysts for non-US dollar assets like emerging markets and commodities.
  • There is greater upside to emerging markets and commodities.
  • If you don’t look at commodities and emerging markets now, because you don’t understand. It will be at least another 20 years BEFORE you have the risk:rewards set up for a once in a generation opportunity.
  • The S&P 500 will be the market to avoid in the 2020s, if history repeats, like past equity cycles.


About the Author:
Paul Farrugia, BCom. Paul is the President & CEO of First Macro Capital. He helps his clients take advantage of cycle opportunities across all sectors and asset classes, for the long-term. He provides a checklist to find winning gold and silver mining producer stocks, to take advantage of the commodity cycle.

Disclaimer:

The information contained herein is obtained from sources believed to be reliable, but its accuracy cannot be guaranteed. It is not designed to meet your financial situation – we are not investment advisors, nor do we give personalized investment advice. The opinions expressed herein are those of the publisher and are subject to change without notice. It may become outdated, and there is no obligation to update any such information.