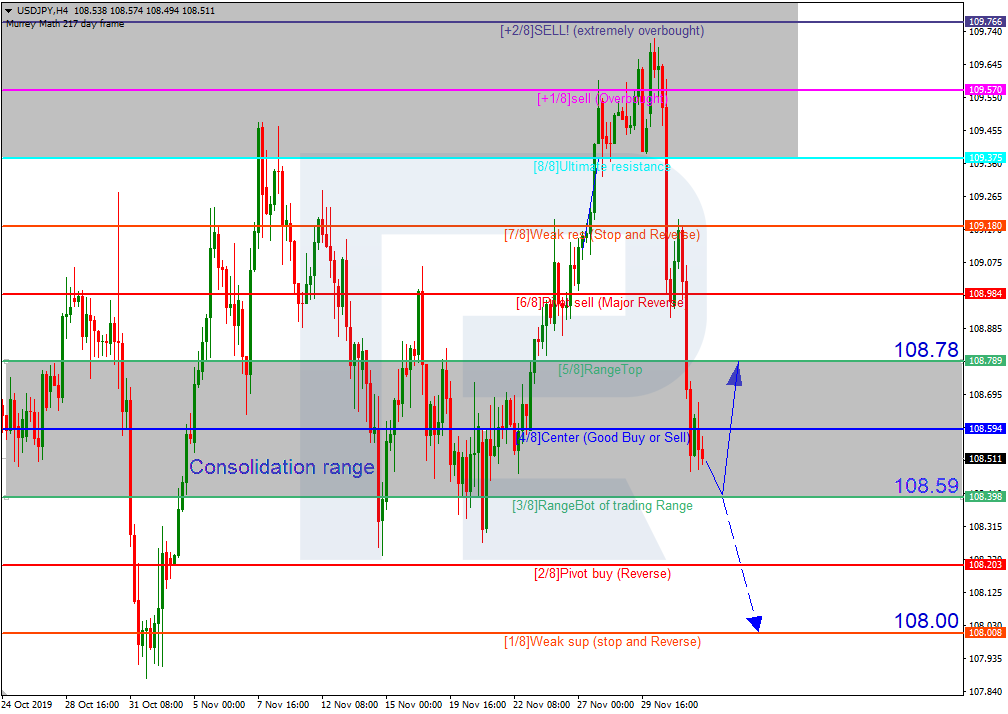
In the H4 chart, USDJPY is consolidating. In this case, the price is expected to test the support at 3/8, rebound from it, and then resume growing to reach the resistance at 5/8. However, this scenario may no longer be valid if the price breaks 3/8 to the downside. After that, the instrument may start a new decline towards the support at 1/8.
As we can see in the M15 chart, the pair has broken the downside line of the VoltyChannel indicator and, as a result, correct upwards to reach 5/8 from the H4 chart.
USDCAD, “US Dollar vs Canadian Dollar”
As we can see in the H4 chart, USDCAD is moving between 5/8 and 6/8. In this case, the pair may break 6/8 and then continue growing to reach the resistance at 8/8. However, this scenario may no longer be valid if the price breaks the support at 5/8. After that, the instrument may continue falling towards 3/8.
In the M15 chart, the pair may break the upside line of the VoltyChannel indicator and, as a result, continue moving upwards.
Attention! Forecasts presented in this section only reflect the author’s private opinion and should not be considered as guidance for trading. RoboForex LP bears no responsibility for trading results based on trading recommendations described in these analytical reviews.
Euro-zones Composite PMI upgrade bullish for EURUSD
The final reading of euro-zone’s Composite PMI index was unchanged in November at 50.6, above the earlier flash reading of 50.3. Will the EURUSD rise?
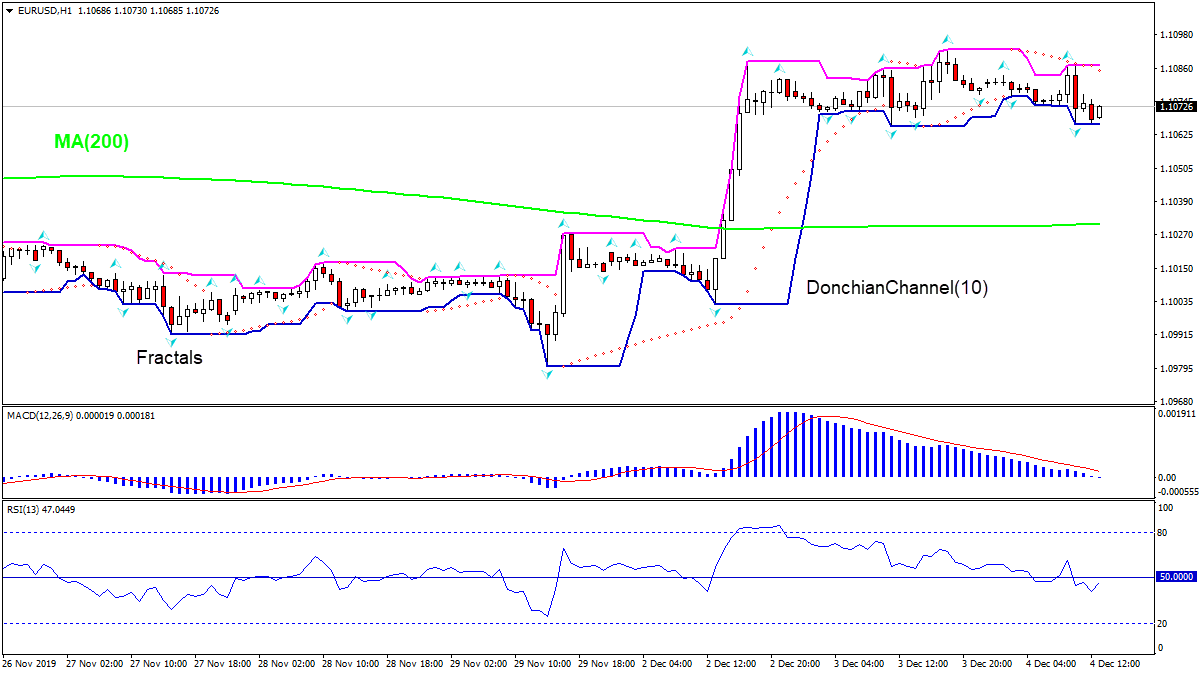
The price chart on 1-hour timeframe shows EURUSD: H1 is trading sideways. The price is falling above the 200-period moving average MA(200) which is level. And the RSI oscillator is below 50 level and has not reached the overbought zone. There is no trend yet formed, traders have to decide when it would be a best time to enter the market.
The US dollar fell significantly against a basket of major currencies during yesterday’s trading. The dollar index (#DX) closed in the red zone (-0.12%) yesterday. The sentiment of financial market participants is ambiguous after comments by US President D. Trump regarding a trade agreement with China. Thus, according to the President’s words, he doesn’t have a deadline for reaching a trade agreement with China, and perhaps it is better to wait until the end of the US presidential election in November 2020. It should be recalled that earlier, Trump announced the introduction of duties for Brazil and Argentina. The President also threatens France with imposing tariffs on French goods due to a tax on digital services. Yesterday, US Commerce Secretary Wilbur Ross said that despite negotiations with the Chinese side were continuing, officials were not planned to meet.
The British pound strengthened against the US dollar amid the publication of positive economic data. So, the construction PMI in the UK was published yesterday, which counted to 45.3 in November and turned out to be better than the forecasted value of 44.5.
Today, weak economic data have been published in Australia during the Asian trading session. So, GDP (q/q) grew only by 0.4% in the third quarter, while experts expected the indicator to grow by 0.5%.
The “black gold” prices are rising. Currently, futures for the WTI crude oil are testing the $57.00 mark per barrel.
Market Indicators
Yesterday, there was the bearish sentiment in the US stock market: #SPY (-0.67%), #DIA (-0.97%), #QQQ (-0.78%).
The 10-year US government bonds yield has declined significantly. At the moment, the indicator is at the level of 1.72-1.73%.
The Economic News Feed for 04.12.2019:
– UK composite PMI at 11:30 (GMT+2:00);
– Services PMI in the UK at 11:30 (GMT+2:00);
– ADP nonfarm employment change in the US at 15:15 (GMT+2:00);
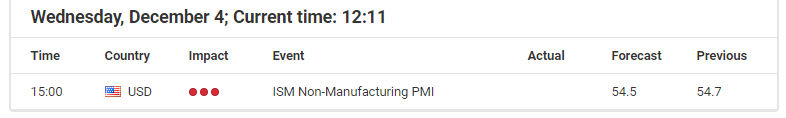
– ISM non-manufacturing PMI at 17:00 (GMT+2:00);
– Bank of Canada interest rate decision at 17:00 (GMT+2:00).
The EUR/USD currency pair is in a flat. The sentiment of financial market participants is mixed after comments by US President D. Trump regarding a trade agreement with China. Thus, the president said that he does not have a deadline for reaching a trade agreement with China, and perhaps it is better to wait until the end of the US presidential election in November 2020. Currently, the key support and resistance levels are 1.10650 and 1.10900, respectively. Open positions from these marks.
The Economic News Feed for 04.12.2019:
– change in the number of employees in the non-agricultural sector by ADP (USA) – 15:15 (GMT + 2: 00);
– ISM PMI (US) – 17:00 (GMT+2:00);
Indicators point to a bullish sentiment: the price is being traded above 50 MA and 100 MA.
The MACD histogram is in the positive zone, but below the signal line, which gives a weak signal to buy EUR/USD.
The Stochastic Oscillator is in the neutral zone, the %K line is above the %D line, which also gives a signal to buy EUR/USD.
Trading recommendations
Support levels: 1.10650, 1.10300, 1.10000
Resistance levels: 1.10900, 1.11200
If the price consolidates above the resistance level of 1.10900, expect further growth toward 1.11200-1.11350.
Alternatively, the quotes could reduce toward 1.10300-1.10150.
The GBP/USD currency pair
Technical indicators of the currency pair:
Prev Open: 1.29486
Open: 1.29925
% chg. over the last day: +0.47
Day’s range: 1.29929 – 1.30007
52 wk range: 1.1959 – 1.3385
On the GBP/USD currency pair, a bullish sentiment is observed. Yesterday, the index of business activity in the UK construction sector was published, which amounted to 45.3 in November and turned out to be better than the predicted value of 44.5. Investors are awaiting additional information regarding the Brexit process. At the moment, the key support level is the mirror level of 1.29900. The key resistance level is 1.30500. We recommend opening positions from these marks.
The Economic News Feed for 04.12.2019:
– Composite PMI (UK) – 11:30 (GMT+2:00);
– Service PMI (UK) – 11:30 (GMT+2:00);
Indicators point to bullish sentiment: the price is being traded above 50 MA and 100 MA.
The MACD histogram is in the positive zone and above the signal line, which gives a strong signal to buy GBP/USD.
The Stochastic Oscillator is in the neutral zone, the %K line is above the %D line, which also gives a signal to buy.
Trading recommendations
Support levels: 1.29900, 1.29500, 1.29100
Resistance levels: 1.30500, 1.30750
If the price consolidates above 1.29900, expect further growth toward 1.30750.
Alternatively, the quotes could fix below 1.29900 and decline toward 1.29500-1.29350.
The USD/CAD currency pair
Technical indicators of the currency pair:
Prev Open: 1.32971
Open: 1.32941
% chg. over the last day: -0.13
Day’s range: 1.32877 – 1.32979
52 wk range: 1.2727 – 1.3664
The USD/CAD currency pair is moving in several directions at once. Pressure on the USD is exerted by D. Trump’s statements regarding the US-China trade agreement. Currently, the local support and resistance levels are 1.32800 and 1.33000, respectively. Participants in financial markets expect additional drivers. We recommend paying attention to the dynamics of oil prices. Open positions from key levels.
Today, the Bank of Canada will decide on the interest rate at 17:00 (GMT+2: 00).
Indicators do not give accurate signals: the price has crossed 50 MA and 100 MA.
The MACD histogram is in the negative zone, but above the signal line, which gives a weak signal to sell USD/CAD.
The Stochastic Oscillator is in the neutral zone, the %K line crosses the %D line. There are no signals.
Trading recommendations
Support levels: 1.32800, 1.32650
Resistance levels: 1.33000, 1.33150, 1.33400
If the price consolidates below 1.32800, USD/CAD quotes are expected to decline to 1.32650-1.32400.
An alternative could be the growth of the USD/CAD currency pair to 1.33150-1.33300.
The USD/JPY currency pair
Technical indicators of the currency pair:
Prev Open: 108.989
Open: 108.629
% chg. over the last day: -0.31
Day’s range: 108.440 – 108.519
52 wk range: 104.97 – 114.56
The USD/JPY currency pair went down. During yesterday’s trading, quotes fell by more than 70 points. Currently, the key support and resistance levels are 108.400 and 108.650, respectively. Investors are focusing on US-China relations. We also recommend that you pay attention to the dynamics of yield on US government bonds. Open positions from key levels.
The Economic News Feed for 04.12.2019 is calm.
Indicators point to the strength of sellers: the price is being traded below 50 MA and 100 MA.
The MACD histogram is in the negative zone, but above the signal line, which gives a weak signal to sell USD/JPY.
The Stochastic Oscillator is in the neutral zone, the %K line is below the %D line, which gives a signal to sell USD/JPY.
Trading recommendations
Support levels: 108.400, 108.150
Resistance levels: 108.650, 108.900, 109.200
f the price consolidates below 108.400, expect a further decline toward 108.150-108.000.
Alternatively, the quotes could consolidate above 108.650 and grow toward 109.000.
Today our main focus will be the US ISM Non-Manufacturing data set.
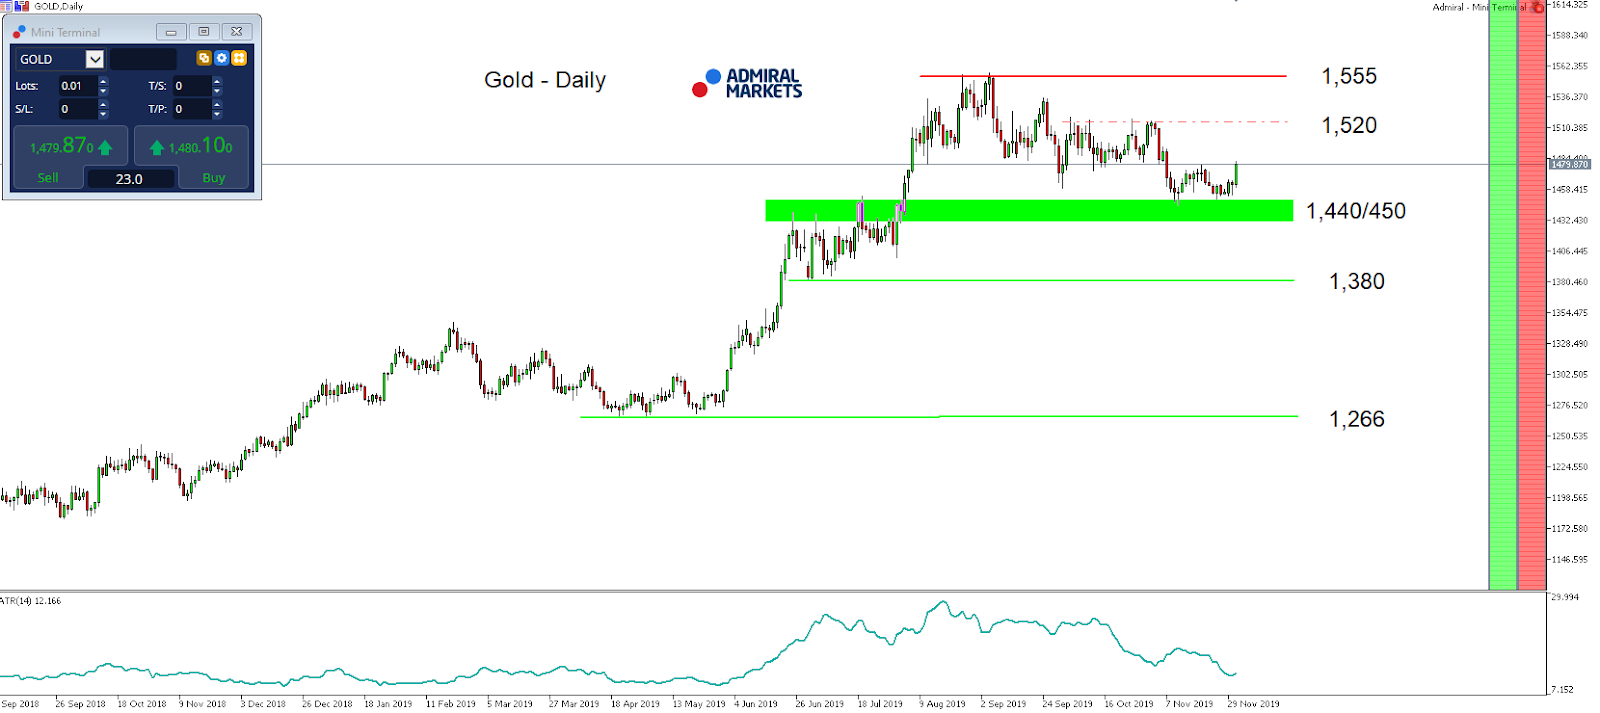
The last reading came in at 54.7 points for last October, from a near three-year low of 52.6 in September and above market consensus of 53.5, added to the rise in 10-year US-Treasury yields at the beginning of the month of November and drop in Gold back below 1,500 USD.
Interestingly enough, the precious metal stabilised above 1,440/450 USD, despite the rise in the USD/JPY back above 109.00, especially over the last few days.
That fueled in fact our bullish outlook for the next months. If today’s data set disappoints, we would expect a drop in 10-year US-Treasury yields, likely to result in a bullish stint in Gold.
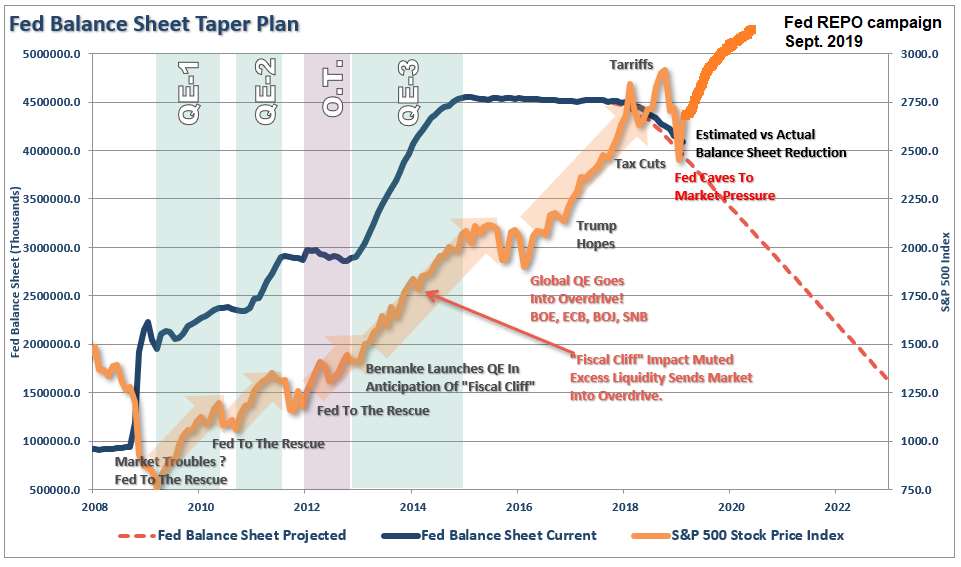
The reason: worse than expected data on the other hand could result in rising expectations of an increasingly dovish stance from the Fed at the December 11 meeting, adding fuel to our bullish Gold outlook which is mainly driven by the fact that the Fed’s balance sheet is currently expanding at a faster rate than during QE1, QE2 or QE3.
And even if better than expected data could result in short-term bearish stints in Gold, these could be aggressively bought back and leave Gold for a push higher, since most of a ‘hawkish’ Fed is already priced into the precious metal.
With that in mind, technically our picture switches to Long again with Gold breaking back above 1,520 USD which would level the path up to the current yearly highs around 1,557 USD, a first bullish sign in the lower time-frames (H1) is already sent with Gold recapturing 1,480 USD:
Source: Admiral Markets MT5 with MT5-SE Add-on Gold Daily chart (between September 4, 2018, to December 3, 2019). Accessed: December 3, 2019, at 10:00pm GMT – Please note: Past performance is not a reliable indicator of future results, or future performance.
In 2014, the value of Gold fell by 1.7%, in 2015, it fell by 10.4%, in 2016, it increased by 8.1%, in 2017, it increased by 13.1%, in 2018, it fell by 1.6%, meaning that after five years, it was up by 6.4%.
Discover the world’s #1 multi-asset platform
Admiral Markets offers professional traders the ability to trade with a custom, upgraded version of MetaTrader 5, allowing you to experience trading at a significantly higher, more rewarding level. Experience benefits such as the addition of the Market Heat Map, so you can compare various currency pairs to see which ones might be lucrative investments, access real-time trading data, and so much more. Click the banner below to start your FREE download of MT5 Supreme Edition!
Disclaimer: The given data provides additional information regarding all analysis, estimates, prognosis, forecasts or other similar assessments or information (hereinafter “Analysis”) published on the website of Admiral Markets. Before making any investment decisions please pay close attention to the following:
This is a marketing communication. The analysis is published for informative purposes only and are in no way to be construed as investment advice or recommendation. It has not been prepared in accordance with legal requirements designed to promote the independence of investment research, and that it is not subject to any prohibition on dealing ahead of the dissemination of investment research.
Any investment decision is made by each client alone whereas Admiral Markets shall not be responsible for any loss or damage arising from any such decision, whether or not based on the Analysis.
Each of the Analysis is prepared by an independent analyst (Jens Klatt, Professional Trader and Analyst, hereinafter “Author”) based on the Author’s personal estimations.
To ensure that the interests of the clients would be protected and objectivity of the Analysis would not be damaged Admiral Markets has established relevant internal procedures for prevention and management of conflicts of interest.
Whilst every reasonable effort is taken to ensure that all sources of the Analysis are reliable and that all information is presented, as much as possible, in an understandable, timely, precise and complete manner, Admiral Markets does not guarantee the accuracy or completeness of any information contained within the Analysis. The presented figures refer that refer to any past performance is not a reliable indicator of future results.
The contents of the Analysis should not be construed as an express or implied promise, guarantee or implication by Admiral Markets that the client shall profit from the strategies therein or that losses in connection therewith may or shall be limited.
Any kind of previous or modeled performance of financial instruments indicated within the Publication should not be construed as an express or implied promise, guarantee or implication by Admiral Markets for any future performance. The value of the financial instrument may both increase and decrease and the preservation of the asset value is not guaranteed.
The projections included in the Analysis may be subject to additional fees, taxes or other charges, depending on the subject of the Publication. The price list applicable to the services provided by Admiral Markets is publicly available from the website of Admiral Markets.
Leveraged products (including contracts for difference) are speculative in nature and may result in losses or profit. Before you start trading, you should make sure that you understand all the risks.
On Tuesday the 3rd of December, the EURUSD pair was three points up at the end of trading. For many market players, the behavior of yesterday’s market was a bit strange, given that Trump has no deadline for the signing of the trade agreement with China – in any case, the signing of the deal could well be delayed until the conclusion of the 2020 US presidential election.
Trump also accused Brazil and Argentina of devaluing their national currencies to harm US farmers. In retaliation, he decided to raise duties levied on these countries. As before, the focus was on France and its plans surrounding digital service tax.
The yen, Swiss franc and gold all rose in price, while the yuan fell. Everything is clear with protective assets, but not at all with the euro.
On Tuesday, the pair was expected to fall to 1.1050. At the beginning of the European session, bears failed to gain a foothold below 1.1070. A new downwards correction began at 1.1094 after the previous high was increased by five points.
Geopolitics nullifies the signals of technical analysis and it is unknown what else to expect from Trump and how Brazil, Argentina and China will respond. In response to the latest US sanctions bill against Chinese officials, the editor of the Chinese newspaper Global Times said US politicians with stakes in China should tread carefully. The West sees the paper as the main oracle into China’s foreign policy. His tweet alone is capable of significantly reduce the stock prices of large US companies.
Today, the European economic calendar looks fairly sparse. Market players are focusing on US ADP employment data, the ISM service index, and the upcoming Bank of Canada meeting.
If the signing of the trade agreement between the United States and China is postponed until next year, then new, increased duties on Chinese imports will come into force on December 15. Market players have been aware of the proposed December 15 tariff hike for some time, and if the two parties fail to conclude the deal before this date, the new tariffs will come into effect. If that is going to be the case, then at the moment there is no reason to predict a strong strengthening of the euro until Friday.
Today, supports are at two levels for the European currency: 1.1070 and 1.1054. The latter support level is located on the trend line and is the target according to yesterday’s forecast, there are no changes here. For buyers, the target is 1.1112 (112th degree).
Risk aversion returns on possible delay in trade deal
Dollar hit by disappointing economic data
Pound to remain choppy ahead of general elections
Gold rises from the ashes and eyes $1492
It is another day, but the same old story with trade developments as conflicting signals on the progress of negotiations foster confusion and uncertainty.
In the latest twists and turns of the trade saga, President Donald Trump has said a trade deal with China could be delayed until after the 2020 U.S presidential elections, essentially dashing hopes of a phase one deal before mid-December. Given how a delay will most likely result in prolonged uncertainty and tensions between the world’s two largest economies, this certainly does not bode well for global equity markets. Stocks in Asia are flashing red on Wednesday morning thanks amid the negative sentiment and is poised to contaminate European markets.
With less than two weeks to go until the next tariff deadline on December 15th where 15% levies on an additional $160 billion worth of Chinese goods will go into effect, the clock is dangerously ticking. Risk aversion is set to engulf financial markets if Washington moves ahead with the tariff hikes, as trade tensions intensify and global growth concerns send investors rushing towards safe-haven assets like Gold.
King Dollar bruised by disappointing data
It has not been the best trading week for the Dollar Index which continues to nurse deep wounds inflicted by disappointing economic data.
Official reports released earlier in the week showing that the US manufacturing sector contracted for the fourth consecutive month in November sparked jitters over the health of the largest economy in the world. This led to a selloff that dragged the Dollar Index to levels not seen three weeks below 97.67.
Although the King Dollar has entered December on a negative note, the currency could be offered some support if the pending ADP Non-Farm Employment Change and ISM Non-Manufacturing PMI data exceed market expectations.
Pound punches above psychological 1.30 level
The British Pound has gained against almost every single 10 currency this week excluding the Swiss Franc.
With the general elections just over one week away, the currency will most likely remain volatile and heavily influenced by the polls. Although the GBPUSD blasted above the 1.30 on Wednesday, it will take a major catalyst or significant event for bulls to truly conquer this stubborn resistance level.
Investors will focus their attention towards the final services PMI report scheduled for release on Wednesday morning. While a print that meets or exceeds expectations may prop Sterling higher, the currency is more concerned with political developments in Westminster and Brexit.
Commodity spotlight – Gold
Gold staged an incredibly rebound yesterday, punching above $1480 thanks to renewed uncertainty on the US-China trade front.
Appetite towards the precious metal is likely to receive a boost if Washington moves ahead with the tariff hikes on December 15th. Other major themes in the form of Brexit and global growth concerns are seen pushing the precious metal higher in December.
Focusing on the technical picture, Gold is bullish on the 4 hour timeframe with prices trading around $1480 as of writing. The upside momentum could send prices back towards the $1492 level in the short to medium term.
Disclaimer: The content in this article comprises personal opinions and should not be construed as containing personal and/or other investment advice and/or an offer of and/or solicitation for any transactions in financial instruments and/or a guarantee and/or prediction of future performance. ForexTime (FXTM), its affiliates, agents, directors, officers or employees do not guarantee the accuracy, validity, timeliness or completeness, of any information or data made available and assume no liability as to any loss arising from any investment based on the same.
Sector expert Maurice Jackson begins a four-part series on private placements with a conversation with Tekoa Da Silva of Sprott USA.
Maurice Jackson: Thank you for joining us for aspecial four-part series entitled All About Private Placements. Joining us for a conversation is Tekoa Da Silva; he is an accomplished licensed financial advisor for Sprott USA, the preeminent name in the natural resources space. Full disclosure, the following is not a Sprott USA endorsed product, and is for educational purposes only.
Tekoa Da Silva: Hi, Maurice, pleasure to be with you.
Maurice Jackson: There’s a lot of ambiguity regarding private placements and we thought it would be good for readers to have a comprehensive overview regarding this topic. Tekoa, what is a private placement?
Tekoa Da Silva: My understanding is that it’s simply a vehicle that is used to allow an investor to fund directly a corporate entity. I’m guessing in the context of this conversation, private placement is probably in relation to natural resources and mining industries. And I believe the bottom two segments of that industry, in exploration and development-stage businesses, [private placements are] their lifeline, in terms of their primary source of capital infusion.
A private placement is a vehicle used to move cash directly into the entity, and then in exchange for your cash, you get some form of security or ownership. And the securities that you could get could be common stock, they could be stock options, warrants, debt securities. So that is what a private placement generally is.
Maurice Jackson: So it allows you to get either shares or a debenture. How do I participate in a private placement?
Tekoa Da Silva: Assuming that we’re talking about the North American context, and if you are, let’s say, based in the U.S., an accredited investor, how would you participate in a private placement? I think if a person is sitting in front of a computer at home and they see a press release come up for, let’s say, a gold exploration company, and they look at it and it says that the company is announcing a private placement and they say, how do I participate in that?, probably the first thing that a person would do, or could do, is to call the company or e-mail them and say, “I’d like to participate.”
What would happen next is the company would reply and probably provide a few documents. A private placement memorandum is the lead document and they would provide that to the person to complete and return, and that would start the process of participating in a private placement. The investor relations personnel of that company would sort of hold your hand and walk you through the process of that.
Maurice Jackson: What are the requirements to participate in a private placement?
Tekoa Da Silva: The requirements to participate in a private placement, again, from the North American context, is usually, firstly, being an accredited investor. So having a net worth of US$1 million or more, excluding the value of your main residence. There’s also an income qualification part of it too, that may change over time. So you always want to look online for the most precise definition announced by, I believe it’s the SEC [Securities and Exchange Commission] or FINRA [Financial Industry Regulatory Authority] in the United States.
That’s usually the case. Sometimes there will be offerings that don’t require an investor or a speculator to be accredited, but those are different types of offerings, and you’ll want to check with the company, to ask about the specific type of offering that they have. So that’s the first hurdle.
There are other hurdles that a person should consider and they have to do with participation amounts and also third-party processing fees. My experience is that it’s usually between $300 to $600the third-party processing fees, not including a brokerage commission coststhat a person may encounter if they participate in a private placement.
So if you’re considering an investment or a speculation in something and your hurdle is $300 to $600 just to process it, and let’s say another 1% or 2% as a brokerage commission cost of the market value of the investment, and you’re thinking about it for $5,000 or $10,000I mean really, if it’s $5,000 or less, and you’re putting up 1015% of your capital just to play, in most cases, I think that’s pretty unreasonable. But if you increase the amount to US$10,00015,000 or larger, then that fraction is smaller as a percentage of your capital and maybe it’s more considerable.
So you’ll get your technical requirement, in terms of being financially qualified and the specific type of offering that the company is making available to the market. You have your financial requirement, your qualifications there, and then outside of that it’s just jumping through the hoops, if you will, on completing the paperwork and moving the paperwork around the various parties.
Maurice Jackson: When is a good time to buy?
Tekoa Da Silva: Boy, that’s such a good question. I think there’s probably two answers. The first one is anytime is a good time to buy, depending on the terms, the deal and the quality of the companybecause you may have a really good company, which maybe is composed of two basic things, like a management team as well as the collection of assets or income streams and such. And you just might come across a good deal. So anytime it could be a good time, I think, in that sense, when looking at quality in terms.
But the second answer I think is really dependent on the cost of capital market conditions. I always interpreted a stock market up or down as just thinking about it as stocks going up and stocks going down. But, there is this phrase that our good friend and, I think, mutual mentor Mr. Rick Rule taught us, which is, “the cost of capital.” And now I come to interpret stock markets moving up or down as being the cost of capital, either declining or increasing.
When you have dropping stock prices, you have an increase in cost of capital, the seesaw. . .and then when you have surging share pricing, you have a dropping of cost of capital for the issuers.
So ideally, a buffeta feast, if you willis usually during the market context, in which you have an absolute liquidation. Where there’s a panic, [there’s] a shortage of capital across an entire sector or an entire market. And when we’re looking at the context of resource markets, natural resource exploration or development-stage companies are generally non-income producing companies. So they live on, let’s say, blocks of capital that may be between nine to 18 months, where every time they do a private placement, they’re simply buying time to continue their business activities.
If you have a period of, let’s say 20082009, during that market crash, coinciding with a period of a small exploration company, if the corporate treasurer [is] running down toward two, three, four months of capital remaining in the bank, that’s an ideal context to be a capital provider, to a host of companies that are in that circumstance.
Why is it ideal? One, because they need the money most desperately at that time. So, they’re in a position in which they want to negotiate. And then second, your competition has been cleared from the field. Very few people want to buy shares of anything in that context, let alone shares in a company that can be illiquid for a period of time, in that they have to commit a large amount of capital to a non-income-producing high-risk business.
So the two-part answer to the question is again, anytime is a good time to buy a private placement, provided that you have a high-quality management team, a high-quality basket of assets, at good termswhich is probably a separate question of, what are the good terms?
That’s the first part of the answer. And then the second is market-clearing events can be wonderful opportunities to buy any assets, but certainly, buying assets via private placement.
Maurice Jackson: Maybe something we should have covered before is, in your experience, is it usually junior mining companies, or is it the mining industry as a whole, that offers private placements? And let’s backtrack that question. What’s the difference between a junior mining company and a mining company?
Tekoa Da Silva: There’s a really smart gentleman who works here at Sprott and his name is Mr. Jeff Power. I once walked into his office and I asked him that very question, and he explained to me a conversation that he called the core asset classes of mining. And he explained it to me that you’ve got four asset classes. You’ve got your major producers, you’ve got your junior producers, your junior development-stage companies, and then your junior exploration-stage companies. Four categories. Majors at the top and then the juniors generally populate those three bottom categories.
You may have a mid-tier that populates that second category down, the junior producers. Let’s say one, two or three producing mines. But if it’s one producing mine, depending on the size of the mine, you’d probably want to consider it to be a junior.
Maurice Jackson: So the junior mining company is actually not extracting anything out of the ground, and like you referenced, it’s a research and development exercise. So if they’re not extracting anything out of the ground, they’re not able to generate revenue. And that’s where the terms come in, where you can really make it a lucrative endeavor for yourself here. So let’s talk about some of the terms. What are private placement terms?
Tekoa Da Silva: The terms are what you get in exchange for your money. And if you’re looking at a press release that a company has put out about a private placement, you always want to look at the first and second paragraph, where the terms are usually spelled out.
Private placementsagain in the North American context of natural resource exploration, natural resource industriesin that first and second paragraph, they’ll usually reference something that they call a unit. I would imagine a unit like an eggshell. You pop it open and there’s usually something inside. On the inside, there could be one thing or sometimes two things. If you’re buying shares, there should be one common share inside that shell. Sometimes they’ll add something extra, a warrant of some kind. A warrant is similar to a stock option. It gives an individual the right to buy an additional piece of common stock at a specified price, during this specified duration of time, and then it expires afterward.
A set of private placement terms could be something like this. A unit, a shell priced at CA$0.10, and inside the shell you’ve got two pieces. One is a common share and the second piece is a full warrant. And I say full warrant because sometimes it can be a half warrant, or some other fractional kind of warrant. But we’ll just say a full warrant.
So you’ve got a CA$0.10 cent unit, which includes one common share and then one warrant on the inside. And the warrant, let’s assume is exercisable at a CA$0.15 share price for a five-year period. That’s what they would call a five-year warrant. Exercise for CA$0.15 for a five-year period. And this unit is priced at CA$0.10.
And let’s just hypothetically assume also that the price of the common shares in the market, you’d be trading at CA$0.10, CA$0.11 or CA$0.12. So that’s maybe a typical set of private placement terms that you may see in a public press release. But these days, because market conditions are a bit more buoyant, capital is generally available, you don’t as often see five-year full warrants. You more often see 12-month, 24-month warrants, and quite often 12- and 24-month half warrants, as opposed to a full five-year warrant.
Maurice Jackson: Are private placement units sold at a discount?
Tekoa Da Silva: It may be. It depends on the appetite that is in the market for that issuer. If the cost of capital is a bit higher, they may offer it at a discount. If the cost of capital was temporarily low, like if there are surging prices, that placement unit may be offered at a premium in the market, because the market really want to have a warrant, and they’re willing to pay extra for it. Or the unit may match the price of the market.
It really depends on market conditions and it depends on the people that the issuing company [is] tapping for capital. It could be like a number of specialist, natural resource and brokerage firms. It could include newsletter publishers, other types of capital raising groups. The more interest there is, of course, the lower the cost of capital, or the worse the terms for the investor speculating, and the better the terms are for the issuer.
Maurice Jackson: Now, Tekoa, I don’t want to brag on myself, but I’d like to give a real life scenario here. So two years ago with a company, Novo Resources Corp. (NVO:TSX.V; NSRPF:OTCQX), they conducted a financing and it was at a $0.66, and then you had a full warrant, one year at $0.90. And we issued that financing opportunity to our subscribers. What occurred was Novo Resources, within four months, jumped to $8.55. That is a 1,400% return.
However, if you participated in the financing, irrespective of the current price, you were able to purchase the same quantity of shares that you purchased originally at $0.66, you could purchase them at $0.90, and that’s the value proposition that we’re trying to convey to you, regarding private placements.
I have one more question for you before we can conclude this first series and that is. . .what determines private placement terms?
Tekoa Da Silva: What determines the terms? Well, I think it’s kind of like a combination between cost of capital conditions in the marketplace, in the bidding atmosphere that is generated as a result, and the negotiating technique of both sides. I think it can be competitive. I have to tell you, I haven’t sat in on many private placement negotiations myself, watching two partners go at it. I’m usually one layer away from most of those direct negotiations. But I’ve seen some of them take place, I’ve been very close to and have participated in conversations in agreeing on price. And it can take as little as a few minutes of getting a sense of what both parties feel is reasonable, or it can be a more heated negotiation as some other people in the market may reference.
Maurice Jackson: This concludes part 1 on All About Private Placements. If you wish to have a conversation with Mr. Da Silva, e-mail [email protected]. If you want to find out which private placements have our attention at Proven and Probable, simply visit www.provenandprobable.com, place your correspondence in the subscribe box and let us know that you are accredited. Subscription is free, and we do not share your correspondence with third parties.
Maurice Jackson is the founder of Proven and Probable, a site that aims to enrich its subscribers through education in precious metals and junior mining companies that will enrich the world.
Disclosure: 1) Maurice Jackson: I, or members of my immediate household or family, own shares of the following companies mentioned in this article: Novo Resources. I personally am, or members of my immediate household or family are, paid by the following companies mentioned in this article: None. My company has a financial relationship with the following companies mentioned in this article: Novo Resources. Proven and Probable disclosures are listed below. 2) The following companies mentioned in this article are billboard sponsors of Streetwise Reports: None. Click here for important disclosures about sponsor fees. 3) Statements and opinions expressed are the opinions of the author and not of Streetwise Reports or its officers. The author is wholly responsible for the validity of the statements. The author was not paid by Streetwise Reports for this article. Streetwise Reports was not paid by the author to publish or syndicate this article. The information provided above is for informational purposes only and is not a recommendation to buy or sell any security. Streetwise Reports requires contributing authors to disclose any shareholdings in, or economic relationships with, companies that they write about. Streetwise Reports relies upon the authors to accurately provide this information and Streetwise Reports has no means of verifying its accuracy. 4) This article does not constitute investment advice. Each reader is encouraged to consult with his or her individual financial professional and any action a reader takes as a result of information presented here is his or her own responsibility. By opening this page, each reader accepts and agrees to Streetwise Reports’ terms of use and full legal disclaimer. This article is not a solicitation for investment. Streetwise Reports does not render general or specific investment advice and the information on Streetwise Reports should not be considered a recommendation to buy or sell any security. Streetwise Reports does not endorse or recommend the business, products, services or securities of any company mentioned on Streetwise Reports. 5) From time to time, Streetwise Reports LLC and its directors, officers, employees or members of their families, as well as persons interviewed for articles and interviews on the site, may have a long or short position in securities mentioned. Directors, officers, employees or members of their immediate families are prohibited from making purchases and/or sales of those securities in the open market or otherwise from the time of the interview or the decision to write an article until three business days after the publication of the interview or article. The foregoing prohibition does not apply to articles that in substance only restate previously published company releases.
Proven and Probable LLC receives financial compensation from its sponsors. The compensation is used is to fund both sponsor-specific activities and general report activities, website, and general and administrative costs. Sponsor-specific activities may include aggregating content and publishing that content on the Proven and Probable website, creating and maintaining company landing pages, interviewing key management, posting a banner/billboard, and/or issuing press releases. The fees also cover the costs for Proven and Probable to publish sector-specific information on our site, and also to create content by interviewing experts in the sector. Monthly sponsorship fees range from $1,000 to $4,000 per month. Proven and Probable LLC does accept stock for payment of sponsorship fees. Sponsor pages may be considered advertising for the purposes of 18 U.S.C. 1734.
The Information presented in Proven and Probable is provided for educational and informational purposes only, without any express or implied warranty of any kind, including warranties of accuracy, completeness, or fitness for any particular purpose. The Information contained in or provided from or through this forum is not intended to be and does not constitute financial advice, investment advice, trading advice or any other advice. The Information on this forum and provided from or through this forum is general in nature and is not specific to you the User or anyone else. You should not make any decision, financial, investments, trading or otherwise, based on any of the information presented on this forum without undertaking independent due diligence and consultation with a professional broker or competent financial advisor. You understand that you are using any and all Information available on or through this forum at your own risk.
Shares of Kodiak Sciences traded more than 100% higher at times after the company reported that it entered into a $225 million royalty agreement for the firm’s KSI-301 used in the treatment of retinal vascular diseases including age-related macular degeneration and diabetic eye diseases.
This morning, clinical stage biopharmaceutical company Kodiak Sciences Inc. (KOD:NASDAQ), which specializes in developing novel therapeutics to treat chronic, high-prevalence retinal diseases, announced that “it has entered into a funding agreement to sell a capped royalty right on global net sales of KSI-301 to Baker Bros. Advisors for $225 million.”
The company explains that KSI-301 is Kodiak’s investigational therapy being developed for the treatment of retinal vascular diseases including age-related macular degeneration and diabetic eye diseases.
Under the terms of the agreement, Baker Bros. Advisors (BBA) purchased a capped 4.5% royalty on net sales of Kodiak’s antivascular endothelial growth factor (anti-VEGF) medication. The royalty is to be paid upon marketing approval in exchange for $225 million in committed development funding payable to Kodiak Sciences. The report noted that the royalty “caps” or terminates when BBA has received an aggregate amount equal to 4.5 times the total funding amount paid to Kodiak.
According to the terms of the royalty agreement, BBA will pay Kodiak $100 million upon the closing of the funding transaction, which is expected to occur on January 10, 2020, with payment of the remaining $125 million predicated upon Kodiak achieving certain objectives. This includes, among other things, 50% enrollment in the firm’s two planned pivotal clinical studies of KSI-301 in patients with retinal vein occlusion estimated to occur in late 2020.
Kodiak Sciences Chairman and CEO Victor Perlroth, MD, commented, “In thinking through how best to finance our accelerating clinical, manufacturing and commercial plans for KSI-301 and our ABC platform, royalty funding is meaningfully less dilutive than equity and preserves both our future financing and strategic flexibility…This royalty financing provides the foundation to fund the KSI-301 development program through our 2022 Vision of pivotal read-outs in retinal vein occlusion, wet age-related macular degeneration and diabetic macular edema and our anticipated Biologics License Application (BLA) and supplemental BLA submissions.”
In the report, the firm identifies KSI-301 as an investigational anti-VEGF therapy built on the company’s Antibody Biopolymer Conjugate (ABC) Platform designed to maintain potent and effective drug levels in ocular tissues for longer than existing agents. “Kodiak’s objective with KSI-301 is to develop a new first-line agent to improve outcomes for patients with retinal vascular diseases and to enable earlier treatment and prevention of vision loss for patients with diabetic eye disease. The company’s DAZZLE pivotal study in patients with treatment-naïve wet AMD was initiated in October 2019.”
Kodiak Sciences is headquartered in Palo Alto, Calif., and describes its business as a clinical stage biopharmaceutical company specializing in novel therapeutics to treat chronic, high-prevalence retinal diseases. The firm states that “it has leveraged its ABC Platform to build a pipeline of product candidates in various stages of development including KSI-501, its bispecific anti-IL-6/VEGF biopolymer conjugate for the treatment of neovascular retinal diseases with an inflammatory component, and is expanding its early research pipeline to include ABC Platform based triplet inhibitors for multifactorial retinal diseases such as dry AMD and the neurodegenerative aspects of glaucoma.”
Kodiak Sciences began the day with a market capitalization of about $1.1 billion with approximately 37.06 million shares outstanding and a short interest of around 7.40%. KOD shares opened almost 20% higher today at $35.00 (+$5.40, +18.24%) over Friday’s $29.60 closing price, and then proceeded to take off setting a new 52-week intraday high price of $72.87. Since the open, the stock has traded between $35.00 to $72.87 per share and is presently trading at $48.72 (+$19.12, +64.59%).
Disclosure: 1) Stephen Hytha compiled this article for Streetwise Reports LLC and provides services to Streetwise Reports as an independent contractor. He or members of his household own securities of the following companies mentioned in the article: None. He or members of his household are paid by the following companies mentioned in this article: None. 2) The following companies mentioned in this article are billboard sponsors of Streetwise Reports: None. Click here for important disclosures about sponsor fees. 3) Comments and opinions expressed are those of the specific experts and not of Streetwise Reports or its officers. The information provided above is for informational purposes only and is not a recommendation to buy or sell any security. 4) The article does not constitute investment advice. Each reader is encouraged to consult with his or her individual financial professional and any action a reader takes as a result of information presented here is his or her own responsibility. By opening this page, each reader accepts and agrees to Streetwise Reports’ terms of use and full legal disclaimer. This article is not a solicitation for investment. Streetwise Reports does not render general or specific investment advice and the information on Streetwise Reports should not be considered a recommendation to buy or sell any security. Streetwise Reports does not endorse or recommend the business, products, services or securities of any company mentioned on Streetwise Reports. 5) From time to time, Streetwise Reports LLC and its directors, officers, employees or members of their families, as well as persons interviewed for articles and interviews on the site, may have a long or short position in securities mentioned. Directors, officers, employees or members of their immediate families are prohibited from making purchases and/or sales of those securities in the open market or otherwise from the time of the interview or the decision to write an article until three business days after the publication of the interview or article. The foregoing prohibition does not apply to articles that in substance only restate previously published company releases. 6) This article does not constitute medical advice. Officers, employees and contributors to Streetwise Reports are not licensed medical professionals. Readers should always contact their healthcare professionals for medical advice.
Sector expert Michael Ballanger offer his latest insights into the markets and his investment strategy as 2019 winds down.
“Gold is money; everything else is credit.” J.P. Morgan
Dating back to the mid-80s, and usually around the end of November, I begin to formulate strategies and portfolios looking out to the upcoming New Year, taking into account technical, fundamental and geopolitical factors in an effort to avoid career-ending draw-downs while posting a respectable degree of performance.
Being a player in both the commodity and equity arenas, it is no surprise that over the past forty years of covering precious metals and stocks, the landscape has changed in a manner that defies the term “evolution.” A better term to describe the metamorphosis in the credit and equity markets, particularly since 2009, would be the use of the term “deformation,” as government-sponsored intervention has thrown a toxic curve ball at the analytical batter’s box. The days where charts of the Dow Jones and five-year gross domestic product (GDP) growth could be coupled with few bank-generated reports on the economy to arrive at a bullish/bearish stance are gone forever, joining the dodo bird and human traders on the list of extinct species. Whereas the two primary drivers of market volatility used to be fear and greed, the only driver left today is policy, as in central bank usage of financial markets to govern final demand.
Years ago, I first learned of the term “full, true, and plain disclosure” while studying to obtain my securities license. This term was in every offering prospectus issued by the underwriting departments of the major brokerage firms during a period where, in Canada, no banks were permitted to dabble. (After June 30, 1987, Canadian banks began absorbing all of the privately held investment firms.) As we move rapidly from 2019 to 2020, that term has to be altered slightly to reflect the more pressing issues facing investors, such that the word “disclosure” is to be replaced by the word “discovery.” All commodities and or securities, whether debt or equity, that are publicly traded must be done so under the proviso of “full, true, and plain discovery.”
I offer this suggestion in the interest of addressing the issue of market integrity because since 2009, and with rapidly accelerating frequency, these blatant interventions and constant interference have combined with diabolical ferocity in removing the “full, true, and plain” descriptives from the term “price discovery,” and without those three words, all markets devolve into chaotic cesspools of randomness.
You see, absent the rule of law, all societies become feral; absent proper price discovery, all markets become unpredictable. Stated another way, driving at night demands that roads have markings. Absent those markings, roads become hazardous.
As an analyst, I have been forced to drive always at night, headlights off, moon behind dark clouds and with no road markings whatsoever. This is because the markets of yore, in which I was trained, were anchored in “true, full, and plain price discovery.” I went through the 19811982 bear market, where the inflation-fighting Fed under Paul Volcker withheld the supply of credit to the banks, allowing true price discovery (large demand versus limited supply) to raise the cost of credit to 15% while crushing inflationary expectations, which modified consumer behavior.
What followed was the biggest equity boom in history, as the 19822000 bull market rode a wave of animal spirits to record highs. During this bull run, stock market addicts could barely come up with the name of the Federal Reserve chairman and were hard-pressed to tell you what the Fed funds rate was.
However, all through this period, prices were allowed to free rein, without the management or direction of the central bankers and/or treasury departments. Since analysts were able to clearly see the center lines and shoulders, the road to equity market riches was navigable regardless of the skies and time of day. Markets were far simpler and infinitely healthier than they are today, and it is all because participants are no longer governed by true, full, and plain price discovery. Investment decisions are made today based upon “policy,” and as long as the global central banks are “dove-ish,” the green light for excessive speculation remains in the “on” position. with nary a blink at economic signals such as weakening PMIs or soft retail sales numbers. And this, I submit, is a recipe for disaster.
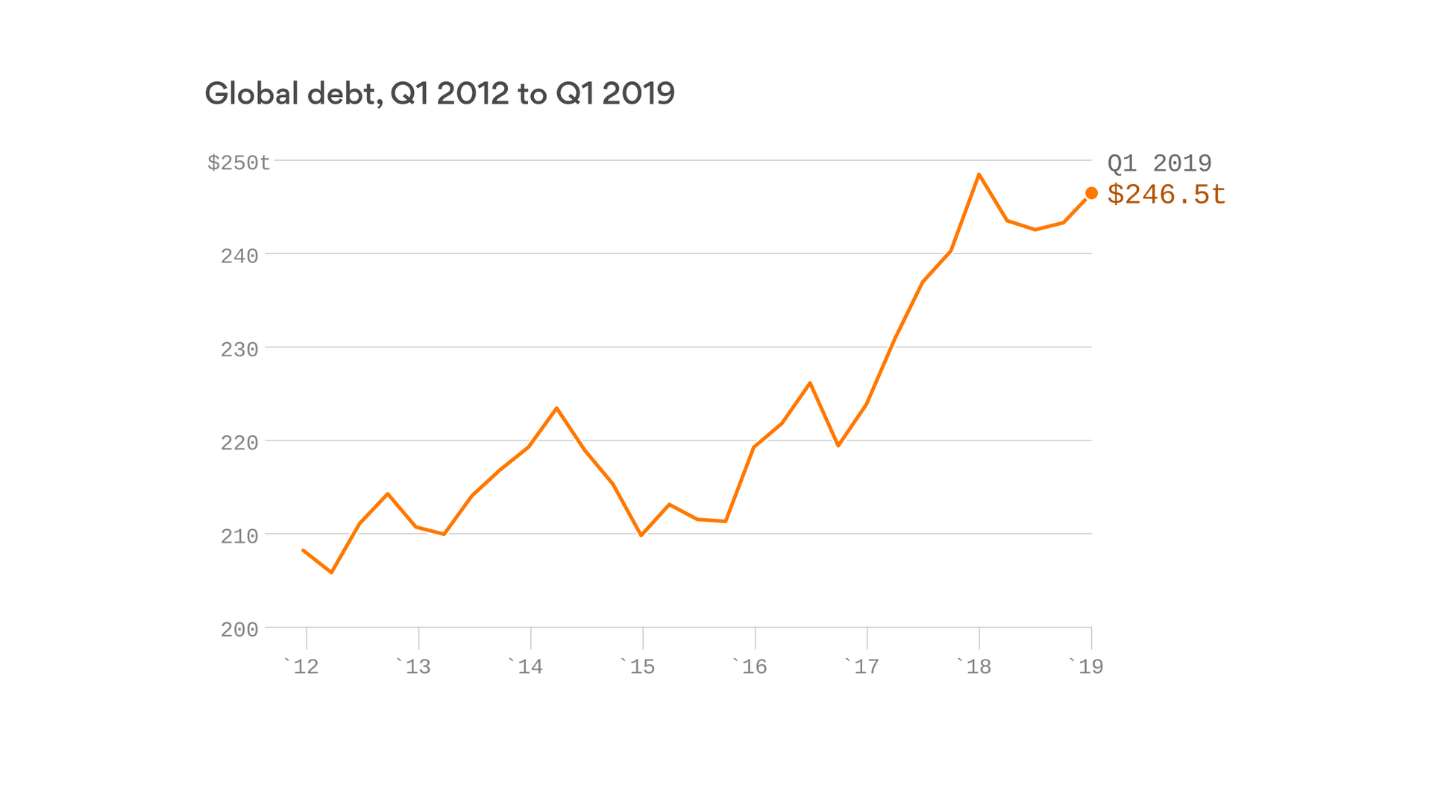
To the extent that past is prologue, the actions of the G7 central banks from 2009 to 2020 are massively inflationary, as over $14 trillion in new credit was issued by the U.S. Fed alone. Add the other nations, and the number approaches $250 trillion, as the Bank of Japan alone had been on a reflation campaign for over thirty years.
So again, anyone with any hair left, gray or otherwise, would construct an investment strategy designed to insulate one’s wealth from the ravages of currency debasement. That would include ample allocations to resources, including gold and silver, while being underweight on bonds. Every era of Fed stimuli prior to 2009 ushered in weak credit markets and strong commodity markets because participants were following the road markings that helped them to avoid crashes due to poor conditions.
However, after the 20072008 financial crisis, interventions designed to protect the banks at taxpayer expense accelerated, and as if with the stroke of a brush, the road markings were suddenly altered. As unemployment declined and economies recovered, interest rates for the first time ever did not rise; they declined. In fact, until a few months back, over 60% of sovereign debt was yielding negative returns. This abhorrent behavior is a deformation of the highest order, and one that has moral hazard readings well beyond the red line.
With the preceding paragraphs as a disclaimer of sorts, I ask that you all use the term “caveat emptor” as a precursor in consideration of my forecasts. I am investing today and in 2020 on the assumption that these cretins in government and in central banking are going to be neutered in their dominance over pricing. If, as and when that happens, the reversion of hard assets to the mean is going to result in a new paradigm, whereby the maximum of market participants are gored with a miniscule number enriched. As the ancient axiom explains, markets tend to inflict the maximum amount of damage and pain upon the vast majority while the hard-to-find contrarians sail off into the sunset. As such, gold and silver remain my primary holdings because they have been the primary victims of intervention and interference since 2009.
A few weeks ago, I proposed that if you were able to sequester H.G. Wells’ “Time Machine” and set the dial for 1977, you would arrive at the floor of the Chicago Mercantile Exchange to interview a trader, operating with only a pencil and an order book, receiving oral instructions from one of his “runners.” No computers, no algorithms and no pattern-recognition technology spitting out high-frequency orders 500,000 times the speed of the 1977 order flow. Had you informed the trader (with long hair, deep sideburns, platform shoes and smoking a Marlboro) that in 2019, the federal debt would be $23 trillion, he would immediately look at the 1977 debt level at $700 billion; race over to the precious metals pits; sell all his stocks and bonds; and buy gold and silver.
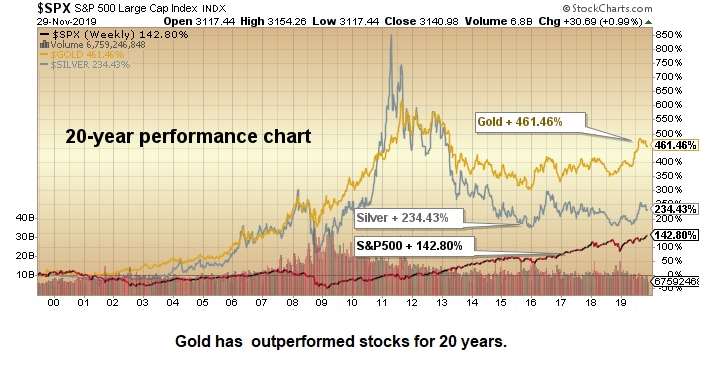
U.S. federal debt has increased 34.28 times in 42 years, and since gold was $135/ounce in 1977, our trader would surmise that since gold has been correlated to federal debt since the Dawn of Creation, a price tag of US$4,628/ounce was not unrealistic. A 1977 Dodge Ram was US$5,200 back then; it is over US$80,000 today, a 15-fold increase. The average cost of a detached house in Toronto was CA$41,500 in 1977, it is CA$810,000, a 19.5-fold increase. Gold, despite being the best performer since 2001, is still only ahead 10x in forty-two years. The 5,000-year-old role as the anti-inflation “wealth preserver” has been largely absent due to what I call “central bank hostilities.”
Nevertheless, the case for a return to normalcy in the area of price discovery is one borne out of optimism for the integrity of markets. The GGMA portfolio constructed last January is ahead 163% year to date (YTD), and really hasn’t budged since my sell signal for the metals on Sept. 4. I have since bought back all of the gold miner ETFs below where they reside today, so the $6 haircut in GDXJ and $4 clip in GDX were completely avoided, and today I am 100% long once again.
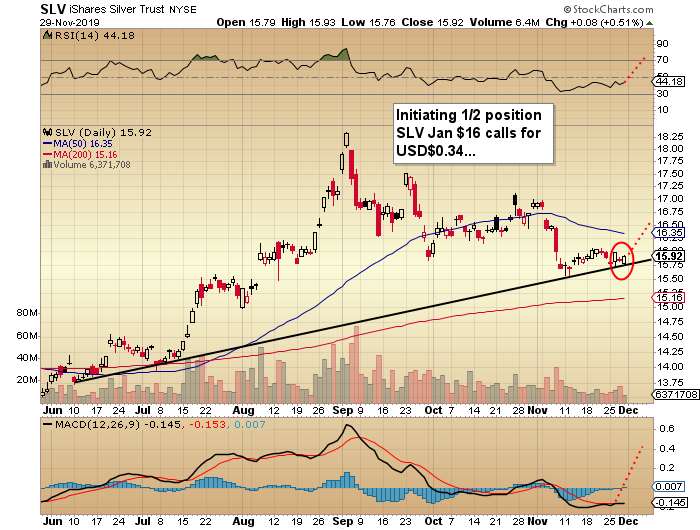
Now, for the gunslingers, I am short the gold-to-silver-ratio (GSR) at 92.40, and look for 70 by mid-2020. I am also long March silver from US$17.05, and recently added a whack of the SLV January $16 calls at US$0.34. These highly speculative positions are outside of the GGMA portfolio and are for the risk-tolerant only. Stop-loss for March silver is at US$16.70.
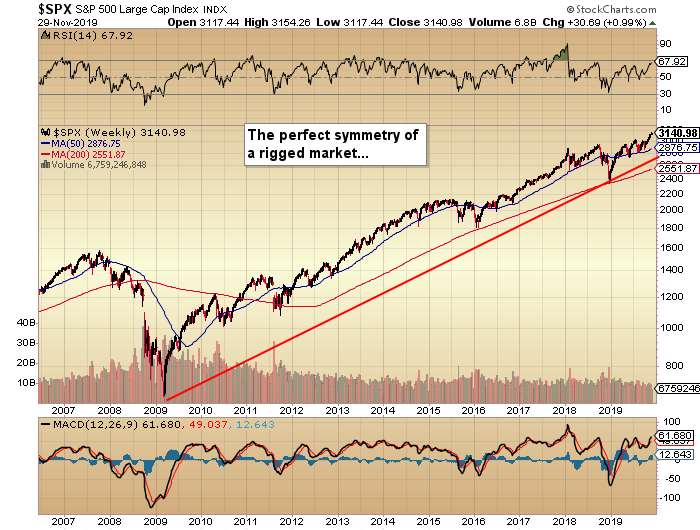
Stocks, as represented by the S&P500, are currently in “melt-up mode,” where portfolios managers are scrambling to recapture the alpha they lost by being underweight stocks/overweight cash/hedged going into Q4. When stocks failed to repeat last year’s Q4 swoon as predicted here in early October, it set the stage for a buying panic.
I wrote this in early October: “Maniacal rants set aside, history would show that purchases of common stocks during the last two weeks of October have proven to be the timeliest of purchases for the investor class.” The S&P was 2,986 when I wrote that, and last week it closed out at 3,140. A 5.1% move from early October to late November has been largely orchestrated by underinvested managers desperate to exceed their benchmarks going into year-end. Amazing how the threat of lost bonuses serves to motivate the hedgies. . .
Speaking of forward guidance, I continue to follow with great interest the charts of uranium and vanadium, one an energy metal and the other a battery (and industrial) metal. With some fifty new reactors under construction around the world, one would expect a pickup in uranium prices at some point.
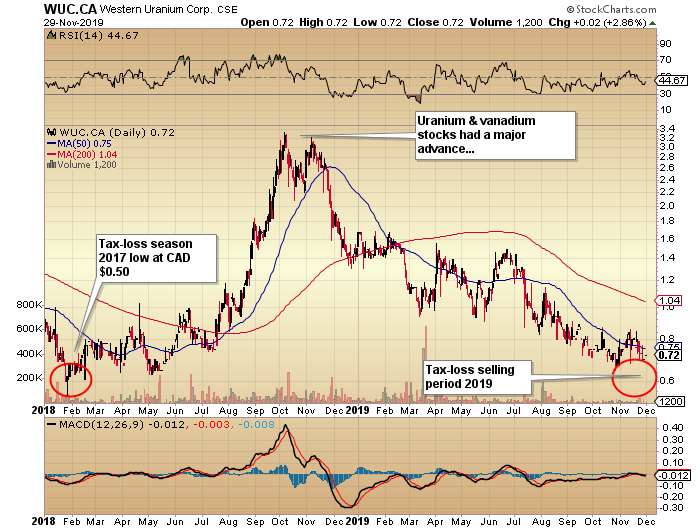
As for V2O5, China’s construction slowdown is an offset to the new rebar rules regarding steel hardness, which is an obvious boon for vanadium demand. Yet prices are still in retreat after peaking in the mid-$30s two years ago. Section 232, favoring domestic producer/developer names (like Western Uranium & Vanadium), could get a substantial tailwind when we finally see what the Working Group has in store for them in terms of credits and/or subsidies. I am adding to WUC as we approach the tax-loss selling period (mid-December) at or around the 52-week low of CA$0.65.
It is crucial to recognize that when the uranium sector turns, companies with domestic resources and tight market caps can quintuple in a New York minute, as even the slightest jump in investor interest can have a sizable impact on price, as we saw in 2018 with WUC’s run from CA$0.50 to CA$3.37 in under six months.
I head into 2019 with the distinctly mixed emotions, as silver continues to struggle to regain its mojo after peaking in September at US$19.75. Blind optimism, on the basis of strong fundamentals, is faced with the historic, paper-market stranglehold around the throats of silver investors worldwide. It is not very much fun when price action defies the fundamentals. Just as the S&P500 has, in my view, no business being above 2,500 on the basis of valuation (elevated P/E), my friendly margin clerk could care less about my opinion when I am locked in a short squeeze and cash call. In the end, only price matters, which underpins and reinforces the need for stop losses when trading the metals.
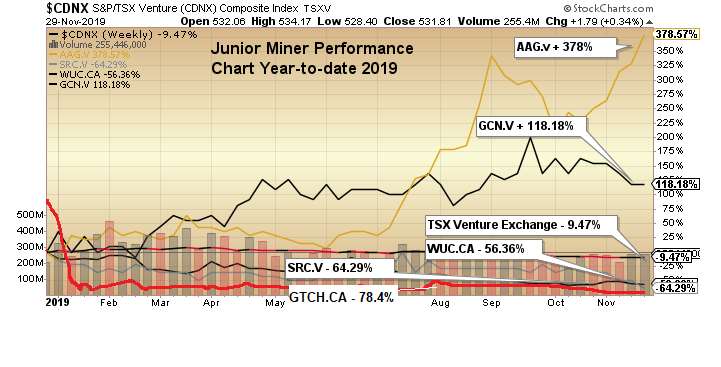
There is one last point for today’s missive. If I am correct in my bullish outlook for gold and silver, those tiny, little micro-cap junior exploration companies, many of which were touching 52-week lows last week, are going to come back into favor. To be sure, they are certainly out of favor today, but give me a US$1,650 gold price and US$23 silver, and I’ll show you ten, twenty, thirty-baggers in many of these beat-up names.
There is a plethora of companies with decent projects that are trading at fire-sale prices, and as cheap as they are, they could be even cheaper by mid-month. I’ll be e-mailing a list of my personal tax-loss purchase candidates next weekend, so if you wish to be included in the mailing, e-mail me at [email protected] with your request. (NB: It will be the last freebie before the subscription service is launched in January 2020).
Originally trained during the inflationary 1970s, Michael Ballanger is a graduate of Saint Louis University where he earned a Bachelor of Science in finance and a Bachelor of Art in marketing before completing post-graduate work at the Wharton School of Finance. With more than 30 years of experience as a junior mining and exploration specialist, as well as a solid background in corporate finance, Ballanger’s adherence to the concept of “Hard Assets” allows him to focus the practice on selecting opportunities in the global resource sector with emphasis on the precious metals exploration and development sector. Ballanger takes great pleasure in visiting mineral properties around the globe in the never-ending hunt for early-stage opportunities.
Disclosure: 1) Michael J. Ballanger: I, or members of my immediate household or family, own securities of the following companies mentioned in this article: Aftermath Silver, Western Uranium & Vanadium, Getchell, Stakeholder, Goldcliff Resource. My company has a financial relationship with the following companies referred to in this article: Aftermath, Getchell Gold and Western Uranium and Vanadium. I determined which companies would be included in this article based on my research and understanding of the sector. Additional disclosures are below. 2) The following companies mentioned in this article are billboard sponsors of Streetwise Reports: Great Bear Resources, Goldcliff Resource. Click here for important disclosures about sponsor fees. As of the date of this article, an affiliate of Streetwise Reports has a consulting relationship with Aftermath Silver, Western Uranium and Vanadium. Please click here for more information. 3) Statements and opinions expressed are the opinions of the author and not of Streetwise Reports or its officers. The author is wholly responsible for the validity of the statements. The author was not paid by Streetwise Reports for this article. Streetwise Reports was not paid by the author to publish or syndicate this article. Streetwise Reports requires contributing authors to disclose any shareholdings in, or economic relationships with, companies that they write about. Streetwise Reports relies upon the authors to accurately provide this information and Streetwise Reports has no means of verifying its accuracy. 4) This article does not constitute investment advice. Each reader is encouraged to consult with his or her individual financial professional and any action a reader takes as a result of information presented here is his or her own responsibility. By opening this page, each reader accepts and agrees to Streetwise Reports’ terms of use and full legal disclaimer. This article is not a solicitation for investment. Streetwise Reports does not render general or specific investment advice and the information on Streetwise Reports should not be considered a recommendation to buy or sell any security. Streetwise Reports does not endorse or recommend the business, products, services or securities of any company mentioned on Streetwise Reports. 5) From time to time, Streetwise Reports LLC and its directors, officers, employees or members of their families, as well as persons interviewed for articles and interviews on the site, may have a long or short position in securities mentioned. Directors, officers, employees or members of their immediate families are prohibited from making purchases and/or sales of those securities in the open market or otherwise from the time of the interview or the decision to write an article until three business days after the publication of the interview or article. The foregoing prohibition does not apply to articles that in substance only restate previously published company releases. As of the date of this article, officers and/or employees of Streetwise Reports LLC (including members of their household) own securities of Aftermath Silver, Western Uranium and Vanadium, Getchell and Stakeholder, companies mentioned in this article.
Charts provided by the author.
Michael Ballanger Disclaimer: This letter makes no guarantee or warranty on the accuracy or completeness of the data provided. Nothing contained herein is intended or shall be deemed to be investment advice, implied or otherwise. This letter represents my views and replicates trades that I am making but nothing more than that. Always consult your registered advisor to assist you with your investments. I accept no liability for any loss arising from the use of the data contained on this letter. Options and junior mining stocks contain a high level of risk that may result in the loss of part or all invested capital and therefore are suitable for experienced and professional investors and traders only. One should be familiar with the risks involved in junior mining and options trading and we recommend consulting a financial adviser if you feel you do not understand the risks involved.