Equity markets continued to whipsaw. The equity index recovered from Tuesday’s losses. This comes as news sources cite that the US and China were moving closer to an agreement. President Trump was also seen confirming that the trade talks were going well.
Euro Trades Mixed Amid Weak US Data
The Institute of Supply Management’s non-manufacturing activity slowed in November. The latest figures show that services activity slowed to 53.9 on the index. This was down after the index rose slightly to 54.7 in the month before. The slowdown in the services sector comes amid a contraction in the manufacturing sector.
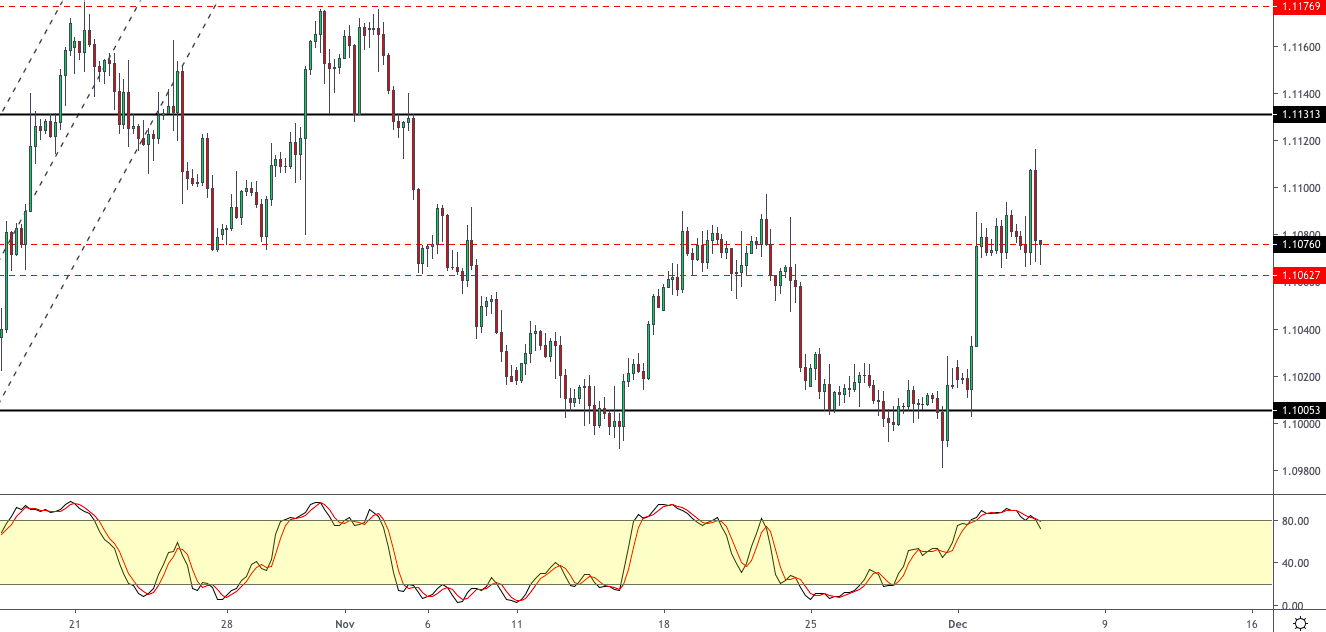
EURUSD Establishing Support
The currency pair briefly slipped back to the previously established resistance level of 1.1062 – 1.1075. If this support level holds, then the currency pair could be on track for further gains. The next upside target is at 1.1131 level. To the downside, only a clear break below the current levels will confirm a shift in the bias.
Crude Oil Gains on Inventory Drawdown
The latest weekly inventory report by the Energy Information Administration (EIA) showed a drawdown in oil inventories. For the week ending November 29, crude oil prices fell 1.6 million barrels. This comes after a consistent weekly build up in oil inventories. The upcoming OPEC meeting is also weighing on the oil trades.
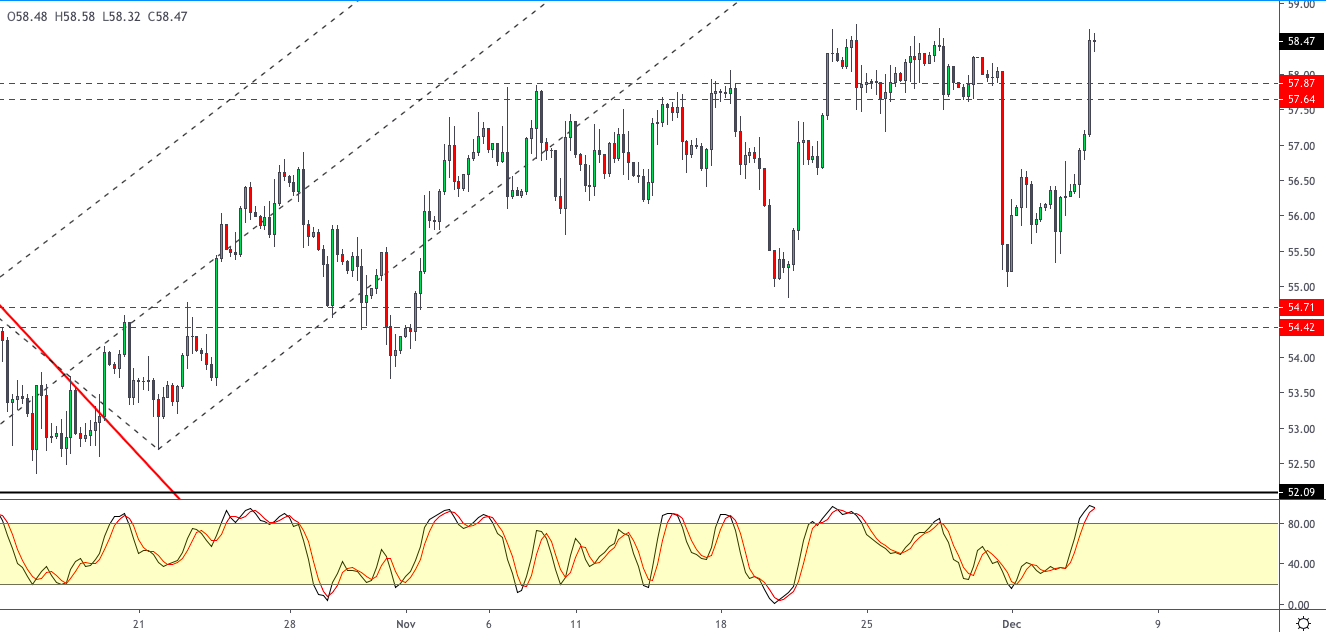
WTI Breaks Past Resistance
Crude oil prices broke past the resistance level of 58.00, rising over 3% on the day. The breakout past the resistance area confirms potential further upside. There is scope for WTI Crude oil to retrace back to the 58 region to establish support. As long as this level holds, price action could see further gains with 60.00 as the next main level of interest.
Pound Sterling Gains as Odds of a Tory Win Rises
The pound sterling continued to advance gains, rising to a seven month high on Wednesday. The currency picked up momentum after latest polls put the Conservative party in the lead. Besides leading the polls, the rally comes as investors hope that PM Johnson’s party will win a majority. This is expected to pave way for a Brexit deal which is due for review by January 31, 2020.
GBPUSD at 7-month High But at Risk of a Pullback
The cable managed to post strong gains as it broke past the resistance level of 1.2960. The clear breakout above this level indicates further upside. But there is a risk that the currency pair could be looking to retrace the gains. A retest of the 1.2960 level to establish support will see price action establishing itself toward further gains. For the moment, the price level of 1.3100 could be holding out as resistance.
You may think (or hope) that in your daily life you don’t need to worry about unknowingly eating or otherwise ingesting crude oil or any of its many, many petrochemical byproducts. But you would be wrong. And not just a little wrong–very, very wrong. Petroleum-based substances are in all kinds of innocuous-seeming things that we willingly put into our bodies. Even though petrochemicals are not technically (or really any other adverb you want to insert here) edible, we eat quite a lot of them.
Petrochemicals–substances that are essentially poisonous for human consumption–are even hiding in your medicine. Some of the most seemingly innocuous substances in your home are absolutely coated in it, in fact. “Petrochemicals cumene, phenol, benzene, and other aromatics are used to make not only aspirin, but also penicillin and cancer-fighting drugs,” reports Science Notes. “Ultimately, most drugs are organic molecules made using petrochemical polymer. Those that are not are often purified using petrochemical resins. Polymers are used to make pill capsules and coatings. Time-release drugs rely on a tartaric acid-based polymer that slowly dissolves, administering just the right dose of medication.” What’s more, according to the Petro Industry News, “they may not necessarily be classified as ‘edibles’ but painkillers and vitamins are often packed full of petrochemicals. They contain acetylsalicylic acid, the active ingredient in a multitude of over the counter painkillers such as aspirin.”
Common toiletries such as toothpaste are petrochemical-based as well. Even most people spit out their toothpaste, it’s inevitable that a fair bit of it gets ingested. Many prominent toothpaste brands use not just one petroleum-based ingredient, but two (and that’s without taking into account the petroleum-based plastic packaging). “Many of the most popular toothpastes available today are made with sodium lauryl sulfate, a product commonly made from petroleum. Sodium saccharin is another ingredient often found in toothpaste; it is a sweetener made from petroleum,” writes Portland State University’s Ecolife Project Blog. The average adult will use about 20 gallons of toothpaste over their lifetime.
We tend to look at drugs and toiletries as a category far away from food, even though we often ingest them orally and they end up in our stomachs along with everything else we eat. Because of this, maybe it doesn’t seem so crazy that petro-products that were once crude oil are in our medicine because we are aware that medicine is synthesized and created in laboratories full of all kinds of chemicals. But when it comes to actual food, most of us would never imagine that there is crude oil lurking in our fridges and pantries. But there is. And a lot more of it than you would expect.
Thought Co. reports that “petrochemicals are used to make most food preservatives that keep food fresh on the shelf or in a can. In addition, you’ll find petrochemicals listed as ingredients in many chocolates and candies. Food colorings made with petrochemicals are used in a surprising number of products including chips, packaged foods, and canned or jarred foods.” Chewing gum also includes crude oil as the basis for not just one but many of its primary ingredients. LiveScience reports that “People who enjoy the snap and long-lasting texture of their chewing gum can give a nod of thanks to petroleum-derived polymers. Today’s gum bases can consist of both natural latexes and petroleum products such as polyethylene and paraffin wax, which also means most gums are non-biodegradable. But the first chewing gums typically relied upon the natural latex known as chicle — still the gum base of choice for some upscale gum brands and certain regional markets.”
This is to say nothing of the synthetic petrochemical fertilizers that are used to grow nearly all of the produce that we consume (especially in more developed countries) and that give nitrogen, phosphorous, and potassium to our soils and the fruits and vegetables grown from them. As summed up by Thought Co., “More than a billion pounds of plastic, all made with petrochemicals, find use annually in U.S. agriculture. The chemicals are used to make everything from plastic sheeting and mulch to pesticides and fertilizers. Plastics are also used to make twine, silage, and tubing. Petroleum fuels are also used to transport foods (which are, of course, stored in plastic containers).” In fact, our entire food system is fueled by oil, and agriculture is responsible for a quarter of all greenhouse gas emissions, making it the second biggest greenhouse gas-emitting sector after the energy sector itself.
While we as consumers may not be aware of or mindful about the fact that so much of the things that we choose to consume contain some amount of crude oil in the form of petrochemicals, at least the petrochemicals were put there on purpose and are therefore almost certainly measured or regulated in some way. But there are also plenty of things that we consume that are full of petrochemicals that are not supposed to be there at all. And it’s no simple feat to avoid consuming these hidden petrochemicals, because one of the most common sources is something that we can’t live without: water.
“We’re Literally Eating and Drinking Plastic. Fossil Fuels Are To Blame.” proclaims non-profit organization Food & Water Watch. “Everyone drinks water, and whether you drink tap water or bottled water, you are very likely ingesting some level of plastic pollution,” the article continues. This assertion is based on a study by Orb Media, which found that of 159 drinking water samples tested, sourced from cities and towns around the world, 83 percent contained microplastic fibers. “That means food prepared with plastic-contaminated water becomes contaminated as well.”
While consumers may think that the solution is in bottled water, they would be wrong. “Bottled water samples fared even worse than tap water—unsurprising because it is manufactured with plastic. Another recent study by the same organization found 90 percent of bottled water analyzed from around the world contained plastic microfibers. A single bottle of Nestlé Pure Life had concentrations of microfiber plastics up to 10,000 pieces per liter. The type of plastic used to make bottle caps was the most common type of microplastic fiber found in bottled water.” And it’s not just water that contains microplastics that are in no way supposed to be there. Microplastics have also been found in sea salt, seafood, beer, honey and sugar.
It is widely accepted that in order to avoid catastrophic climate change, the world needs to decarbonize in a serious and urgent manner. But while this may seem like a relatively simple goal on the surface, looking into the complex web of petrochemical tracing shows just how ubiquitous petrochemistry has become in our lives. Not even our food is carbon-free. Not even our water is without traces of crude oil. This article didn’t even touch the drastic quantity of crude oil’s carbon emissions that are in the very air we breathe. The oil industry’s control and saturation of the market has far-reaching implications that are unbelievably complex and simultaneously invisible. At the same time that we go through our lives without thinking in any serious way about crude oil and its place in our lives, it is already in our bodies. We carry the responsibility of decarbonization and its quite literal burden within us. There is no opting out.
The US dollar fell against a basket of major currencies during yesterday’s trading. The dollar index (#DX) closed yesterday in the red zone (-0.11%). Yesterday, weak economic data were published in the US. ADP nonfarm employment change grew only by 67K in November, while experts expected an increase by 140K. The ISM non-manufacturing PMI counted to 53.9 in November instead of 54.5.
Contradictory statements by the US President also put pressure on the US dollar. So, on Tuesday, the President said that negotiations with China were likely to be postponed until the US presidential election in 2020. However, an official said yesterday that the talks were going “very well.”
Yesterday, the Bank of Canada decided on a key interest rate. The indicator was left unchanged at the level of 1.75%. Today we expect the publication of Ivey PMI.
Today, weak economic data have been published in Australia during the Asian trading session. Retail sales did not change in October, while experts forecasted an increase by 0.3%. The trade balance counted to 4.502B instead of 6.100B.
The “black gold” prices are declining moderately. At the moment, futures for the WTI crude oil are testing the $58.50 mark per barrel.
Market Indicators
Yesterday, there was the bullish sentiment in the US stock market: #SPY (+0.62%), #DIA (+0.56%), #QQQ (+0.51%).
The 10-year US government bonds yield has been growing. At the moment, the indicator is at the level of 1.77-1.78%.
The Economic News Feed for 05.12.2019:
– Eurozone GDP data at 12:00 (GMT+2:00);
– Initial jobless claims in the US at 15:30 (GMT+2:00);
New Zealand data have been positive since mid-November. Will the NZDUSD increase continue?
New Zealand’s economic data have been strong on balance after the Reserve Bank of New Zealand raised interest rates a quarter point to 1% in mid-November: retail sales growth accelerated in Q3 to 4.5% over year from 2.9% in Q2, the trams of trade rose to 1.9% over quarter from 1.4% in Q2, and the balance of trade deficit narrowed more than expected in October. Stronger New Zealand data are bullish for NZDUSD.
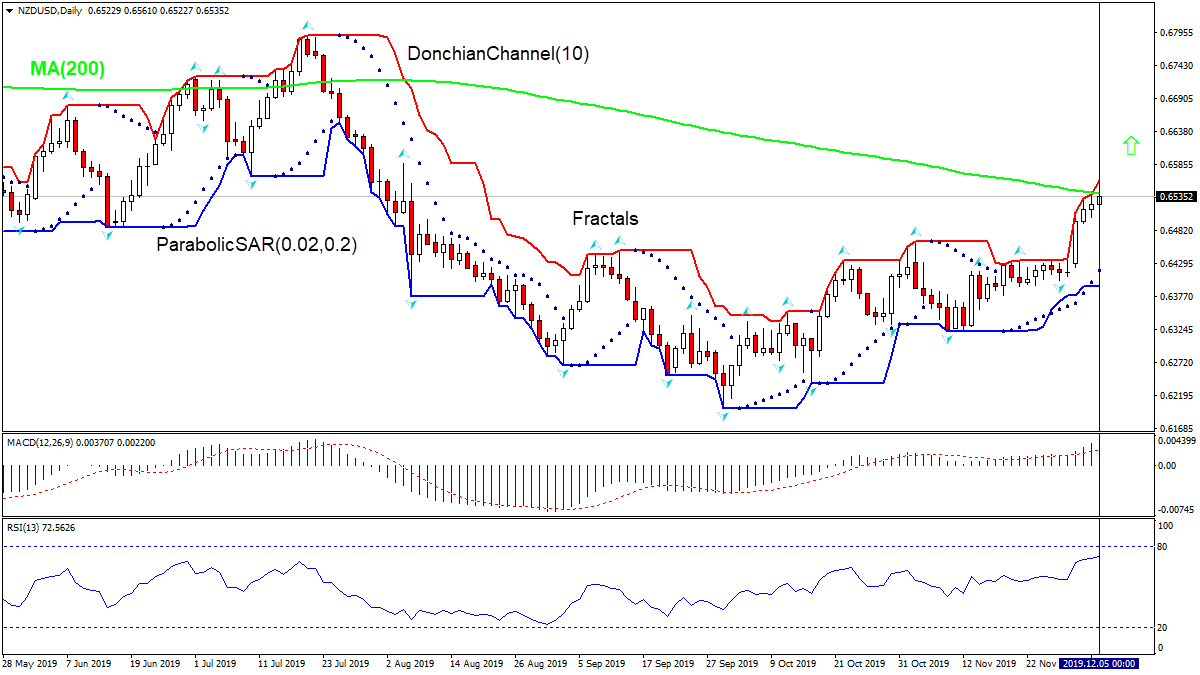
On the daily timeframe NZDUSD: D1 is rising and testing the 200-day moving average MA(200). These are bullish developments.
The Donchian channel indicates uptrend: it is widening up.
The MACD indicator is above the signal line with the gap widening. This is a bullish signal.
The RSI oscillator is rising but has not reached the overbought zone.
We believe the bullish momentum will continue after the price breaches above the upper Donchian boundary at 0.6561. This level can be used as an entry point for placing a pending order to buy. The stop loss can be placed below the fractal low at 0.6402. After placing the pending order the stop loss is to be moved every day to the next fractal low, following Parabolic signals. Thus, we are changing the expected profit/loss ratio to the breakeven point. If the price meets the stop-loss level (0.6402) without reaching the order (0.6561) we recommend cancelling the order: the market sustains internal changes which were not taken into account.
The EUR/USD currency pair is still sideways. Weak economic data from the US was published yesterday. The number of employees in the non-agricultural sector from ADP grew in November by only 67K, while experts expected an increase to 140K. The ISM Purchasing Managers Index for ISM in November was 53.9 instead of 54.5. Meanwhile, the Markit composite business activity index (PMI) in the EU in November was 50.6 and turned out to be better than the predicted value of 50.3. Currently, the key support and resistance levels are 1.10650 and 1.10900, respectively. Open positions from these marks. We recommend you to keep track of up-to-date information regarding US-China trade relations.
The Economic News Feed for 05.12.2019:
– GDP Report (EU) – 12:00 (GMT+2:00);
– Initial Jobless Claims (US) – 15:30 (GMT+2:00);
Indicators do not give accurate signals: the price has crossed 50 MA.
The MACD histogram is near the 0 mark, which also indicates the absence of signals.
The Stochastic Oscillator is in the neutral zone, the %K line has crossed the %D line. There are no signals.
Trading recommendations
Support levels: 1.10650, 1.10300, 1.10000
Resistance levels: 1.10900, 1.11200
If the price consolidates above the resistance level of 1.10900, expect the quotes to rise toward 1.11200-1.11350.
Alternatively, the quotes could reduce toward 1.10300-1.10150.
The GBP/USD currency pair
Technical indicators of the currency pair:
Prev Open: 1.29925
Open: 1.31032
% chg. over the last day: +0.89
Day’s range: 1.31338 – 1.31474
52 wk range: 1.1959 – 1.3385
The GBP/USD currency pair is showing aggressive purchases. Amid the weakness of the US dollar, the British pound moved up. During yesterday’s trading, GBP/USD quotes rose by more than 50 points. Investors are awaiting additional information regarding the Brexit process. The British pound was also supported by positive economic data from the UK. At the moment, the key support level is 1.31000. The key resistance level is 1.30600. We recommend opening positions from these marks.
Today, the publication of important news from the UK is not expected.
Indicators point to a bullish sentiment: the price is being traded above 50 MA and 100 MA.
The MACD histogram is in the positive zone, but below the signal line, which gives a weak signal to buy GBP/USD.
The Stochastic Oscillator is in the neutral zone, the %K line crossed the %D line. There are no signals.
Trading recommendations
Support levels: 1.31000, 1.30500, 1.30000
Resistance levels: 1.31600, 1.31800
If the price consolidates above 1.31600, expect further growth toward 1.32000.
Alternatively, the quotes could fix below 1.31000 and descend toward 1.30500-1.30300.
The USD/CAD currency pair
Technical indicators of the currency pair:
Prev Open: 1.32941
Open: 1.32003
% chg. over the last day: -0.77
Day’s range: 1.31771 – 1.31889
52 wk range: 1.2727 – 1.3664
During yesterday’s trading, the USD/CAD currency pair significantly decreased. Quotes fell by almost 100 points. The US dollar is under pressure from weak economic data and an unclear situation around US-China trade relations. Yesterday, the Bank of Canada left the interest rate unchanged at 1.75%. Currently, the local support and resistance levels are 1.31750 and 1.32000, respectively. We recommend paying attention to the dynamics of oil prices. Open positions from key levels.
Today at 17:00 (GMT+2:00) Ivey PMI Index for Canada will be published.
Indicators point to a bearish sentiment: the price is being traded below 50 MA and 100 MA.
The MACD histogram is in the negative zone, but above the signal line, which gives a weak signal to sell USD/CAD.
The Stochastic Oscillator is in the neutral zone, the% K line crosses the% D line. There are no signals.
Trading recommendations
Support levels: 1.31750, 1.31500
Resistance levels: 1.32000, 1.32350, 1.32700
If the price consolidates below 1.31750, expect a further decline toward 1.31500-1.31400.
Alternatively, the quotes could grow toward 1.32350-1.32500.
The USD/JPY currency pair
Technical indicators of the currency pair:
Prev Open: 108.629
Open: 108.859
% chg. over the last day: +0.18
Day’s range: 108.915 – 108.951
52 wk range: 104.97 – 114.56
During yesterday’s trading, the USD/JPY currency pair rose slightly. Currently, the key support and resistance levels are 108.700 and 109.000, respectively. Investors expect additional drivers. We also recommend you to pay attention to the dynamics of yield on US government bonds. Open positions from key levels.
The Economic News Feed for 05.12.2019 is calm.
Indicators do not give accurate signals: the price is being traded between 50 MA and 100 MA.
The MACD histogram is in the positive zone, above the signal line, which gives a signal to buy USD/JPY.
The Stochastic Oscillator is in the neutral zone, the %K line is above the %D line, which indicates a bullish sentiment.
Trading recommendations
Support levels: 108.700, 108.450
Resistance levels: 109.000, 109.300, 109.600
If the price consolidates above the round level of 109,000, expect the quotes to grow toward 109.300-109.450.
Alternatively, the quotes could descend toward 108.450-108.300.
On Wednesday the 4th of December, the euro was down by four points at the end of trading. In the American session, bulls pushed the price to a new high of 1.1116. This was made possible due to three main factors: the Bloomberg report, weak ADP and ISM indices.
Bloomberg reported that the United States and China are close to an agreement on the amount of tariffs that will be cancelled as part of the first phase of the trade deal. Investors inferred from this report that there is still a real chance for the trade agreement to be signed before December 15.
In November, the private sector added only 67 thousand new jobs (the forecast was 110,000 (the previous figure was 121,000)). The ISM service index in November fell to 53.9 from 54.7.
As the price rose above 1.11, bulls began to turn a profit, which eventually led to the fall to 1.1067.
18:00 Canada: Ivey Purchasing Managers Index (Nov).
18:00 USA: Factory Orders (MoM) (Oct).
Current situation:
The target forecast for December 3 was never realised. The unexpected release of Bloomberg’s report and the publishing of weak statistics out of the US supported the “eurobulls”. The balance point shifted from 1.1050 to 1.1080.
US President Donald Trump said that the signing of a trade agreement with China may be delayed until after the US presidential election, which will be held in November next year. Yet after the Bloomberg report, there was talk that the deal would be concluded before December 15, 2019. Today, the market is optimistic about the UK general election in the UK and Brexit. In Europe, the pound hit a new high.
A candlestick with a long vertical shadow formed on the daily TF. A reversal pattern on the bell, but the background news was more significant. Following the pound, bulls can easily block an evening fall of the pair. The key support area is now located between 1.1070-1.1080. We can probably expect a flat formation according to the template laid out by the events of December 3-4. If the support of 1.1065 is maintained up to the release of the payroll report, and the results disappoint market players, then the euro is nailed on to soar to 1.1135. There is no correlation between ADP and NFP, but nevertheless, market players consider them and if there are technical factors, they will use the moment to exit the market and take up positions in preparation of the release of further important news.
By Hussein Sayed, Chief Market Strategist (Gulf & MENA), ForexTime
Equity markets recover on hopes of US-China trade deal
Weak US economic data drive the dollar lower
Sterling breaks above 1.28-1.30 range on expectations of Conservative majority
After a steep fall in global equity markets over the first two trading days of December, sentiment turned around once more and risk-on trade returned with the latest trade headlines indicating signs of progress on the ‘phase one’ deal.
A day after President Trump declared he was prepared to wait until after the US election to reach a trade deal with China, a Bloomberg report released yesterday said Washington and Beijing are moving closer to agreeing the amount of tariffs that would be removed in the deal.
Looking at how the world’s two largest economies are performing, it seems logical to believe that a deal needs to be struck. However, given recent history, nothing is guaranteed. Policy uncertainty has become the new normal in the US administration, and with that uncertainty expect to see increased volatility in financial markets.
Of course, December 15 is when the US is supposed to impose further tariffs on another $160 billion worth of Chinese goods. If President Trump lets these tariffs take effect, expect to see trillions of Dollars wiped off the value of stock markets. A decision to delay or cancel these tariffs will be the first real sign of progress in trade talks. Until we have a decision on that, expect investors to remain nervous.
In currency markets, the Dollar came under increased pressure due to a handful of poor economic data releases. The US manufacturing sector continued to contract further in November with the latest ISM monthly survey indicating that domestic factory activity fell to 48.1 from 48.3 in the previous month. Yesterday, the services sector slowed more than anticipated in November with the ISM non-manufacturing index falling to 53.9 from a previous reading of 54.7. ADP also revealed that private-sector job growth fell sharply in November, with only 67,000 jobs added last month versus expectations of 156,000. If tomorrow’s non-farm payrolls report confirms further slowing in employment growth, expect to see rising calls for more interest rate cuts from the Federal Reserve.
Sterling was an outlier in yesterday’s trading session as GBPUSD finally broke above the recent 1.28 – 1.30 trading range. The currency pair climbed above 1.31 for the first time in seven months as traders began to bet that the Conservative Party will win a solid majority in the upcoming election. Technical factors also contributed to Sterling’s rally as stops above 1.30 were triggered, leading to a squeeze in short positions.
Trading the Pound is likely to be very tricky in the days ahead. Traders are obviously pricing in an orderly Brexit from the EU by January 31 based on the assumption of a Conservative majority. However, if polls prove to be misleading and we end up with a hung parliament, expect to see a steep correction in the Pound.
Disclaimer: The content in this article comprises personal opinions and should not be construed as containing personal and/or other investment advice and/or an offer of and/or solicitation for any transactions in financial instruments and/or a guarantee and/or prediction of future performance. ForexTime (FXTM), its affiliates, agents, directors, officers or employees do not guarantee the accuracy, validity, timeliness or completeness, of any information or data made available and assume no liability as to any loss arising from any investment based on the same.
By CentralBankNews.info Chile’s central bank left its monetary policy rate steady, a surprise to most economists who had expected another rate cut in response to continuing social unrest, and said it expects to keep its rate at the current level for the next few months following the government’s plan to boost spending and the central bank’s intervention to curb volatility in the peso. The Central Bank of Chile’s board unanimously left its rate steady at 1.75 percent after cutting it three times this year by a total of 125 basis points following cuts in June, September and October. “In accordance to achieving the inflation target, and in the context of increased fiscal impulse and forex intervention, the Board foresees that the monetary policy rate will be kept at its current level over the coming months,” the central bank said. Chile’s peso and Chilean assets have tumbled since mid-October following the outbreak of massive protests over inequality. The peso jumped 2 percent in response to the central bank’s decision to maintain rates to 787.8 per U.S. dollar. But compared to the start of this year it is still down 12 percent. Prior to the start of protests, which have included the death of more than 20 people and the injury of more than 13,000, the peso was trading around 716 to the dollar and it then fell 16 percent by late November but has begun rising again in recent days. Starting on Monday the central bank began selling $200 million each day, and placing another $200 million in the forwards market, in an intervention that is scheduled to run through May 29, 2020 to curb volatility in the exchange rate, which the central bank today deemed as “excessive.” The central bank was frank in its assessment of the damages from the protests, saying economic activity and demand has been affected negatively and growth expectations for this year and next year have worsened, with growth now significantly worse than expected until mid-October. Chile’s inflation rate rose to 2.5 percent in October from 2.1 percent in September and the central bank said the markets are now expected inflation will rise to over 3.0 percent by the end of the year, reflecting the sharp appreciation of the peso. On the other hand, widening capacity gaps will hold back inflation and the central bank said it was still too early to determine which of these two factors would dominate. On Dec. 5 the central bank will release its latest forecast and analysis that supports today’s policy decision.
The Central Bank of Chile issued the following statement:
“At its Monetary Policy Meeting, the Board of the Central Bank of Chile decided to keep the monetary policy interest rate at 1.75%. The decision was adopted by the unanimous vote of all the Board members. In the external scenario, developments relating to the trade war between the United States and China continue to influence the behavior of global activity and financial markets, which adds to the impact of idiosyncratic factors on Latin America’s worsened performance. Activity and trade have been in line with expectations. In this context, monetary policy has remained expansionary around the world and stock market indices have risen in the main economies. Despite ups and downs, long-term interest rates and the multilateral dollar are virtually unchanged from the previous Meeting, as are the prices of copper and oil. Locally, the social outbreak has prompted significant changes in various economic sectors and the financial markets, giving way to increased uncertainty. This has resulted in a greater perception of country risk, a deterioration of stock market indicators and increases in fixed-income rates and corporate spreads. The Bank has taken various measures aimed at enhancing market liquidity and mitigating volatility in key financial prices. The peso posted a significant depreciation that, beyond the level reached by the exchange rate, occurred amid a rapid succession of movements in the same direction that resulted in volatility, which was deemed excessive. In this context, the Board announced an intervention program in the forex market that started on 2 December, which has succeeded in bringing said volatility down. Credit conditions have also been affected, as evidenced by a special poll under the Bank Credit Survey that reports lower demand for credit in some sectors and more stringent supply for persons and companies. Activity and demand have been affected negatively and growth expectations for this year and next have worsened, pointing at significantly lower rates than were foreseen up until mid-October. The labor market is already showing signs of deterioration, as reflected in various sources of information. Meanwhile, household and business confidence indicators has fallen sharply. In this context, the Government announced a package of reactivation measures that entails a major increase in fiscal spending in 2020. In October, annual inflation was 2.5% and market expectations are that it will close the year at or slightly above 3%, reflecting the sharp depreciation of the peso. Two years ahead, the various expectations measures place it at 3%. The path of inflation in the monetary policy horizon will be determined by two key factors. On one hand, lower inflationary pressures deriving from widened capacity gaps and, on the other, cost push pressures above those previously considered, in particular because of the idiosyncratic nature of the recent peso depreciation. The uncertainty that surrounds the future evolution of the macroeconomic scenario is higher than normal, so it is still premature to figure out which of these two factors will dominate. In accordance to achieving the inflation target, and in a context of increased fiscal impulse and forex intervention, the Board foresees that the monetary policy rate will be kept at its current level over the coming months. The Board reaffirms its commitment to conduct monetary policy with flexibility, so that projected inflation stands at 3% in the two-year horizon. The December Monetary Policy Report containing the forecasts and analyses that back the decision of the Board will be released tomorrow, Thursday 5 December at 8:30 hours. The minutes from this monetary policy meeting will be published at 8:30 hours of Thursday 19 December 2019. The next monetary policy meeting will be held on Tuesday 28 and Wednesday 29 January 2020, and the statement thereof will be published at 18:00 hours of this latter date.”
US stocks resumed advancing after three session decline on Wednesday buoyed by report US and China are making progress toward phase one deal. The S&P 500 rose 0.6% to 3112.76. The Dow Jones industrial average advanced 0.5% to 27649.78. Nasdaq gained 0.5% to 8566.67. The dollar weakening slowed as the Institute for Supply Management reported its nonmanufacturing index was at 53.9%, lower than in October, but new orders rose signaling stronger demand ahead. The live dollar index data show the ICE US Dollar index, a measure of the dollar’s strength against a basket of six rival currencies, slipped 0.1% to 97.61 and is lower currently. Futures on three main US stock indices indicate higher openings today.
European stocks snap two-session retreat
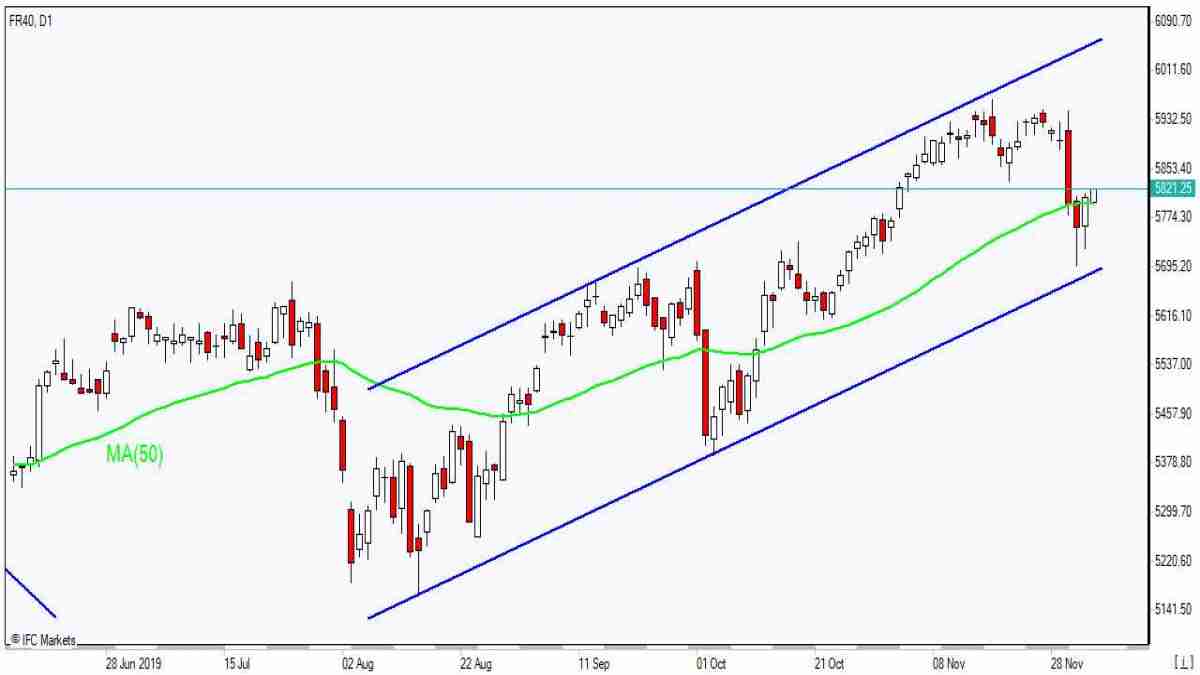
European stock indexes halted two day retreat on Wednesday. EUR/USD declined while GBP/USD accelerated its climb yesterday with both pairs higher currently. The Stoxx Europe 600 rebounded 1% led by basic resource shares as Markit reported euro-zone’s business activity held steady in November with final reading of composite Purchasing Managers’ Index (PMI) at 50.6. Germany’s DAX 30 advanced 1.2% to 13146.57. France’s CAC 40 rose 1.3% and UK’s FTSE 100 gained 0.4% to 7188.50.
Australia’s All Ordinaries Index leads Asian indexes gains
Asian stock indices are mostly rising today after reports Washington and Beijing were making a progress on trade deal. Nikkei gained 0.7% to 23300.09 with yen little changed against the dollar. Chinese stocks are rising: the Shanghai Composite Index is 0.7% higher while Hong Kong’s Hang Seng Index is up 0.5%. Australia’s All Ordinaries Index rallied 1.1% with Australian dollar slide against the greenback continuing.
Brent futures prices are marginally lower today. Prices rallied yesterday after Energy Information Administration report Wednesday that US crude supplies fell by higher than forecast 4.9 million barrels last week: February Brent crude rose 3.6% to $63 a barrel on Wednesday.
Note: This overview has an informative and tutorial character and is published for free. All the data, included in the overview, are received from public sources, recognized as more or less reliable. Moreover, there is no guarantee that the indicated information is full and precise. Overviews are not updated. The whole information in each overview, including opinion, indicators, charts and anything else, is provided only for familiarization purposes and is not financial advice or а recommendation. The whole text and its any part, as well as the charts cannot be considered as an offer to make a deal with any asset. IFC Markets and its employees under any circumstances are not liable for any action taken by someone else during or after reading the overview.
First Vanadium CEO Paul Cowley speaks with Peter Epstein of Epstein Research about the state of the vanadium market and his company’s plans to explore the newly found gold target on the Carlin Trend in Nevada.
First Vanadium Corp. (FVAN:TSX.V; FVANF:OTCQB) is one of the very few survivors of a brutal sell-off in Canadian and Australian-listed vanadium juniors. Nearly a dozen of the 100+ names I’m tracking are down more than 80% from their respective 52-week highs. Even industry-leading vanadium producer Largo Resources is not immune; it’s down 74%.
Since the Chinese vanadium pentoxide (V2O5) price hit an inflation-adjusted 13-year high of US$33.9/lb about 12 months ago, prices have plunged 82%. Few experts expected the price to remain above US$30/lb, or US$25 or US$20 for that matter. But, the current price of $6.2/lb is half or less of what most vanadium juniors were hoping to base their preliminary (PEA, PFS) economic studies off of.
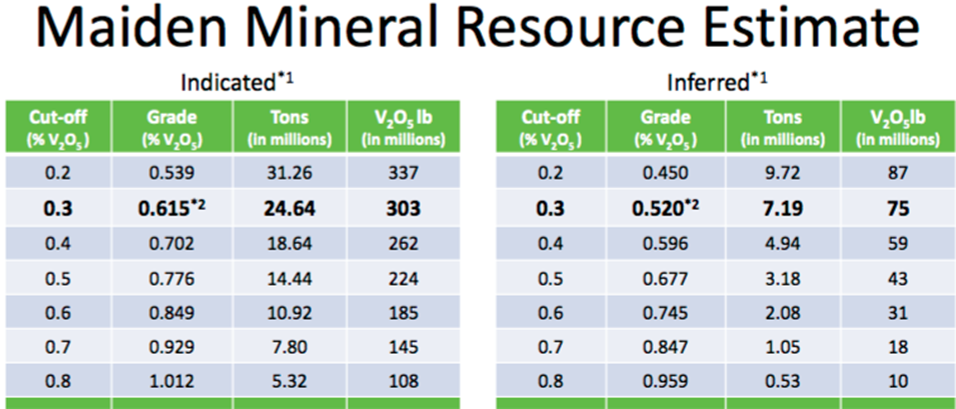
Most new projects on the drawing board simply don’t work at today’s prices. However, First Vanadium’s large, high-grade, near-surface, primary vanadium project in Nevada could potentially be viable at a price below US$10/lb. [NI 43-101 resource: 303 million pounds Indicated @ 0.615% V2O5] / [75 million pounds Inferred @ 0.52% V2O5] [Corporate Presentation]
Readers may recall that First Vanadium’s property is in the Carlin Gold Trend. CEO Paul Cowley knew he had one or more gold targets at depth, but two years ago, he had a straightforward, low-cost shot at delineating an attractive vanadium resource, so that’s the path the team took.
Paul tells me he underestimated the strength of the gold prospect, only coming to understand the bigger picture with a decisive stamp of approval from legendary geologist Dave Mathewson. Mathewson has joined First Vanadium’s stellar Technical Advisory Board.
With a fully funded PEA to be delivered in Q1 2020, management has more time to prudently pursue the gold opportunity. With that in mind, the team is looking for a strategic / financial partner to move the gold target forward.
Although the following interview of CEO Cowley is focused more on the newly announced gold prospect, he and his talented team remain excited by their vanadium resource and newly identified gold target, both on the same property. Please continue reading to learn more.
Peter Epstein: Please update readers on the status of First Vanadium’s flagship Carlin primary vanadium project in north-central Nevada (USA).
Paul Cowley: We have had a busy 2019 with the Carlin Vanadium resource since it was announced in February. It has been, and will continue to be, our primary focus. We added to our land position, extended mineralization and achieved crucial metallurgical advancements, enabling us to move forward to the next stage.
Our large, high-grade, primary vanadium resource is being advanced via a Preliminary Economic Assessment (PEA), conducted by Wood Canada Ltd., a highly reputable international engineering firm. Completion of the PEA is expected in the next three or four months.
Peter Epstein: Vanadium pentoxide prices have fallen further than most believed they would. The expectation heading into 2020 was around US$10-$12 per pound, but the price is now at US$6.2/lb. Any comments on the price?
Paul Cowley: The further leg down to this price happened only recently, I think we are at or near a bottom. The average Chinese price of V2O5 in 2019 is much higher, closer to US$11/lb. Over the past six months it has averaged about US$8/lb.
We anticipate prices will strengthen with stronger demand in rebar for construction and infrastructure in China and globally. Increased adoption of Vanadium Redox Flow Batteries in massive solar/wind projects, and in power grids will also be key drivers.
Near-term growth will be driven by steel production in developing countries, and especially developments in China with its higher strength standards in rebar for safer, stronger, longer-lasting structures.
Peter Epstein: First Vanadium recently announced a new gold target, on the company’s existing property, identified by rock star geologist and mine finder Dave Mathewson. Please tell us about this latest development.
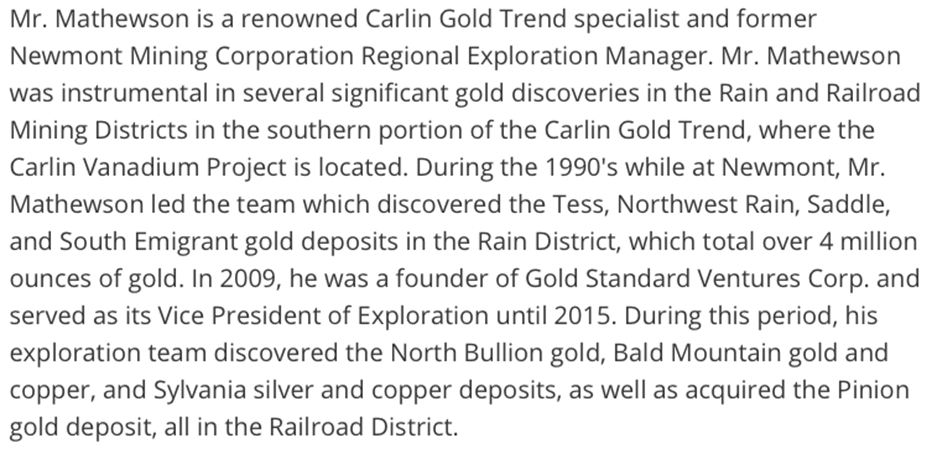
Paul Cowley: Yes, we are excited about how this is unfolding. We engaged Mr. Mathewson as a geological consultant because of his huge success in finding gold deposits in the Carlin Trend for Newmont Goldcorp (formerly a Newmont Mining regional exploration manager) and Gold Standard Ventures (co-founder and VP Exploration). We just recently appointed him to our Technical Advisory Board.
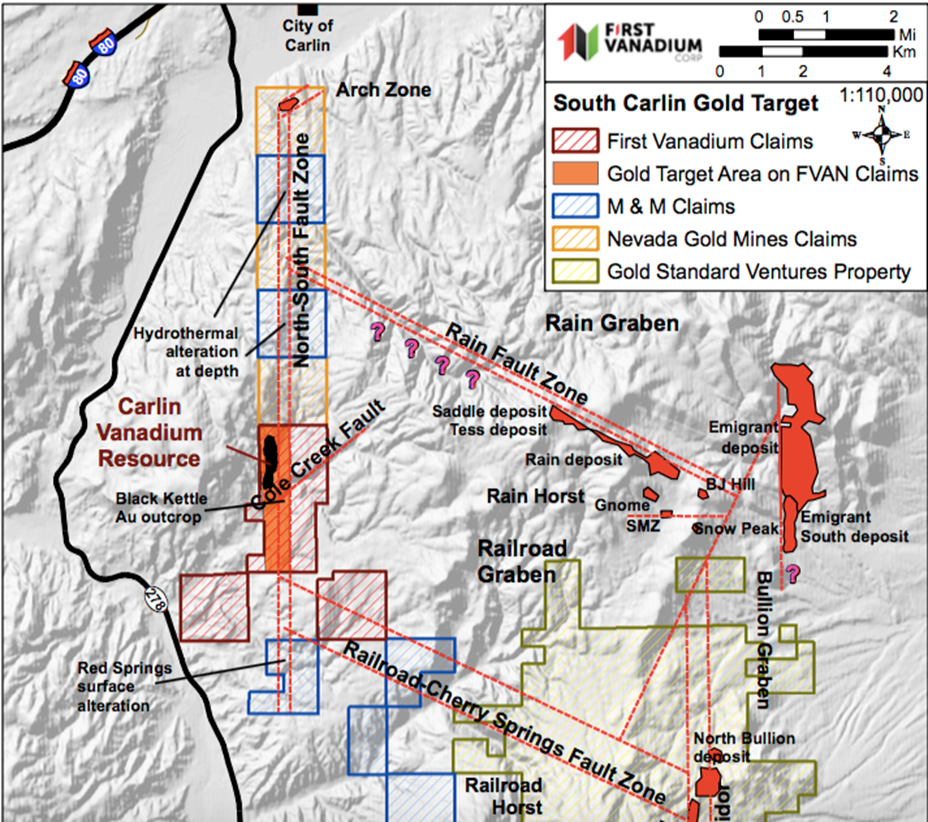
As a reminder to your readers, our vanadium property lies in the world famous and highly prolific Carlin Gold Trend, which has produced over 90 million ounces of gold. This trend is without question one of the best places on the planet to find gold. Dave has interpreted a Carlin-style, high-grade gold target at depth on our property.
Mathewson has tremendous local and Nevada statewide deposit knowledge and a big picture prospective in the Carlin Gold Trend. He’s a Nevada-based exploration geologist with 50 years’ experience, including 35 years conducting and managing gold exploration in Nevada. He and his exploration teams have discovered more than five million ounces of gold within eight miles of our property.
From our property data and Dave’s extensive knowledge of the deposits in the vicinity, he identified, in his words, “a very real and significant gold target” supported by all the things he looks for in discovering these types of deposits the right set of structures, geology, alteration, mineralization, host rocks and geophysical signature.
The target covers an area of ½ mile by 2 miles. Our news release of November 12th describes the target well and has a good link to a map to visualize the target relative to surrounding gold deposits. As mentioned earlier, Dave was so intrigued with this target’s potential, he joined our Technical Advisory Board.
Peter Epstein: Nevada is world famous for its gold endowment. However, it typically requires a lot of time, money and drilling to delineate a meaningful resource. As a junior, how might First Vanadium move both its vanadium and gold projects forward?
Paul Cowley: Our focus remains on the vanadium resource, but we think this gold target is very compelling. Make no mistake, we need to be smart in how to advance it. With that in mind, we’re looking for a strong strategic partner.
An obvious strategy would be to approach the Barrick Newmont JV (Nevada Gold Mines) whose claims border ours and are on trend, or a junior explorer, with a good balance sheet, who might appreciate an opportunity to gain exposure in the Carlin Gold Trend
Peter Epstein: Do you or your team have much experience in gold exploration?
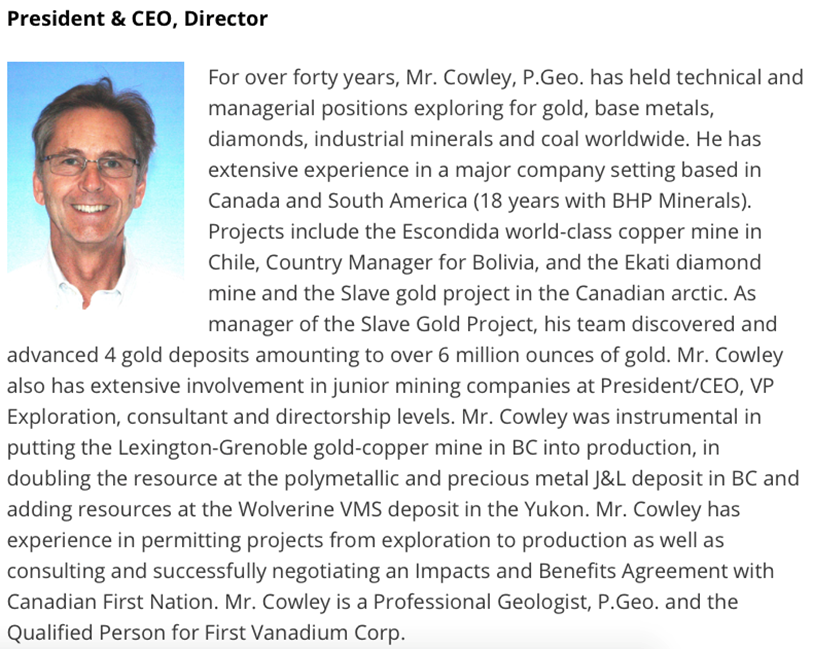
Paul Cowley: In addition to Dave Mathewson, I have 40 years’ experience as an exploration geologist, principally in gold. As project manager on the Slave Gold Project for BHP, I led the team that discovered and advanced four gold deposits that amounted to over 6 million ounces of gold.
Peter Epstein: Since your gold and vanadium prospects are on the same property, could you potentially explore/develop BOTH concurrently?
Paul Cowley: There could be some synergies in both the exploration and development stages, such as in infrastructure. The two projects need not conflict with each other. The vanadium resource is envisioned to be open pit, while the gold target being at depth would be an underground scenario.
Peter Epstein: If the gold target is so exciting, why are you only now getting around to talking about it?
Paul Cowley: Good question. Look, one must be smart with your money, set priorities and decide where the money might have the biggest impact. The vanadium deposit was fairly advanced when we started. So, very inexpensively and quickly, we delivered a resource with an in-situ (in the ground) value in the billions of dollars.
Now that the vanadium resource is on a track for a PEA early next year, we have time to ponder the significance of the gold-bearing outcrops on our property as clues to something bigger. At the same time, we fortuitously connected with Mr. Mathewson, who was able to take the gold target a big step further. Now we’re looking for a partner to share the exploration risk.
Peter Epstein: Thank you, Paul, for this timely update and a more detailed look at your gold target, conveniently situated at depth on your existing property. I look forward to First Vanadium’s PEA on the Carlin vanadium project in just a few months.
Peter Epstein is the founder of Epstein Research. His background is in company and financial analysis. He holds an MBA degree in financial analysis from New York University’s Stern School of Business.
Disclosures: The content of this interview is for information only. Readers fully understand and agree that nothing contained herein, written by Peter Epstein of Epstein Research [ER], (together, [ER]) about First Vanadium Corp., including but not limited to, commentary, opinions, views, assumptions, reported facts, calculations, etc. is not to be considered implicit or explicit investment advice. Nothing contained herein is a recommendation or solicitation to buy or sell any security. [ER] is not responsible under any circumstances for investment actions taken by the reader. [ER] has never been, and is not currently, a registered or licensed financial advisor or broker/dealer, investment advisor, stockbroker, trader, money manager, compliance or legal officer, and does not perform market making activities. [ER] is not directly employed by any company, group, organization, party or person. The shares of First Vanadium Corp. are highly speculative, not suitable for all investors. Readers understand and agree that investments in small cap stocks can result in a 100% loss of invested funds. It is assumed and agreed upon by readers that they will consult with their own licensed or registered financial advisors before making any investment decisions.
At the time this article was posted, Peter Epstein owned no shares of First Vanadium Corp. and the Company was an advertiser on [ER].
Readers understand and agree that they must conduct their own due diligence above and beyond reading this interview. While the author believes he’s diligent in screening out companies that, for any reasons whatsoever, are unattractive investment opportunities, he cannot guarantee that his efforts will (or have been) successful. [ER] is not responsible for any perceived, or actual, errors including, but not limited to, commentary, opinions, views, assumptions, reported facts & financial calculations, or for the completeness of this article or future content. [ER] is not expected or required to subsequently follow or cover events & news, or write about any particular company, sector or topic. [ER] is not an expert in any company, industry sector or investment topic.
Streetwise Reports Disclosure: 1) Peter Epstein’s disclosures are listed above. 2) The following companies mentioned in the article are billboard sponsors of Streetwise Reports: None. Click here for important disclosures about sponsor fees. The information provided above is for informational purposes only and is not a recommendation to buy or sell any security. 3) Statements and opinions expressed are the opinions of the author and not of Streetwise Reports or its officers. The author is wholly responsible for the validity of the statements. The author was not paid by Streetwise Reports for this article. Streetwise Reports was not paid by the author to publish or syndicate this article. Streetwise Reports requires contributing authors to disclose any shareholdings in, or economic relationships with, companies that they write about. Streetwise Reports relies upon the authors to accurately provide this information and Streetwise Reports has no means of verifying its accuracy.
4) The article does not constitute investment advice. Each reader is encouraged to consult with his or her individual financial professional and any action a reader takes as a result of information presented here is his or her own responsibility. By opening this page, each reader accepts and agrees to Streetwise Reports’ terms of use and full legal disclaimer. This article is not a solicitation for investment. Streetwise Reports does not render general or specific investment advice and the information on Streetwise Reports should not be considered a recommendation to buy or sell any security. Streetwise Reports does not endorse or recommend the business, products, services or securities of any company mentioned on Streetwise Reports. 5) From time to time, Streetwise Reports LLC and its directors, officers, employees or members of their families, as well as persons interviewed for articles and interviews on the site, may have a long or short position in securities mentioned. Directors, officers, employees or members of their immediate families are prohibited from making purchases and/or sales of those securities in the open market or otherwise from the time of the interview or the decision to write an article until three business days after the publication of the interview or article. The foregoing prohibition does not apply to articles that in substance only restate previously published company releases.