Let’s put it this way: Trading with CFDs can be safe. However, for a lot of people, the appeal is precisely the risks associated with it. Maybe skiing would be a good analogy. Is skiing safe? Well, are you in a well-maintained easy route, or are you an adrenaline junky careening down the side of a hill? So it goes with CFDs.
There are a couple of aspects of safety that are important to keep in mind. In fact, keeping safety consideration as an important part of trading is often seen as the basis of success in trading CFDs like Forex. It has to do with some principles of basic investment strategy.
Risk and Reward
In general, there is a strong correlation between the level of risk and the return on investment. More profitable investments generally imply a higher level of risk (but, importantly, not necessarily vice versa). This is because, in order for someone to engage in a more risky investment, there has to be a higher return on the investment to make the risk worthwhile.
If you have a CFD account and never trade, well, that’s very safe. But not profitable. Each time you trade, you are taking a risk, but you could make a profit. If you trade a lot, you will be taking on more risk, but, presumably with the objective of making more profit.
This applies to asset classes. Buying gold is relatively safe. Buying stocks is significantly riskier. But stocks pay dividends, which means you could make more money. Leverage, where you borrow money to make larger investments, increases how much money you can make, but also increases how much you can lose.
Risk Management
The appeal of CFDs is that you don’t trade the underlying asset, but a contract for the difference between the price when you buy and the price when you sell. They allow for significantly more leverage, so you have the chance of making more money, while accepting an increased risk than if you just bought the asset outright.
Because of this, risk management is a fundamental (if often less appealing and therefore more forgotten) aspect of CFD trading. Because a lot of people can be seduced by the idea of making a lot of money with CFDs, many take too many risks when trading – sort of like people who buy a sports car and drive too aggressively. It isn’t that the sports car is inherently less safe, but that the people who are motivated to buy one are more interested in risky driving. Because of this, some places like the US simply ban CFDs.
Risk is Relative
Understanding that risk is intimately related to profitability, you can manage your risk levels to suit your personal preferences and abilities. You can adjust how often you trade, how much money you put in, how much leverage you have, how much thought you put into a trade. You can study up on how to manage risk, and administer your money. All of these are important elements of CFD trading that make it safer.
Many traders have argued that CFD trading is actually more about risk management than looking to make the most profitable trades. Trading for them is a numbers game, where you use probability and statistics to offset your exposure and reduce your risk without compromising your profitability. The argument is that CFD trading is all about safety, and finding the safest way to make a profit.
The Right Attitude
How safe CFD trading is depends often on what you are trying to get out from it: The more profitability, generally, the more risk. The more risk, the more you have to pay attention to safety. Once you’ve selected a reliable, reputable broker, how safe your CFD trading will be depends primarily on how you trade, how much attention you pay to your risks, and how well you are at managing your money.
There are many resources online and on this site that can help you stay profitable while reducing your risk. The more you know about trading safety and risk management, the more you can control your exposure and decide how safe you want to be when trading.
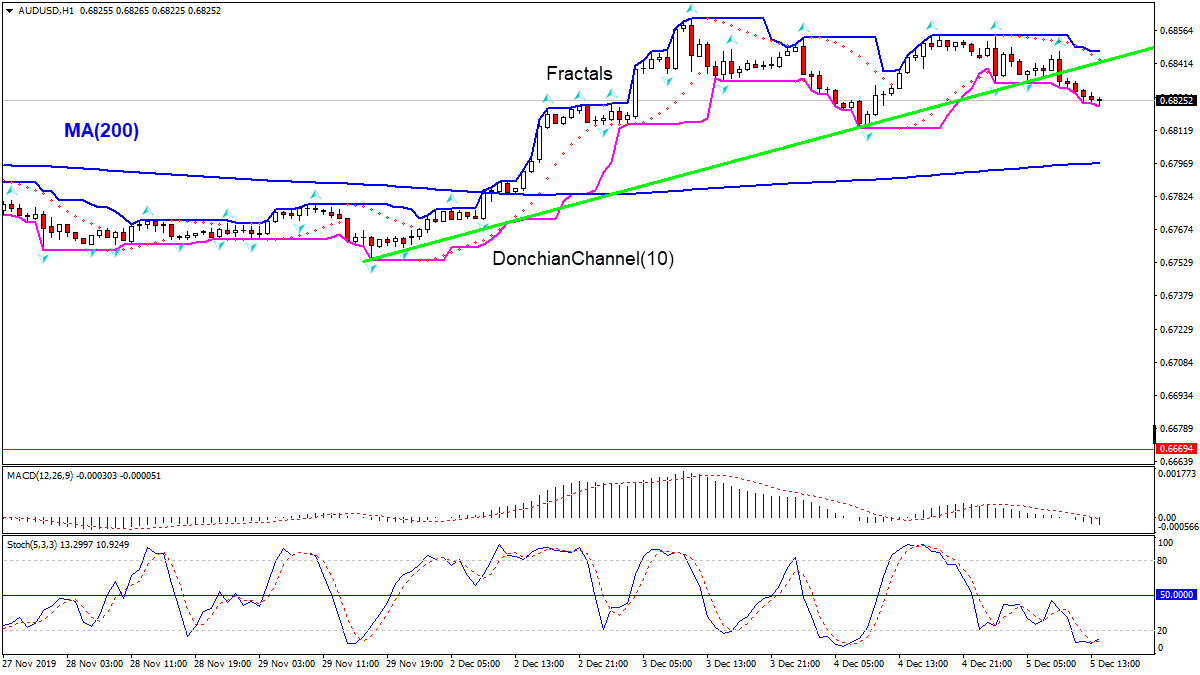
Australia’s retail sales and trade surplus both missed the October forecast. Will the AUDUSD decline?
The price chart on 1-hour timeframe shows AUDUSD: H1 is trading sideways. The price is falling above the 200-period moving average MA(200) which is rising. And the Stochastic oscillator is in the oversold zone. There is no trend yet formed, traders have to decide when it would be a best time to enter the market.
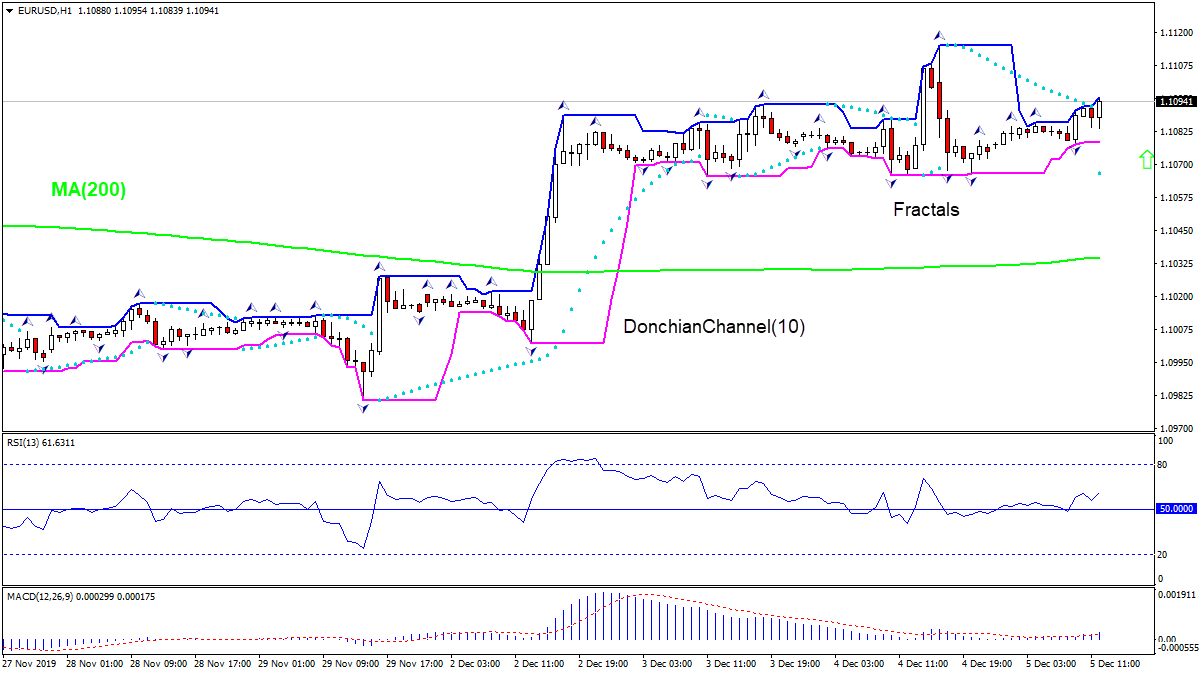
Bigger than forecast retail trade decline bearish for EURUSD
Retail sales in the euro-zone declined in October over month more than forecast. Will the EURUSD decline?
The price chart on 1-hour timeframe shows EURUSD: H1 is in uptrend. The price is rising above the 200-period moving average MA(200) which is rising. The RSI oscillator is above 50 level.
Our research and predictive modeling systems have nailed Gold over the past 15+ months. We expected Gold to rally above $1750 before the end of this year, but the global trade wars and news cycles stalled the rally in Gold over the past 2 months. Now, it appears Gold is poised for another rally pushing much higher.
But wait, if you’re thinking I’m just another one of those traders who is always bullish on gold, just know I have been telling the truth about where gold was headed (lower) for years, but finally, the tide has changed!
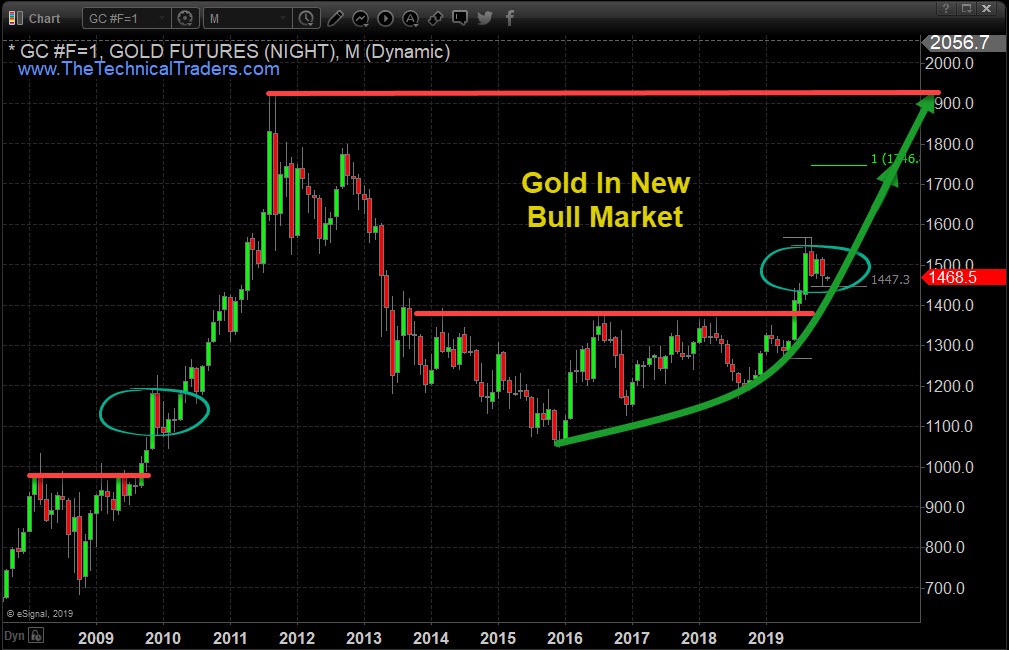
Gold broke down from a bull market in 2012/2013 – nearly 7 years ago. Now, Gold has broken resistance near $1375 and is technically in a full-fledged Bull Market. The importance of this is the 7-year cycle and how the rotation in Gold, between the high near $1923 and the low near $1045 represent an $878 price range. The upside (expansion) rally in Gold may very well move in expanding Fibonacci price structures – just like it did in 2005 through 2012. If this is the case, then we may expect to see an ultimate peak price in Gold well above $3500.
The rally that started in the last 2015 and ended in July 2016 totaled +$331.1 (+31.67%). The next price rally that started in August 2018 and ended in September 2019 totaled +$399.4 (+34.22%). If we take the current rally range (399.4) and divide it by the previous rally range (331.1), we end up with an expansion range of 121%. The two unique rallies that happened just before the 2009 parabolic rally in Gold represented (+315.8: 2006) and (394.8: 2008). The ratio of these two rallies is 125%. Could Gold have already set up for another parabolic rally well beyond the $1923 target level?
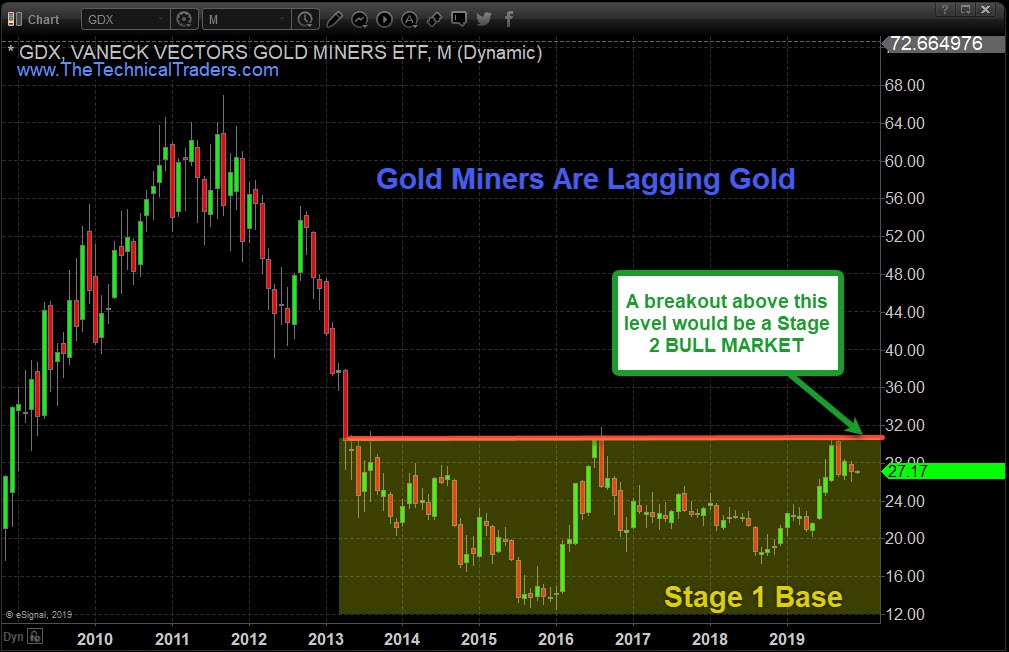
Monthly Price Of Gold Chart – Bull and Bear Market Trends
Our research team believes Gold has already entered a technically valid Bullish Market trend. We believe Gold miners will follow higher as Gold begins this next move higher. The reason we have not engaged in Miners, yet, is because we have not received any technically valid signals related to the Gold miners indicating they have also entered a new Bullish Market trend.
Gold is the safe-haven for the global market. It is a store of value and offers price appreciation when the global market risks are excessive. Because of this, the sentiment across the global markets appears to be weakening in regards to forward expectations and valuation appreciation within the investment/asset classes. If Gold continues to rally higher, consider it a strong indicator that the foundation of the global market valuation levels is weakening considerably.
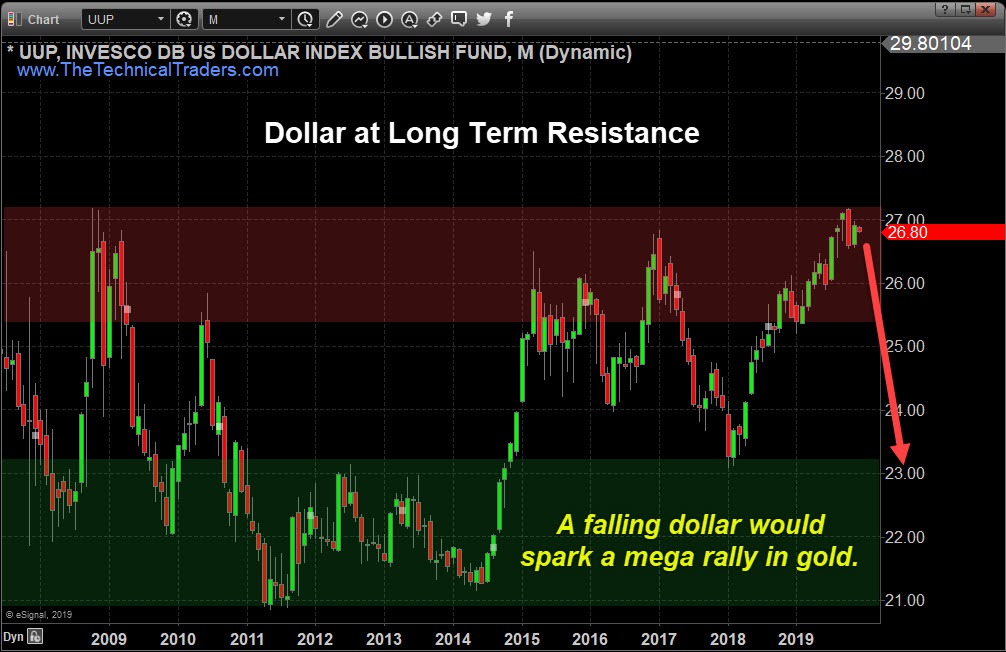
US Dollar Will Start To Support Higher Gold Prices
Should the US Dollar retrace lower, Gold will see a price increase based on the renewed weakness of the US Dollar. This would also assist in re-balancing global trade and economic issues with the US Dollar moving moderately lower as weakening global markets contract.
Gold Mining Stocks – Monthly Chart
Miners are set up much like Gold was in early 2018. Resistance has been set up with multiple price tops and any momentum rally above this level would technically qualify as a new Bullish Market trend for miners.
At this point, we believe the bottom in miners has already formed and we are simply waiting for the qualifying technical confirmation of the bullish trend to begin. Jumping into this trade too early could result in unwanted risks as the price could still waffle around within the Stage 1 Base range.
If you want to learn more about market stage analysis I will be covering it a new article shortly. Once you grasp the basic concept you will see these stages on every chart no matter the time frame and know when to focus on trading and when to ignore the charts.
If you like new fresh big trend trades then check out this real estate article I just posted and how the real estate ETF could allow your to profit from home prices but you don’t even need to own or buy a home!
Concluding Thoughts:
The recent weakness in the US and global markets has prompted a moderately solid upside move in Gold and Silver over the past few days. We still need to see a Gold move above recent resistance to qualify as a new upside rally though. Miners are set up for a breakout technical move which we must also wait for. We believe these two may move somewhat in unison if the global markets continue to contract throughout the end of 2019 and into 2020.
Stay tuned for more updates and alerts when all these key sectors and asset classes start new trends because that is when you want to get involved for immediate oversized gains. See my stock, index, and commodity trade alerts here.
Two of the most popular forms of technical trading are using indicators and price action trading. When using indicators, traders are generally looking to execute a trade based on an indicator signal. For example, if MACD turns bearish, traders will execute a sell trade. Or, if the RSI indicator is oversold, traders will execute a buy trade.
Similarly, when trading naked price action, traders are looking for certain signals to execute a trade. For example, if price forms a bullish engulfing candle, they will execute a buy trade. Similarly, if the trader identifies a bearish pin bar, they will execute a sell trade. While both these strategies are effective, combing the two approaches can lead to better opportunities and stronger.
When combing indicator readings with price action signals for trade entries traders can use whichever indicators and price action setups they like. Let’s take a look at a few examples and discuss why they are so powerful.
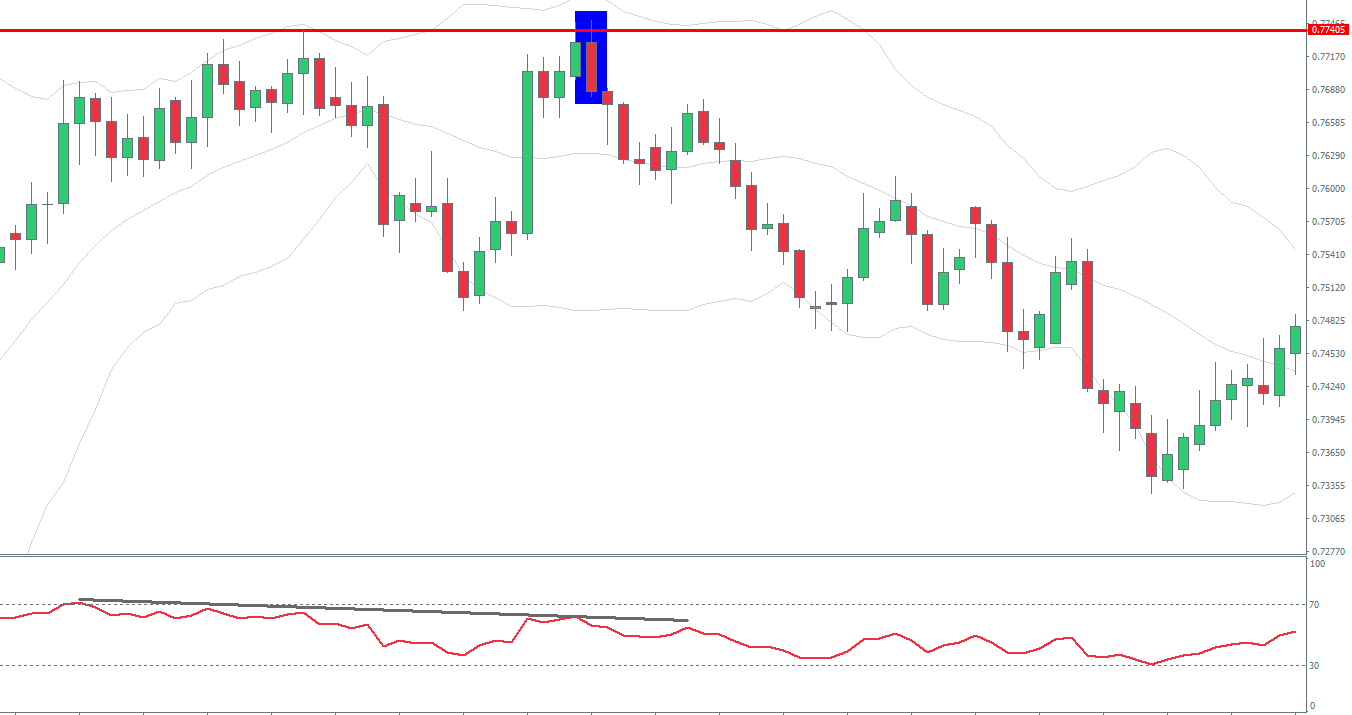
Engulfing Candles With RSI
In the chart above you can see an example of a bearish engulfing candle, combined with bearish RSI divergence at a double top. So, as price is testing the double top, the trader will note that the RSI indicator is showing clear bearish divergence (weaker indicator signal than the last time price was at the level). This suggests that the market is vulnerable to a reversal lower.
Price tests the level and then we see a strong reversal with price printing a bearish engulfing candle. This tells us that there has been an acute shift in supply and demand at the level. This alerts us to the potential for a deeper move lower. The presence of the bearish engulfing candle at the double top resistance level with bearish RSI divergence is a strong set of criteria for placing a short trade. This would have nicely captured the reversal lower.
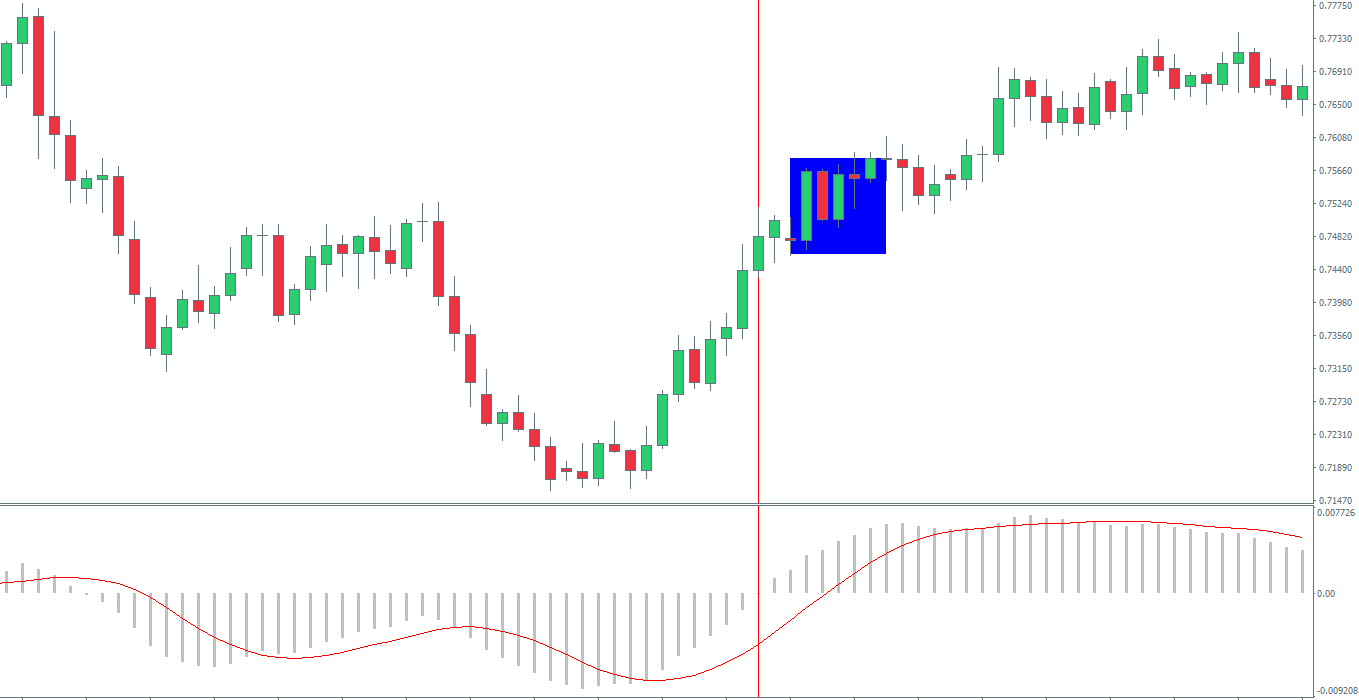
Inside Bar Breakouts With MACD
In the chart above you can see an example of an inside bar breakout with bullish MACD signal. The trader would have noted that the MACD indicator turned bullish at the site of the vertical red line. With a bullish signal in play, the trader would be looking for long opportunities. In the highlighted section you can see an inside bar breakout setup noted. So, at the point that the inside bars were forming, the trader would note the contraction in momentum and the likelihood that, in line with the bullish MACD signal, the market would eventually break higher, allowing the trader to enter a long trade as price moved above the mother candle. This is a great way to trade with the trend and allows the trader to quickly capture a fresh burst of momentum as the trend resumes.
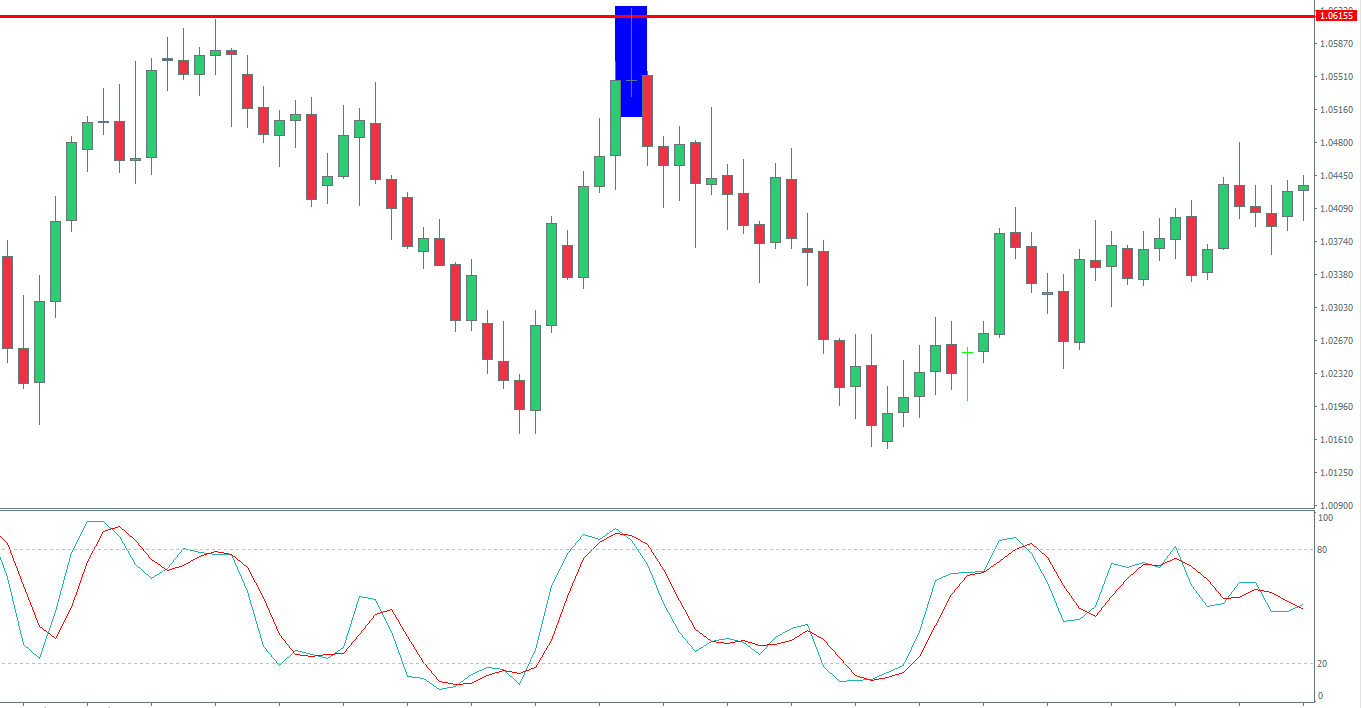
Pin Bars With Stochastics
In the chart above you can see an example of a bearish pin bar at a double top with overbought stochastics. The stochastics indicator measures momentum in the market and identifies when momentum is overstretched and likely to see a price reversal.
So, with price testing the double top level, the trader would have noted that the stochastics was in overbought territory. This means that price was vulnerable to a reversal lower. The formation of the bearish pin bar would then confirm the trade there and offer an entry point. Pin bars, similar to engulfing candles, represent a strong shift in the underlying supply-demand balance. These too can be a powerful trade signal.
Summary
Hopefully, now you have a better idea of how you can combine indicator readings with price action setups to identify powerful trade entries. Combing the two approaches means that you are looking for extra confirmation in the market before placing a trade. Using a method like this that requires more than one criterion for entry can be a great way to improve your trading and increase your chances of success.
The US dollar has come back under pressure over the last 24 hours as further data weakness has weighed on sentiment. The ISM Non-Manufacturing reading was weaker than expected over November at 53.9 vs 54.5 expected, though at least remained in expansionary territory. The ADP employment change reading was also weaker than expected. Data came in at 67k jobs vs 137k expected, raising the risk of a weak reading in Friday’s NFP release. USD index trades 97.47 last.
EURUSD Higher on USD Weakness
EURUSD has been higher over the European session so far on Thursday as weakness in the USD allows for recovery in the single currency. In light of recent data weakness and comments from ECB’s Lagarde (who said the ECB remains committed to achieving its 2% inflation target), the outlook remains bearish for EURUSD. Currently trading 1.1091 last, and approaching the bearish trend line from mid-2018 highs.
GBP Breaking Out
GBPUSD continues to forge higher ground today after breaking out above the 1.3033 resistance. The latest UK elections polls show that the Conservative party remains in the lead with around a 10% lead on Labour. For now, price action seems to reflect the view that elections outcome will either result in Brexit being delayed further or Johnson’s deal being pushed through, keeping GBP supported for now.
SPX500 Recovering Well
Risk assets have continued to recover into the back-end of the week following initial weakness in response to concerns over US/China trade talks. The SPX500 has traded back up to 3117.53 today, recovering firmly off the 3069.48 lows. The recovery has been helped by a Bloomberg report suggesting that a US/China trade deal is still close, despite recent tensions over Hong Kong. This report comes after Trump spooked markets by suggesting that a deal might not come until after the US elections next year.
JPY & Gold Lower
Safe havens have been weaker today, in light of the ongoing recovery in equities prices, seeing both JPY and gold lower against the US dollar. USDJPY trades 108.94 last, still above the 108.84 level for now. XAUUSD trades 1474.60 last, down firmly off the 1500 level.
Oil Rallies – OPEC In Focus
Oil prices have continued to push higher into the final days of the week with crude recovering strongly off the 55 level tested last week. The EIA report released yesterday showed US crude stores falling by nearly 5 million barrels last week. Focus now shifts to the OPEC meeting which begins today and is expected to see the group announcing fresh production cuts. Crude trades 58.36 last, testing the recent highs around 58.61, which are holding as resistance for now.
Crude Keeps CAD Supported
USDCAD has been lower across the European session so far on Thursday. Weakness in USD, on the back of further data misses yesterday, as well as strength in oil prices, is boosting CAD here. USDCAD trades 1.3184 last. Along with the OPEC meetings getting underway today, CAD traders also get domestic trade balance data which could offer some movement.
AUD Down on Data Dump
AUDUSD has been lower today despite the pick-up in risk appetite and recovering optimism over a US/China trade deal. Data overnight showed a weaker than expected retails sales print for the last month as well as a far smaller-than-expected trade surplus of just 4.5 billion AUD (vs 6.5 billion AUD forecast). AUDUSD trades .6833 last.
Crude prices rallied strongly this week. The latest report from the Energy Information Administration revealed a large drawdown in US crude stores. The EIA report showed that in the week ending November 29th, US crude stocks were lower by 4.9 million barrels. This drawdown was far greater than the 1.73 million barrel decline the market was looking for. This comes just a day after the API reported a similar drawdown level of 4.5 million barrels.
The report was not totally bullish, however, with gasoline inventories seen higher by 3.4 million barrels. This was higher than the 1.8 million barrel increase forecasted. Distillate stockpiles, which include diesel and heating oil, were also higher by 3.1 million barrels over the week. This was again higher than the 1.1 million barrel increase the market was looking for.
OPEC In Focus
While the data certainly helped lift oil prices further, crude prices were already firmly higher on the week as traders look to position ahead of the December 5th OPEC meeting. The meeting, taking place in Vienna, has drawn a lot of attention over recent weeks. This is due to the anticipation that OPEC will adjust its production cuts. The cuts, which were extended in June to run until the end of Q1 2020 are now expected to be extended further. However, the main focus of the meeting will be whether OPEC decides to increase the level of the cuts.
Saudi Arabia Pushing For Deeper Cuts
On Tuesday, OPEC member Iraq (the second-biggest producer in the cartel) said that Saudi Arabia (the group’s de-facto leader) was pushing to increase the level of supply cuts from 1.2 million barrels per day to 1.6 million barrels per day. However, while OPEC itself might agree to the deeper cuts, it is not yet clear whether the group of non-OPEC producers will be in favor of increasing the cuts. The allied nations, led by Russia, have been taking part in the production cuts so far this year. They have recently agreed to extend them. If the group now agrees to increase the level of cuts, along with the OPEC members, this could be strongly bullish for oil prices.
Trade Deal Fears Rising
With the US/China trade talks having stalled again, the need for OPEC to make a significant change is increasing. If a deal is not done in December and the US pushes ahead with fresh tariffs, the demand outlook for oil will worsen once again. With this in mind, the market is expecting OPEC to take strong action. If OPEC fails to agree to a deal to increase the level of cuts and merely extends them further, this is likely to be met with disappointment by oil bulls, sending oil prices crashing.
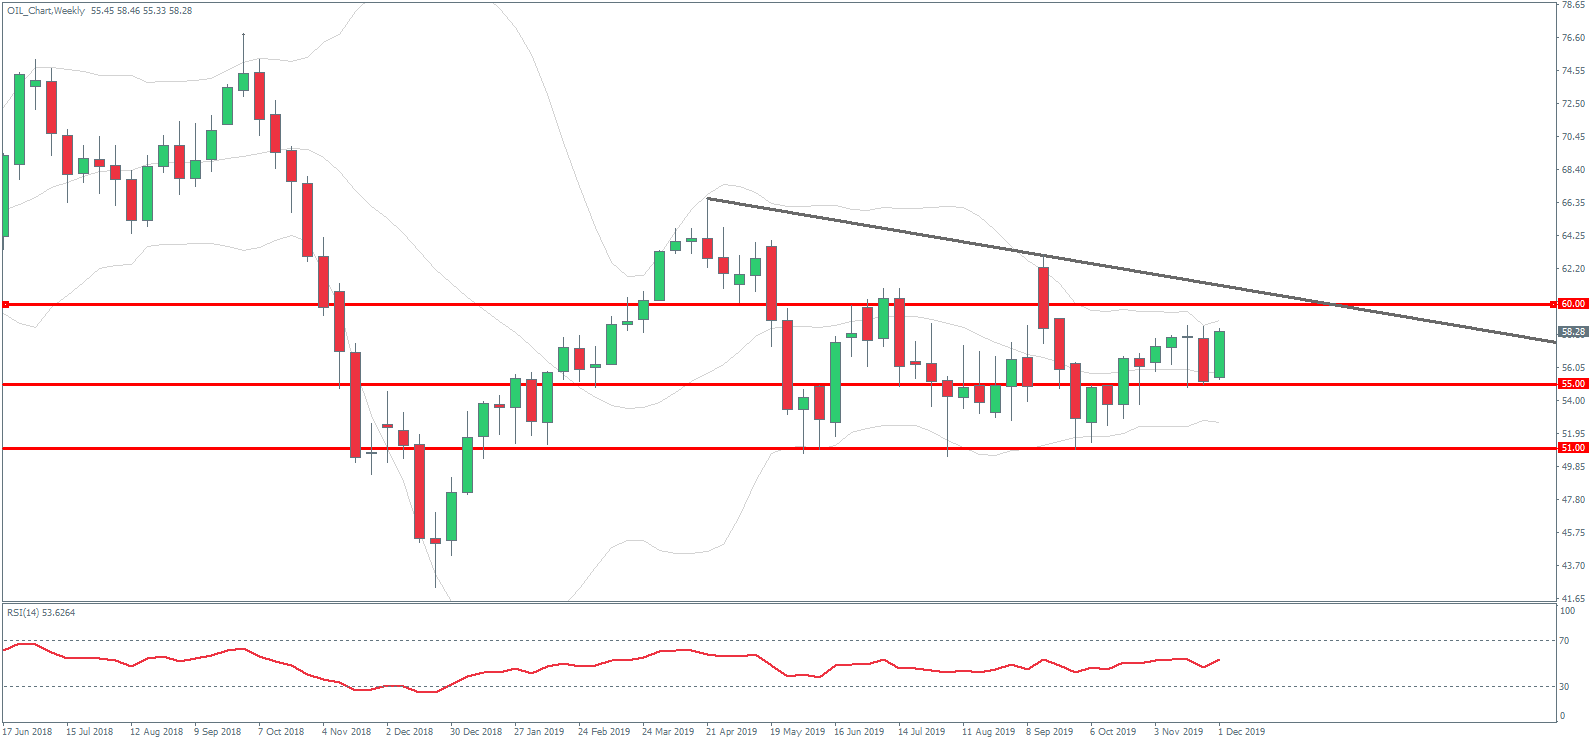
Technical Perspective
For now, crude continues to trade within the 51 – 60 range. This area has framed price action over much of the year. The sell-off last week found strong support into the 55 level, which has seen prices turning higher again. If OPEC does agree to increase the level of cuts, this could see price breaking above the 60 level. This would challenge the bearish trend line from year to date highs. If OPEC disappoints, however, we are likely to see price quickly challenging the 51 level support at the bottom of the range.
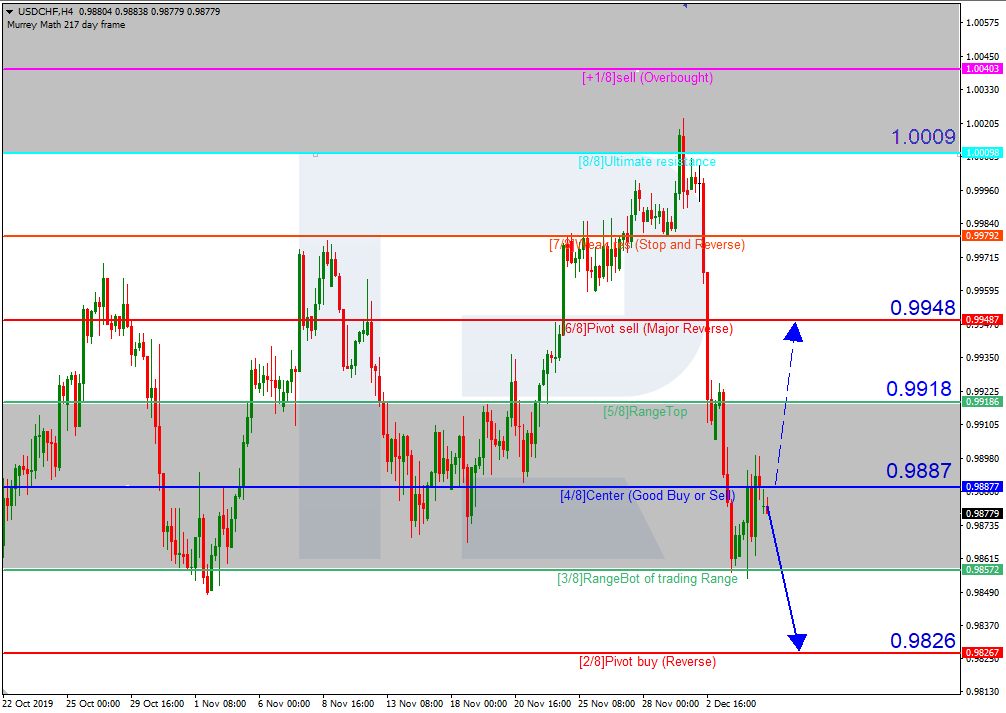
As we can see in the H4 chart, USDCHF is consolidating below 4/8. In this case, the price is expected to break 3/8 and then continue falling to reach the support at 2/8. However, this scenario may no longer be valid if the price breaks 4/8 to the upside. After that, the instrument may continue growing towards the resistance at 6/8.
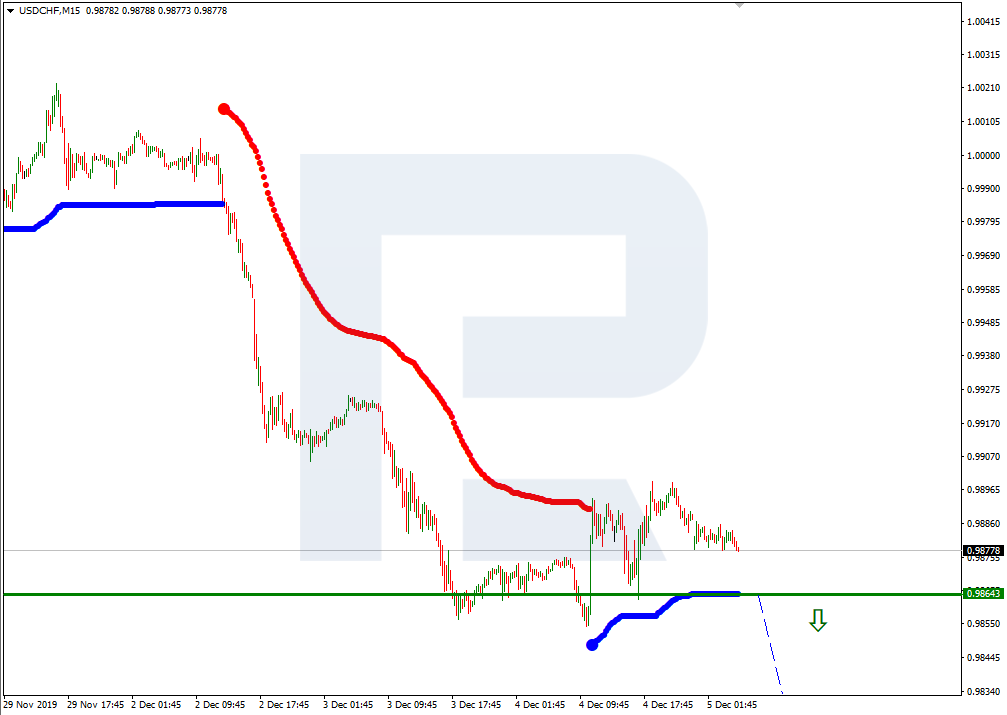
In the M15 chart, the pair may break the downside line of the VoltyChannel indicator and, as a result, continue trading downwards.
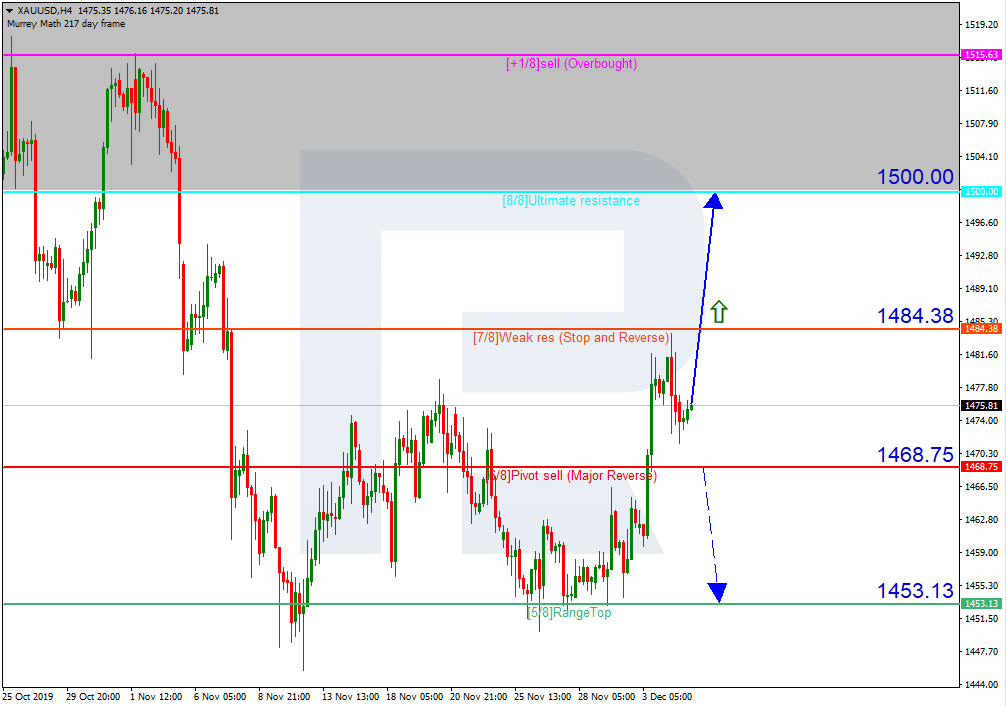
XAUUSD, “Gold vs US Dollar”
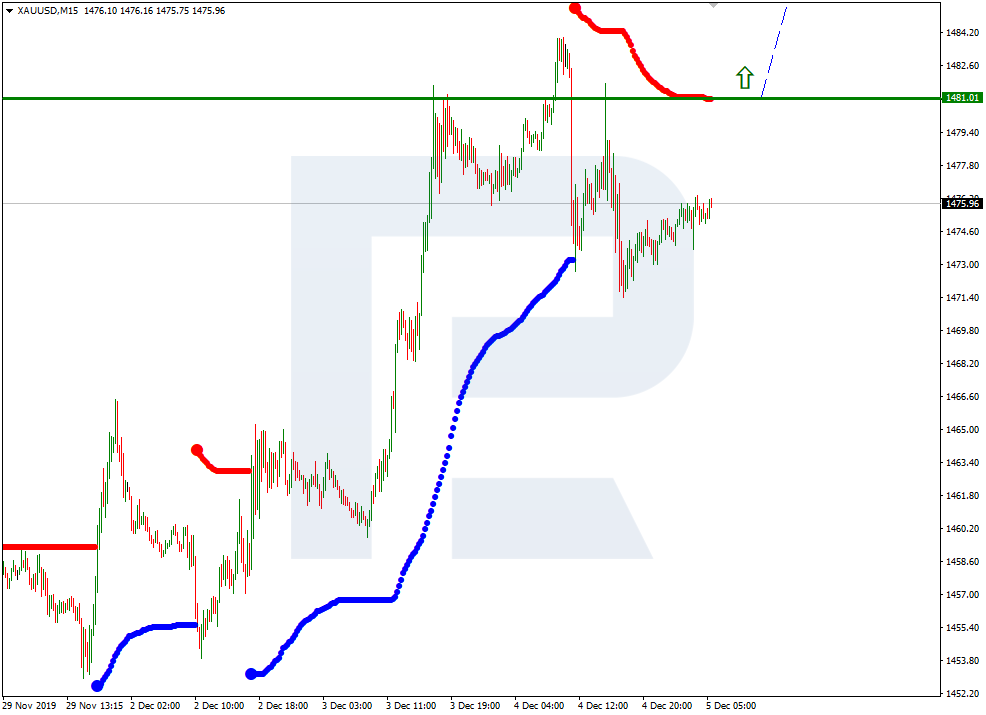
As we can see in the H4 chart, XAUUSD is moving above 5/8. In this case, the price may break 7/8 and continue trading upwards to reach the resistance at 8/8. However, this scenario may no longer be valid if the price breaks 6/8 to the downside. After that, the instrument may continue falling towards the support at 5/8.
In the M15 chart, the pair may break the upside line of the VoltyChannel indicator and, as a result, continue trading upwards.
Attention! Forecasts presented in this section only reflect the author’s private opinion and should not be considered as guidance for trading. RoboForex LP bears no responsibility for trading results based on trading recommendations described in these analytical reviews.
India’s central bank left its policy repo rate steady at 5.15 percent, surprising financial markets that had expected another rate cut to boost a slowing economy, but said it was still ready to cut if needed and would “continue with an accommodative monetary policy stance as long as it is necessary to revive growth, while ensuring that inflation remains within the target.”
The Reserve Bank of India (RBI), which has cut its key rate five times this year by a total of 135 basis points, said its monetary policy committee felt it was appropriate to pause at this point as past easing and government measures are expected to boost growth while inflation is expected to ease.
RBI’s decision underscores the pause many central banks are now taking following a flurry of rate cuts this year that is expected to revive global growth that has slowed due to a fall in global trade and investments from the uncertainty unleashed by the trade conflict between the U.S. and China.
RBI was one of the first major central banks to kick off this year’s global easing cycle when it cut its rate in February, a point made by RBI Governor Shaktikanta Das who said the central bank had been pre-emptive in easing and rate cuts followed in quick succession in every meeting on monetary policy since then, and it was still ready to cut further if needed.
“The forward guidance in itself indicates that there is space available for further monetary policy action,” Das said, adding there was a “need to optimize the impact of rate reductions” and the key consideration is the timing of further actions as the impact of past rate cuts is monitored.
“It is in this context that the MPC decided to pause for now and evaluate the developments with a readiness to act, if the unfolding situation so warrants,” Das said, adding government measures and past easing by RBI were “gradually expected to further feed into the real economy.”
The impact of RBI’s rate cuts to the economy has also been strengthened following a decision in September that makes it mandatory for banks to link certain loans to an external benchmark system with most banks now linking their lending rates to the central bank’s policy rate.
The transmission of the RBI’s cumulative 135 basis point reduction in the policy rate this year to various monetary and corporate debt market segments has ranged from 137 basis points in the overnight call money market to 218 points for 3-month commercial paper for non-banking finance firms, RBI said.
“Monetary transmission has been full and reasonably swift across various money market segments and the private corporate bond market,” Das said, adding this augurs well for the transmission to lending rates, going forward.
RBI’s most recent rate cut came in October when it also said it would continue with an accommodative monetary policy stance as long as necessary to revive growth.
Since then data showed India’s gross domestic product growth slowed to 4.5 percent in the third quarter from 5.0 percent in the second quarter, the fifth consecutive quarter of slowing growth and the first time since growth fell below 5 percent since 2013.
RBI once again lowered its growth forecast for the current financial year, which began on April 1, to 5.0 percent from October’s forecast of 6.1 percent. Growth in 2018-19 was 6.8 percent.
The slowdown has raised the pressure on India’s prime minister, Narendra Modi who was elected to a second term in May, to take further steps to boost growth.
The government has said it will unveil a series of infrastructure projects as part of a plan to invest 100 trillion rupees and has already cut corporate taxes and sped up privatization of state-run firms.
India’s inflation rate has been accelerating in the last two months – it rose to 4.62 percent in October from 3.99 percent in September – due to a surge in food prices. Food inflation spiked to 6.9 percent in October, a 39-month high, pushed up by a sharp rise in the cost of vegetables due to heavy unseasonal rains.
This has also pushed up inflation expectations, with the central bank’s November survey of households showing a rise of 120 basis points over a 3 month period and 180 points over a one-year horizon “as they adapted to the spike in food prices in recent months,” RBI said.
RBI’s forecast for inflation in the second half of 2019-20 was raised to 5.1-4.7 percent from October’s forecast of 3.5-3.7 percent, and to 4.0-3.8 percent for the first half of 2020-21, with risks broadly balanced.
Further ahead, RBI expects inflation to moderate below its midpoint target of 4.0 percent by the second quarter of 2020-21, with the forthcoming government budget also providing better insight into the impact of any measures on growth and inflation.
India’s rupee has been relatively stable this year after falling sharply in 2018 and rose 0.4 percent in response to RBI’s policy decision to trade at 71.2 to the U.S. dollar but is still down 1.8 percent since the start of this year.
The Reserve Bank of India released the fifth bi-monthly monetary policy statement followed by a statement Governor Shri Shaktikanta Das:
“On the basis of an assessment of the current and evolving macroeconomic situation, the Monetary Policy Committee (MPC) at its meeting today (December 5, 2019) decided to:
keep the policy repo rate under the liquidity adjustment facility (LAF) unchanged at 5.15 per cent.
Consequently, the reverse repo rate under the LAF remains unchanged at 4.90 per cent, and the marginal standing facility (MSF) rate and the Bank Rate at 5.40 per cent.
The MPC also decided to continue with the accommodative stance as long as it is necessary to revive growth, while ensuring that inflation remains within the target.
These decisions are in consonance with the objective of achieving the medium-term target for consumer price index (CPI) inflation of 4 per cent within a band of +/- 2 per cent, while supporting growth.
The main considerations underlying the decision are set out in the statement below.
Assessment
Global Economy
2. Since the MPC’s meeting in October 2019, global economic activity has remained subdued, though some signs of resilience are becoming visible. Among the advanced economies (AEs), GDP growth in the US picked up in Q3 on strong private investment and personal consumption expenditure. More recent data, however, indicate that factory activity contracted for the fourth consecutive month in November, while retail sales and industrial production declined in October. In the Euro area, GDP growth remained stable in Q3 relative to the previous quarter on improved household consumption and government spending, although manufacturing activity continued to struggle with lingering geo-political uncertainties. With weak global demand pulling down exports, the Japanese economy lost momentum in Q3. Economic activity in the UK accelerated in Q3, primarily driven by the services sector and construction activity.
3. Among emerging market economies (EMEs), GDP growth in China decelerated further in Q3, reflecting weak industrial production and declining exports amidst trade tensions with the US. While retail sales edged lower in October, fiscal and monetary stimuli are expected to temper the slowdown. In Russia, GDP growth accelerated in Q3 on the back of an upturn in agricultural output and industrial activity. In South Africa, economic activity contracted in Q3, pulled down by slowing mining and manufacturing activity. In Brazil, GDP growth accelerated further in Q3, driven by agriculture, industry and business investment activity.
4. Crude oil prices have moved in a narrow range in both directions since the last meeting of the MPC, reflecting changing sentiments relating to progress in US-China trade talks. Gold prices traded sideways before falling in early November as a revival of risk appetite eased safe haven demand. Inflation remained benign in major AEs and EMEs in Q3, except in China where it firmed up to its highest level in eight years.
5. Global financial markets were buoyed in October by risk-on sentiment stemming from renewed optimism on a trade truce between the US and China and possibility of a Brexit deal. In the US, equity markets rallied in this environment, also supported by better than expected corporate earnings and strong jobs data. Stock markets in EMEs too registered gains in October before some selling pressure took hold in the second half of November on renewed fears of US-China trade talks stalling on the Hong Kong stand-off. Bond yields in the US firmed up from early October on risk-on sell-offs; however, they softened from mid-November on waning hopes of a near-term resolution of trade disputes. Bond yields in the Euro area remained negative, but expectations that a no-deal Brexit is less likely improved sentiment. In EMEs, bond yields showed mixed movements, driven initially by optimism on US-China trade talks and country-specific factors. In currency markets, the US dollar weakened against other major currencies, while EME currencies have been trading with an appreciating bias.
Domestic Economy
6. On the domestic front, gross domestic product (GDP) growth moderated to 4.5 per cent year-on-year (y-o-y) in Q2:2019-20, extending a sequential deceleration to the sixth consecutive quarter. Real GDP growth was weighed down by a sharp slowdown in gross fixed capital formation (GFCF), cushioned by a jump in government final consumption expenditure (GFCE). Excluding GFCE, GDP growth would have been at 3.1 per cent. Growth in real private final consumption expenditure (PFCE) recovered from an 18-quarter trough. The drag from net exports eased on account of a sharper contraction in imports than in exports.
7. On the supply side, gross value added (GVA) growth decelerated to 4.3 per cent in Q2:2019-20, pulled down by a contraction in manufacturing. The slowdown in manufacturing activity was also reflected in a decline in capacity utilisation (CU) to 68.9 per cent in Q2:2019-20 from 73.6 per cent in Q1 in the early results of the Reserve Bank’s order books, inventories and capacity utilisation survey (OBICUS). Seasonally adjusted CU also fell to 69.8 per cent from 74.6 per cent during the same period. Growth in the services sector moderated, weighed down mainly by trade, hotels, transport, communication, broadcasting services and construction activity. However, growth in public administration, defence and other services accelerated in line with the surge in government final consumption expenditure. Agricultural GVA growth increased marginally, despite contraction in kharif foodgrains production in the first advance estimates.
8. Looking beyond Q2, rabi sowing is catching up from the setback caused by delay in kharif harvesting and unseasonal rainfall in October and early November. By November 29, it was only 0.5 per cent lower than the acreage covered a year ago. North-east monsoon precipitation was 34 per cent above the long-period average up to December 4. Storage in major reservoirs, the main source of irrigation during the rabi season, was at 86 per cent of the full reservoir level as on November 28 as compared with 61 per cent in the same period a year ago.
9. Contraction in output of eight core industries – which constitute 40 per cent of the index of industrial production (IIP) – extended into the second consecutive month in October and became more pronounced, dragged down by coal, electricity, cement, natural gas and crude oil. However, output of fertilisers rose sharply, reflecting expectations of robust sowing activity in the rabi season. According to the early results of the Reserve Bank’s industrial outlook survey, overall sentiment in the manufacturing sector remained in pessimism in Q3:2019-20 due to continuing downbeat sentiments on production, domestic and external demand, and the employment scenario. The purchasing managers’ index (PMI) for manufacturing increased from 50.6 in October to 51.2 in November 2019, driven up by an increase in new orders and output.
10. High frequency indicators suggest that service sector activity generally remained weak in October. Tractors and motorcycles sales – indicators of rural demand – continued to contract but at a moderated pace; however, passenger vehicle sales – an indicator of urban demand – posted a slender positive growth in October after 11 months of decline, reflecting festival season demand and promotional measures by auto companies. Commercial vehicle sales and railway freight traffic contracted. The PMI for services remained in negative zone in October (49.2) due to a decline in new export business and turning down of business expectations. However, it moved into expansion zone to 52.7 in November on a pick-up in new business.
11. Retail inflation, measured by y-o-y changes in the CPI, increased sharply to 4.6 per cent in October, propelled by a surge in food prices. Fuel group prices remained in deflation, while inflation in CPI excluding food and fuel moderated further from its level a month ago.
12. Turning to the drivers of CPI, food inflation spiked to 6.9 per cent in October – a 39-month high – pushed up by a sharp increase in prices of vegetables due to heavy unseasonal rains. Prices of onions, in particular, shot up by 45.3 per cent in September and further by 19.6 per cent in October. Inflation in several other food items such as fruits, milk, pulses and cereals also increased, reflecting diverse factors – the cost push of fodder prices in the case of milk; decline in production and sowing area of pulses; and minimum support price effects. Sugar and confectionery prices moved out of deflation in October as sugarcane output shrank on a y-o-y basis.
13. Fuel group prices remained weak for the fourth consecutive month in October due to deflation in prices of LPG, firewood and chips. Electricity prices, however, picked up in October following a rise in user charges by power distribution companies (DISCOMs) across 13 states as reflected in the CPI.
14. Inflation in CPI excluding food and fuel softened further from 4.2 per cent in September to 3.4 per cent in October, primarily due to favourable base effects. Price increases also moderated across several services as reflected in transportation fares, telephone charges, tuition fees and house rentals.
15. Households’ inflation expectations, measured by the Reserve Bank’s November 2019 round of the survey, increased by 120 basis points over the 3-month ahead horizon and 180 basis points over the 1-year ahead horizon as they adapted to the spike in food prices in recent months. Based on the Reserve Bank’s consumer confidence survey, spending on non-essential items of consumption has shrunk compared to a year ago; however, consumers expect their overall spending to remain unchanged going forward largely due to an increase in prices. Manufacturing firms polled in the industrial outlook survey of the Reserve Bank expect (i) weak demand conditions and reduced input price pressures in Q3:2019-20 and Q4; and (ii) muted output prices reflecting further weakening of pricing power.
16. Overall liquidity in the system remained in surplus in October and November 2019 despite an expansion of currency in circulation due to festival demand. Average daily net absorption under the LAF amounted to ₹1,98,566 crore in October. The Centre availed of ways and means advances (WMA) in the first week and the last three days of the month to fund its expenditure. In November, the average daily net absorption of surplus liquidity soared to ₹2,40,566 crore with more frequent and larger recourse to WMA by the Government. Consequently, the Reserve Bank decided to conduct longer-term variable rate reverse repo auctions with effect from November 4, 2019 in addition to overnight variable rate reverse repo auctions. So far, four longer term reverse repo auctions have been conducted – two auctions of 21 days tenor and one each of 35 days and 42 days tenor – absorbing ₹78,934 crore. Reflecting easy liquidity conditions, the weighted average call rate (WACR) traded below the policy repo rate (on an average) by 8 basis points (bps) in October and by 10 bps in November.
17. Monetary transmission has been full and reasonably swift across various money market segments and the private corporate bond market. As against the cumulative reduction in the policy repo rate by 135 bps during February-October 2019, transmission to various money and corporate debt market segments ranged from 137 bps (overnight call money market) to 218 bps (3-month CPs of non-banking finance companies). Transmission to the government securities market, however, has been partial at 113 bps (5-year government securities) and 89 bps (10-year government securities). Credit market transmission remains delayed but is picking up. The 1-year median marginal cost of funds-based lending rate (MCLR) has declined by 49 basis points. The weighted average lending rate (WALR) on fresh rupee loans sanctioned by banks declined by 44 basis points, while the WALR on outstanding rupee loans increased by 2 basis points during this period. However, transmission is expected to improve going forward as (i) the share of base rate loans, interest rates on which have remained sticky, declines; and (ii) MCLR-based floating rate loans, which typically have annual resets, become due for renewal.
18. After the introduction of the external benchmark system, most banks have linked their lending rates to the policy repo rate of the Reserve Bank. The median term deposit rate has declined by 47 bps during February-November 2019. The weighted average term deposit rate declined by 9 bps in October as against a decline of just 7 bps in eight months during February-September. This augurs well for transmission to lending rates, going forward.
19. Exports contracted in September-October 2019, reflecting the persisting weakness in global trade. Excluding petroleum products, however, the decline in exports was less pronounced and, in fact, non-oil export growth returned to positive territory in October after a hiatus of two months. Imports contracted faster than exports, with lower international crude oil prices resulting in a decline in the oil import bill. A sharp contraction in the volume of gold imports kept outgoes on this account in check. Non-oil non-gold imports also contracted, pulled down by electronics, coal and pearls and precious stones. Reflecting these developments, the trade deficit narrowed in September-October. On the financing side, net foreign direct investment rose to US$ 20.9 billion in H1:2019-20 from US$ 17.0 billion a year ago. Net foreign portfolio investment was of the order of US$ 8.8 billion in April-November 2019 as against net outflows of US$ 14.9 billion in the same period of last year. In addition, net investment by FPIs under the voluntary retention route have amounted to US$ 6.3 billion since March 11, 2019. Net disbursals of external commercial borrowings rose to US$ 11.5 billion during April-October 2019 as against US$ 1.2 billion during the same period a year ago. India’s foreign exchange reserves were at US$ 451.7 billion on December 3, 2019 – an increase of US$ 38.8 billion over end-March 2019.
Outlook
20. In the fourth bi-monthly resolution of October 2019, CPI inflation was projected at 3.4 per cent for Q2:2019-20, 3.5-3.7 per cent for H2:2019-20 and 3.6 per cent for Q1:2020-21 with risks evenly balanced. The actual inflation outcome for Q2 evolved broadly in line with projections – averaging 3.5 per cent. The inflation print for October, however, was much higher than expected.
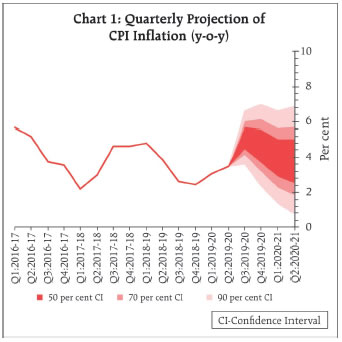
21. Going forward, the inflation outlook is likely to be influenced by several factors. First, the upsurge in prices of vegetables is likely to continue in immediate months; however, a pick-up in arrivals from the late kharif season along with measures taken by the Government to augment supply through imports should help soften vegetables prices by early February 2020. Second, incipient price pressures seen in other food items such as milk, pulses, and sugar are likely to be sustained, with implications for the trajectory of food inflation. Third, both the 3-month and 1-year ahead inflation expectations of households polled by the Reserve Bank have risen and these latent sentiment upsides are being reflected in other surveys as well. Fourth, domestic financial markets have exhibited volatility. Fifth, domestic demand has slowed down, which is being reflected in the softening of inflation excluding food and fuel. Sixth, crude oil prices are expected to remain range bound, barring any supply disruptions due to geo-political tensions. Taking into consideration these factors, the CPI inflation projection is revised upwards to 5.1-4.7 per cent for H2:2019-20 and 4.0-3.8 per cent for H1:2020-21, with risks broadly balanced (Chart 1).
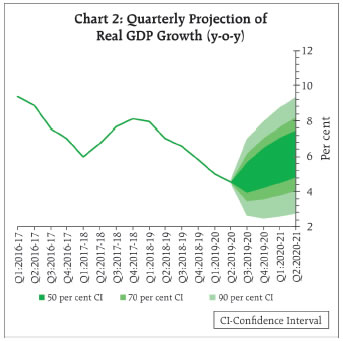
22. Turning to the growth outlook, real GDP growth for 2019-20 in the October policy was projected at 6.1 per cent – 5.3 per cent in Q2:2019-20 and in the range of 6.6-7.2 per cent for H2:2019-20 – with risks evenly balanced; and 7.2 per cent for Q1:2020-21. GDP growth for Q2:2019-20 turned out to be significantly lower than projected. Various high frequency indicators suggest that domestic and external demand conditions have remained weak. Based on the early results, the business expectations index of the Reserve Bank’s industrial outlook survey indicates a marginal pickup in business sentiments in Q4. On the positive side, however, monetary policy easing since February 2019 and the measures initiated by the Government over the last few months are expected to revive sentiment and spur domestic demand. Taking into consideration these factors, real GDP growth for 2019-20 is revised downwards from 6.1 per cent in the October policy to 5.0 per cent – 4.9-5.5 per cent in H2 and 5.9-6.3 per cent for H1:2020-21 (Chart 2). While improved monetary transmission and a quick resolution of global trade tensions are possible upsides to growth projections, a delay in revival of domestic demand, a further slowdown in global economic activity and geo-political tensions are downside risks.
23. The MPC notes that economic activity has weakened further and the output gap remains negative. However, several measures already initiated by the Government and the monetary easing undertaken by the Reserve Bank since February 2019 are gradually expected to further feed into the real economy. Data on corporate finance and on projects sanctioned by banks and financial institutions suggest some early signs of recovery in investment activity, though its sustainability needs to be watched closely. The need at this juncture is to address impediments, which are holding back investments. The introduction of external benchmarks is expected to strengthen monetary transmission. In this context, there is also a need for greater flexibility in the adjustment in interest rates on small saving schemes. In the judgement of the MPC, inflation is rising in the near-term, but it is likely to moderate below target by Q2:2020-21. It is, therefore, prudent to carefully monitor incoming data to gain clarity on the inflation outlook. Similarly, the forthcoming union budget will provide better insight into further measures to be undertaken by the Government and their impact on growth.
24. The MPC recognises that there is monetary policy space for future action. However, given the evolving growth-inflation dynamics, the MPC felt it appropriate to take a pause at this juncture. Accordingly, the MPC decided to keep the policy repo rate unchanged and continue with the accommodative stance as long as it is necessary to revive growth, while ensuring that inflation remains within the target.
25. All members of the MPC – Dr. Chetan Ghate, Dr. Pami Dua, Dr. Ravindra H. Dholakia, Dr. Michael Debabrata Patra, Shri Bibhu Prasad Kanungo and Shri Shaktikanta Das – voted in favour of the decision.
26. The minutes of the MPC’s meeting will be published by December 19, 2019.
27. The next meeting of the MPC is scheduled during February 4-6, 2020.”
Statement by Reserve Bank of India Governor Shri Shaktikanta Das:
“The Monetary Policy Committee (MPC) had discussions during 3rd, 4th and 5th December, 2019. It deliberated extensively on the current and evolving macroeconomic and financial conditions, and the outlook. Based on its considered assessment, the MPC voted unanimously to keep the policy rate unchanged. It, however, decided to continue with the accommodative stance as long as it is necessary to revive growth, while ensuring that inflation remains within the target.
2. I express my gratitude to the MPC members for the insightful deliberations and assessment, which went into the policy decision and are captured in the Resolution which has just been released on the RBI’s website.
3. I also want to thank our teams in the RBI for their continued high quality support to the MPC’s deliberations with their hard work, research and logistics.
4. At the outset, I shall briefly explain the main considerations underlying the MPC’s decision. The MPC noted that since its meeting in October 2019, global economic activity has remained subdued, though some signs of resilience are becoming visible. Growth has shown signs of picking up in some advanced economies (AEs) and emerging market economies (EMEs). Crude oil prices have moved in a narrow range in both directions, reflecting the constantly changing sentiments relating to the progress of the US-China trade talks. Inflation has generally remained benign in major AEs and EMEs in Q3 of 2019. Global financial markets were buoyed in October by risk-on sentiment stemming from renewed optimism on a trade truce between the US and China and possibility of a Brexit deal. However, selling pressure took hold in the second half of November on renewed fears of US-China trade talks getting stalled on the Hong Kong stand-off. While the US dollar weakened against other major currencies, EME currencies have been trading with an appreciating bias.
5. Turning to domestic developments, real GDP growth moderated to 4.5 per cent year-on-year (y-o-y) in Q2:2019-20, extending sequential deceleration to the sixth consecutive quarter. The slowdown in GDP growth was cushioned by a jump in government final consumption expenditure (GFCE). On the supply side, gross value added (GVA) growth decelerated to 4.3 per cent in Q2:2019-20, pulled down by contraction in manufacturing. Growth in the services sector moderated, but agricultural GVA growth increased marginally.
6. Beyond Q2, there are several positive developments which could turn out to be green shoots, depending on how they evolve. Rabi sowing is catching up from the setback caused by delay in kharif harvesting and unseasonal rainfall in October and early November. By November 29, rabi sowing was only 0.5 per cent lower than the acreage covered a year ago. North-east monsoon precipitation was 34 per cent above the long-period average up to December 4. Storage in major reservoirs, the main source of irrigation during the rabi season, was at 86 per cent of the full reservoir level as on November 28 as compared with 61 per cent in the same period a year ago.
7. Although there was contraction in output of eight core industries – which constitute 40 per cent of the index of industrial production (IIP) – for the second consecutive month in October, the output of fertilisers rose sharply, reflecting expectations of robust sowing activity in the rabi season. Overall business sentiment remained in pessimism in Q3:2019-20; however, the purchasing managers’ index (PMI) for manufacturing increased from 50.6 in October to 51.2 in November 2019, driven up by an increase in new orders and output.
8. High frequency indicators suggest that service sector activity generally remained weak in October. However, foreign tourist arrivals posted improvement for the second consecutive month in October 2019. Steel consumption also showed a modest revival on a y-o-y basis in October 2019. There has been steady support to aggregate demand from Union Government expenditure in the month of October 2019. The PMI for services, which had remained in contraction in October (49.2) due to a decline in new export business and turning down of business expectations, moved into expansion zone to 52.7 in November on a pick-up in new business.
9. As regards the external sector, exports contracted in September-October 2019, reflecting the persisting weakness in global trade, but non-oil export growth returned to positive territory in October after a gap of two months. Imports contracted faster than exports and as a result, the trade deficit narrowed in September-October 2019. On the financing side, net foreign direct investment rose to US$ 20.9 billion in H1:2019-20 from US$ 17.0 billion a year ago. Net foreign portfolio investment was of the order of US$ 8.8 billion in April-November 2019 as against net outflows of US$ 14.9 billion in the same period last year. Net investment by FPIs under the voluntary retention route have amounted to US$ 6.3 billion since March 11, 2019. Net disbursals of external commercial borrowings rose to US$ 11.5 billion during April-October 2019 as against US$ 1.2 billion during the same period a year ago. India’s foreign exchange reserves were at US$ 451.7 billion on December 3, 2019 – an increase of US$ 38.8 billion over end-March 2019.
10. Consumer Price Inflation (CPI) increased sharply to 4.6 per cent in October, propelled by a surge in food prices. Fuel group prices remained in deflation, while inflation in CPI excluding food and fuel moderated further from its level a month ago, reflecting the underlying weakness in domestic demand conditions. Survey responses indicate that households’ inflation expectations increased by 120 basis points over the 3-month ahead horizon and 180 basis points over the 1-year ahead horizon as they adapted to the spike in food prices in recent months. Manufacturing firms expect weak demand conditions and reduced input price pressures in Q3:2019-20 and Q4, but they also expect muted output prices reflecting further weakening of pricing power.
11. Taking into account these developments, the MPC revised the CPI inflation projection upwards to 5.1-4.7 per cent for H2:2019-20 and 4.0-3.8 per cent for H1:2020-21, with risks broadly balanced. Real GDP growth for 2019-20 is revised downwards from 6.1 per cent in the October policy to 5.0 per cent – 4.9-5.5 per cent in H2 and 5.9-6.3 per cent for H1:2020-21.
12. The MPC was of the view that economic activity has weakened further and the output gap remains negative. However, several measures already initiated by the Government and the monetary easing undertaken by the Reserve Bank since February 2019 are gradually expected to further feed into the real economy. The impact of external benchmarking of lending rates by banks will further play out in the coming days and months. Inflation is rising in the near-term, but it is likely to moderate below target by Q2: 2020-21. In order to have greater clarity with regard to the overall outlook, the MPC considered it prudent to carefully monitor incoming data. The forthcoming Union Budget will also provide better insight into further measures to be undertaken by the Government and their impact on growth. Against this backdrop, the MPC judged that there is monetary policy space for future action, but felt it appropriate to take a pause at this juncture.
13. Let me now further elaborate on the macroeconomic situation and outlook. First, inflation has indeed risen sharply in November and may remain elevated for a few months. However, the forces driving up inflation appear to be transient. The spike in inflation is essentially due to food prices impacted by unseasonal rains that have caused damage to the standing kharif crops. Meanwhile rabi sowing is catching up rapidly, and full reservoir levels will provide a cushion against the vagaries of the weather. Therefore, there is a case for looking through the current food price spike, but it would be prudent to await greater clarity on how the inflation path evolves, given the likelihood that several food prices may stabilise by Q4:2019-20.
14. There are also some indications that the capex cycle may be turning up. Unaudited results of 1,539 listed private manufacturing companies suggest that funds mobilised by these corporates during H1:2019-20, including possibly the saving on account of the corporate income tax cut effected in September, were mainly used for fixed assets formation and deleveraging (reduced borrowing). These companies were investing in financial instruments such as investment and loans and advances during the last couple of years in the face of subdued demand. This shift to investment in fixed assets under the head ‘capital work in progress’ in H1:2019-20 appears to be broad based and even after excluding a few large companies from the sample, the preference for fixed assets is noticeable. Furthermore, pipeline projects sanctioned by banks/financial institutions in the preceding years envisage an expansion in capex spending for the year 2019-20. While these developments are still tentative, they would need to be carefully monitored with incoming data to look out for a durable revival in the capex cycle.
15. Monetary transmission has been full and reasonably swift across various money market segments and the private corporate bond market. As against the cumulative reduction in the policy repo rate by 135 bps during February-October 2019, transmission to various money market and corporate debt market segments ranged from 137 bps (overnight call money market) to 218 bps (3-month CPs of non-banking finance companies). Transmission to the government securities market has been 113 bps for yields on 5-year government securities and 89 bps for yields on 10-year government securities. In the credit market, the 1-year median marginal cost of funds-based lending rate (MCLR) has declined by 49 basis points. The weighted average lending rate (WALR) on fresh rupee loans sanctioned by banks declined by 44 basis points. Going forward, transmission is expected to improve with the introduction of the external benchmark system, as most banks have linked their lending rates to the policy repo rate of the Reserve Bank. Already, the weighted average term deposit rate has fallen by 16 bps. Overall liquidity in the system remains in sizable surplus. This augurs well for transmission to lending rates, going forward.
16. In line with the slowdown in the economy, GST collections so far have fallen below budgeted targets and a similar scenario with regard to direct taxes and customs duty collections can not be ruled out. It is also likely that the Government may initiate some more counter-cyclical fiscal and other measures to arrest the slowdown. The forthcoming Union Budget will provide greater clarity on all these aspects. At this critical juncture, it is of paramount importance that monetary policy and fiscal policy continue to work in coordination to achieve the best results in the national endeavour to revive growth.
17. The RBI has been pre-emptive in easing monetary policy, with the easing cycle commencing as early as February 2019. Rate reductions have occurred in quick succession in every MPC meeting since then. In its decision today, the MPC has committed to maintaining an accommodative stance as long as it is necessary to revive growth, while ensuring that inflation remains within the target. This forward guidance in itself indicates that there is space available for further monetary policy action. However, there is a need to optimise the impact of rate reductions. The key consideration has to be the timing of further actions, even as we monitor the impact of actions already taken so far. It is in this context that the MPC decided to pause for now and evaluate the developments with a readiness to act, if the unfolding situation so warrants.
18. Now, I shall address developmental and regulatory policy measures undertaken for strengthening regulation and supervision, broadening and deepening financial markets, and improving payment and settlement systems.
19. On regulation and supervision, guidelines relating to urban cooperative banks (UCBs) on exposure norms for single and group/interconnected borrowers, promotion of financial inclusion, priority sector lending, and the like would be amended with a view to reducing concentration risk and to further strengthen the role of UCBs in promoting financial inclusion. A draft circular in this regard will be put up in the public domain for stakeholder consultation. These measures are expected to strengthen the resilience and sustainability of UCBs and protect the interest of depositors. UCBs with assets of ₹500 crores and above will be brought under the Central Repository of Information on Large Credits (CRILC) reporting framework to inter alia strengthen offsite supervision and early recognition of financial distress. Furthermore, it has been decided to prescribe a comprehensive cyber security framework for the UCBs in a graded approach. This would bolster cyber security preparedness and ensure that UCBs are brought at par with commercial banks in addressing cyber security threats.
20. A number of commercial banks, urban cooperative banks and other regulated entities are dependent upon third party application service providers for shared services for ATM Switch applications. Accordingly, it has been decided that certain baseline cyber security controls shall be mandated by the regulated entities in their contractual agreements with these service providers. to strengthen the systems.
21. Drawing on the recommendations of the Task Force on Development of Secondary Market for Corporate Loans, the Reserve Bank will facilitate the setting up of a self-regulatory body (SRB) as a first step towards the development of the secondary market for corporate loans. The SRB will be responsible, inter alia, for standardising documents, covenants and practices related to secondary market transactions in corporate loans and promoting the growth of the secondary market in line with regulatory objectives.
22. International Financial Service Centre Banking Units (IBUs) will be allowed to open foreign currency current accounts of their corporate borrowers, subject to the provisions of FEMA 1999 and to accept fixed deposits in foreign currency of tenor less than one year from non-bank entities with a view to facilitating ease of operations.
23. The aggregate limits for both borrowers and lenders across all NBFC peer-to-peer (P2P) platforms will be increased from ₹10 lakh to a cap of ₹50 lakh while doing away with the current requirement of escrow accounts to be operated by bank promoted trustee for transfer of funds having to be necessarily opened with the concerned bank. This will provide more flexibility in operations.
24. ‘On tap’ Licensing Guidelines for Small Finance Banks are being issued today.
25. As regards financial markets, after due stakeholder consultations, certain changes are being effected in foreign exchange hedging facilities. Users may undertake over the counter (OTC) currency derivative transactions up to USD 10 million, without the need to evidence underlying exposure. Banks shall be provided with the discretion, in exceptional circumstances, to pass on net gains on hedge transactions booked on anticipated exposures. Safeguards will be strengthened to ensure that complex derivatives are sold only to users that are capable of managing the risks.
26. Finally, in the area of payment and settlement, Prepaid Payment Instruments (PPIs) have been playing an important role in promoting digital payments. To further facilitate PPI usage, it is proposed to introduce a new type of PPI which can be used only for purchase of goods and services up to a limit of ₹10,000. The loading / reloading of such PPI will be only from a bank account and they shall be used for making only digital payments.”
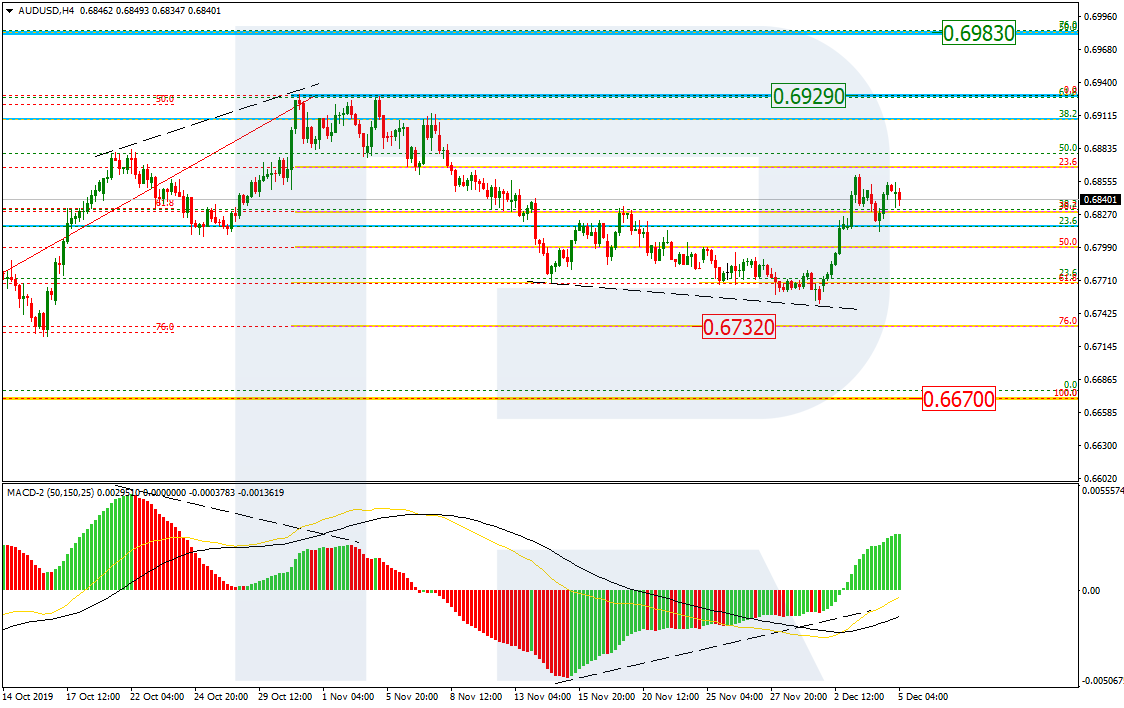
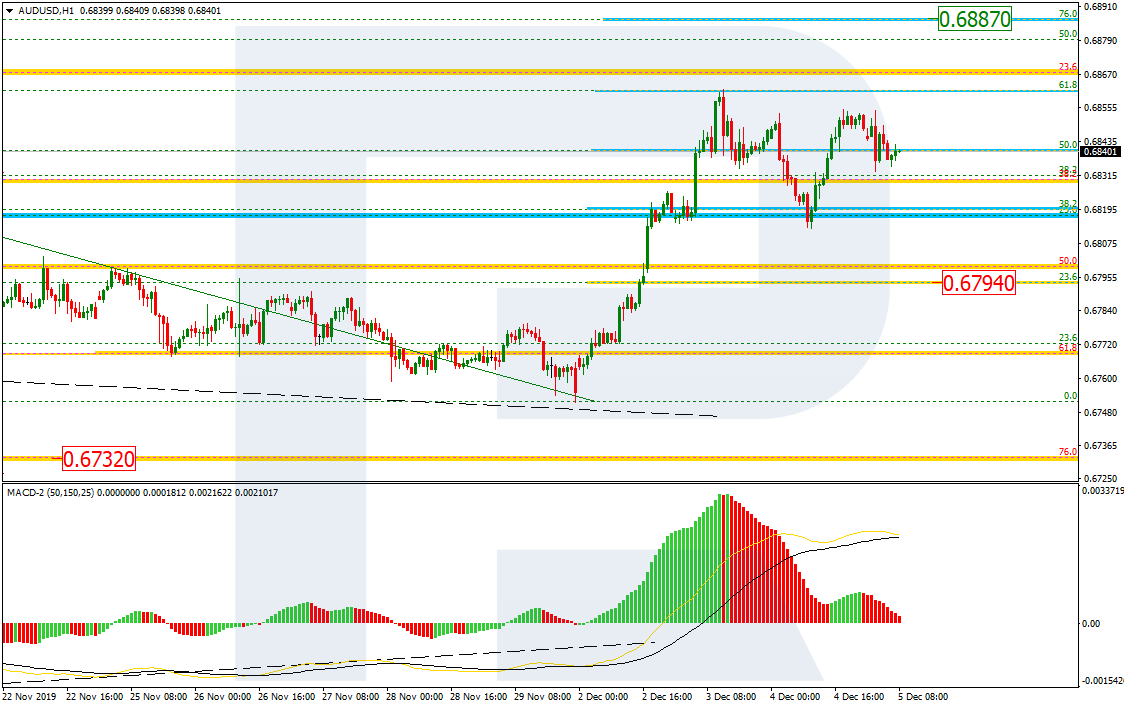
As we can see in the H4 chart, the correctional downtrend seems to have completed a bit lower than 61.8% fibo, but one shouldn’t expect it to continue towards 76.0% fibo at 0.6732. After the convergence on MACD, the price is forming a new rising wave towards the high at 0.6929. if the pair breaks it, the instrument may continue the ascending tendency to reach the long-term target at 50.0% (0.6983).
The H1 chart shows more detailed structure of the current correctional uptrend, which has already reached 61.8% fibo. Right now, the pair is forming a new pullback. The support is 23.6% fibo at 0.6794. After completing the pullback, the instrument may start another rising impulse to reach 76.0% fibo at 0.6887.
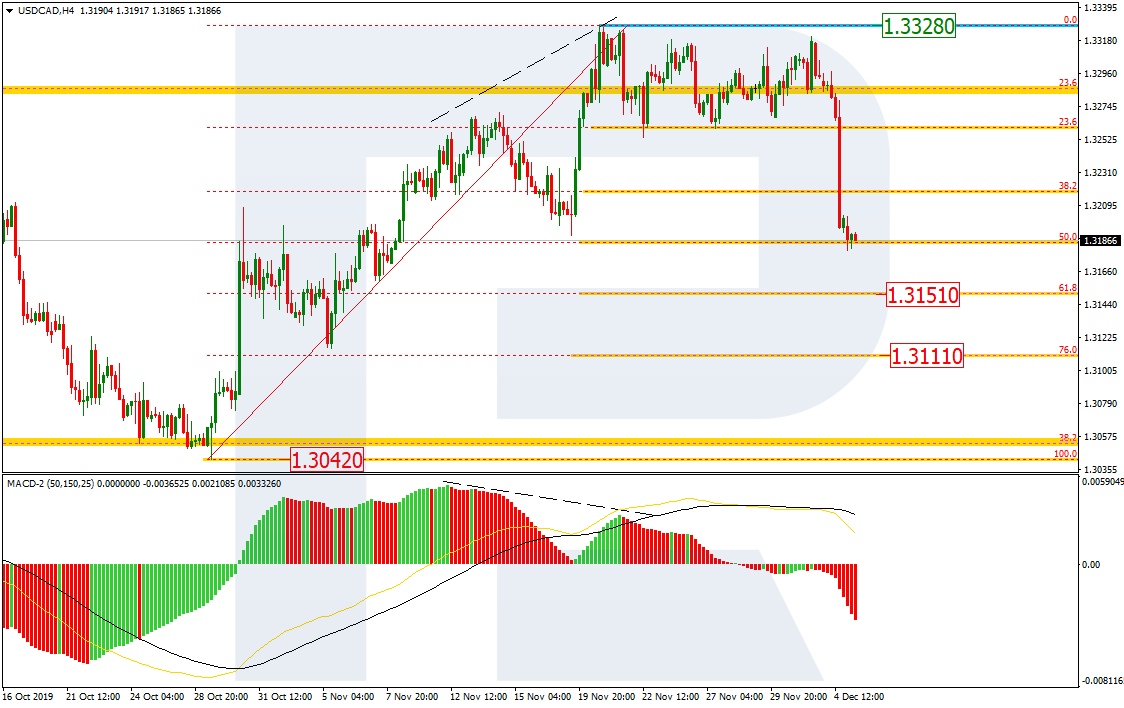
USDCAD, “US Dollar vs Canadian Dollar”
As we can see in the H4 chart, the divergence made USDCAD finish its two-week sideways movement and start plunging. By now, it has already reached 50.0% and may later continue falling towards 61.8% and 76.0% fibo at 1.3151 and 1.3111 respectively. the key target is the low at 1.3042.
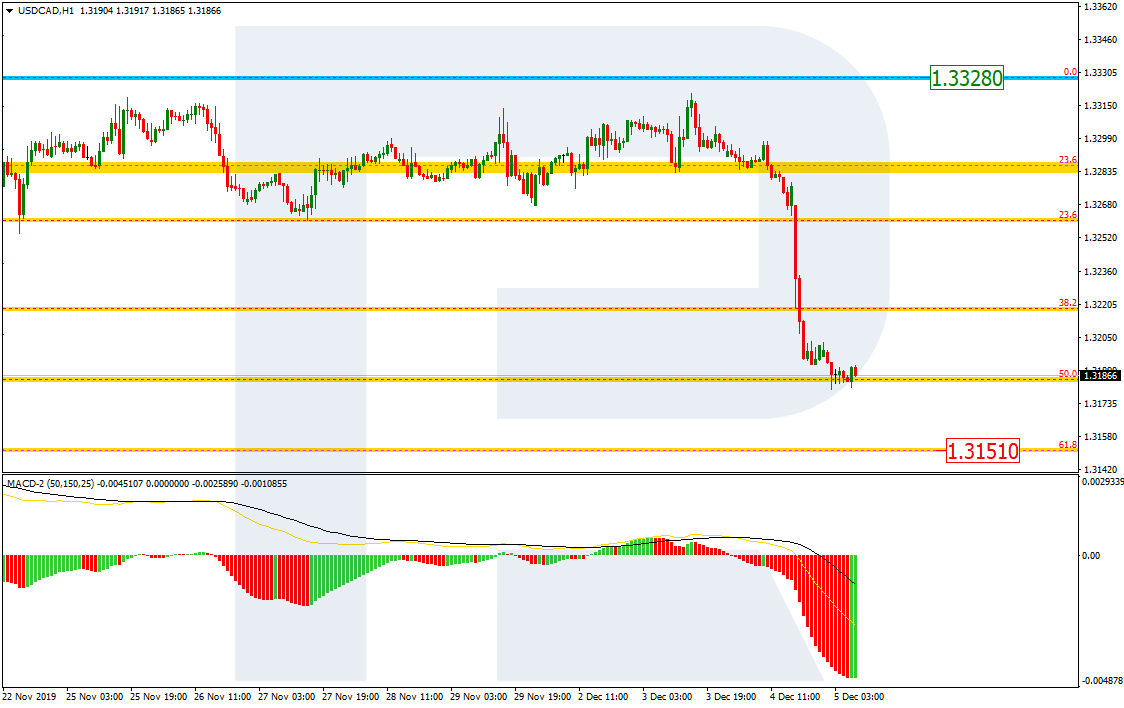
In the H1 chart, the pair has stopped its decline at 50.0% fibo. This may indicate a slowdown of the short-term tendency and a possible pullback in the nearest future.
Attention! Forecasts presented in this section only reflect the author’s private opinion and should not be considered as guidance for trading. RoboForex LP bears no responsibility for trading results based on trading recommendations described in these analytical reviews.