On Friday, the US dollar strengthened against a basket of major currencies. The dollar index (#DX) closed yesterday in the green zone (+0.30%). Optimistic data on the US labor market published on Friday supported the greenback. Thus, the number of people employed in the nonfarm sector of the United States grew by 266K instead of 186K. The unemployment rate counted to 3.5% instead of the forecasted value of 3.6%. At the moment, investors expect the US President Trump’s decision regarding the introduction of new tariffs for China, which is scheduled for December 15.
The British pound strengthened against the US dollar. On Thursday, December 12, general elections will be held in the British Parliament regarding the Brexit issue. The currency was supported amid expectations that the Conservative Party of British Prime Minister Boris Johnson would receive an absolute majority in the election.
The “black gold” prices are falling after growth the day before. Currently, futures for the WTI crude oil are testing the $58.65 mark per barrel.
Market Indicators
On Friday, there was the bullish sentiment in the US stock market: #SPY (+0.91%), #DIA (+1.20%), #QQQ (+1.07%).
The 10-year US government bonds yield has risen. At the moment, the indicator is at the level of 1.82-1.83%.
During Friday’s trading, the EUR/USD quotes fell. An optimistic report on the US labor market were published on Friday, which propped up the USD. Thus, the number of employees in the non-agricultural sector of the United States grew by 266K instead of 186K. The unemployment rate was 3.5% instead of the predicted value of 3.6%. Currently, the key support and resistance levels are 1.10550 and 1.10800, respectively. Open positions from these marks.
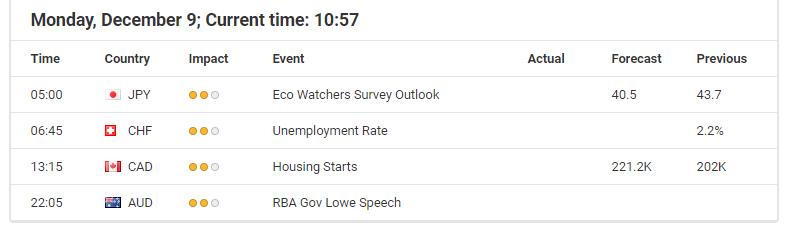
The Economic News Feed for 09.12.2019 is calm.
Indicators indicate the strength of sellers: the price is being traded below 50 MA and 100 MA.
The MACD histogram is in the negative zone, but above the signal line, which gives a weak signal to sell EUR/USD.
The Stochastic Oscillator is in the overbought zone, the %K line is above the %D line, which gives a weak signal to buy EUR/USD.
Trading recommendations
Support levels: 1.10550, 1.10300, 1.10000
Resistance levels: 1.10800, 1.11050
If the price consolidates below 1.10550, expect the quotes to descend toward 1.10000
Alternative ly, the price could fix above 1.10800 amd rise toward 1.11050-1.11300.
The GBP/USD currency pair
Technical indicators of the currency pair:
Prev Open: 1.31622
Open: 1.31350
% chg. over the last day: -0.15
Day’s range: 1.31506 – 1.31580
52 wk range: 1.1959 – 1.3385
GBP/USD does not show a defined trend. Participants in financial markets are waiting for a vote in the UK parliament on the Brexit issue, due on December 12th. At the moment, the key support level is 1.31400. The key resistance level is 1.31800. We recommend opening positions from these marks.
The Economic News Feed for 09.12.2019 is calm.
Indicators point to a bullish sentiment: the price is being traded above 50 MA and 100 MA.
The MACD histogram is in the positive zone, above the signal line, which gives a strong signal to buy GBP/USD.
The Stochastic Oscillator is near the overbought zone, the %K line crossed the %D line. There are no signals.
Trading recommendations
Support levels: 1.31400, 1.30900, 1.30500
Resistance levels: 1.31800, 1.32000
If the price consolidates above 1.31800, expect the quotes to rise toward 1.32000.
Alternatively, the quotes could fix below 1.31400 and the pair could decline toward 1.30900-1.30700.
The USD/CAD currency pair
Technical indicators of the currency pair:
Prev Open: 1.31781
Open: 1.32520
% chg. over the last day: +0.62
Day’s range: 1.32608 – 1.32650
52 wk range: 1.2727 – 1.3664
During Friday’s trading, the USD/CAD quotes increased significantly. The trading instrument grew by almost 100 points. The USD was supported by optimistic economic reports. Quotes are currently being consolidated. Investors expect additional drivers. The local support and resistance levels are 1.32300 and 1.32700, respectively. We recommend paying attention to the dynamics of oil prices. Open positions from key levels.
The Economic News Feed for 09.12.2019 is calm.
Indicators point to a bullish sentiment: the price is being traded above 50 MA and 100 MA.
The MACD histogram is in the positive zone, but below the signal line, which gives a weak signal to buy USD/CAD.
The Stochastic Oscillator is in the neutral zone, the %K line is above the %D line, which also gives a signal to buy USD/CAD.
Trading recommendations
Support levels: 1.32300, 1.31900, 1.31600
Resistance levels: 1.32700, 1.33000
If the price consolidates above 1.32700, expect further growth toward 1.33000.
Alternatively, the quotes could descend toward 1.32300-1.32100.
The USD/JPY currency pair
Technical indicators of the currency pair:
Prev Open: 108.748
Open: 108.360
% chg. over the last day: -0.14
Day’s range: 108.574 – 108.600
52 wk range: 104.97 – 114.56
A variety of trends was observed on Friday on the USD/JPY currency pair. Investors are awaiting new information regarding US-China trade relations. Currently, the key support and resistance levels are 108.450 and 108.650, respectively. We also recommend that you pay attention to the dynamics of yield on US government bonds. Open positions from key levels.
During the Asian trading session, Japan published an optimistic GDP report.
Indicators point to the strength of sellers: the price is being traded below 50 MA and 100 MA.
The MACD histogram is in the negative zone, below the signal line, which gives a strong signal to sell USD/JPY.
The Stochastic Oscillator is located near the oversold zone, the %K line crosses the %D line. There are no exact signals.
Trading recommendations
Support levels: 108.450, 108.250
Resistance levels: 108.650, 108.850, 109.150
If the price consolidates below the key support level of 108.450, expect the quotes to drop toward 108.250-108.100.
Alternatively, the quotes could grow toward 108.850-109.000.
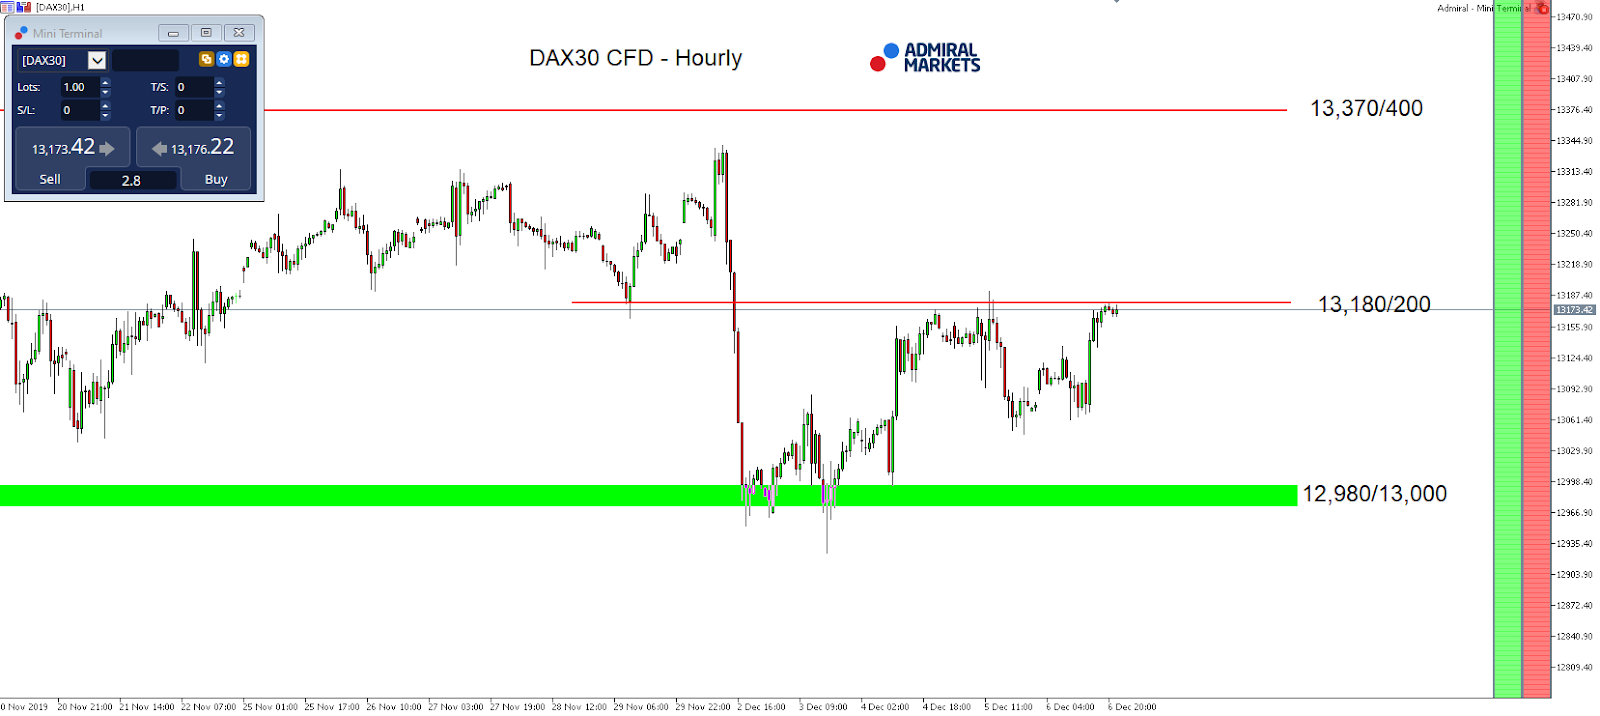
With the economic calendar being thin into the start of the week, today we will look at the DAX30 CFD from a technical perspective.
After the drop below 13,000 points in the first half of last week, the German index recovered slightly into the weekly close. However, the bears have the advantage on their side as long as we trade below 13,180/200 points.
Below that level, another attempt to sustainably break below 13,000 points stays on the table, while a drop below the pre-weekly lows around 12,930 points activates the region around 12,800/830 points.
On the other hand: if bulls can recapture 13,180/200 (a move that may be induced by new trade dispute optimism), a move up to and above 13,300 points is an option, erasing most of the losses from last Monday.
Source: Admiral Markets MT5 with MT5SE Add-on DAX30 CFD Hourly chart (between 19 November 2019 to 06 December 2019). Accessed: 06 December 2019 at 10:00 PM GMT
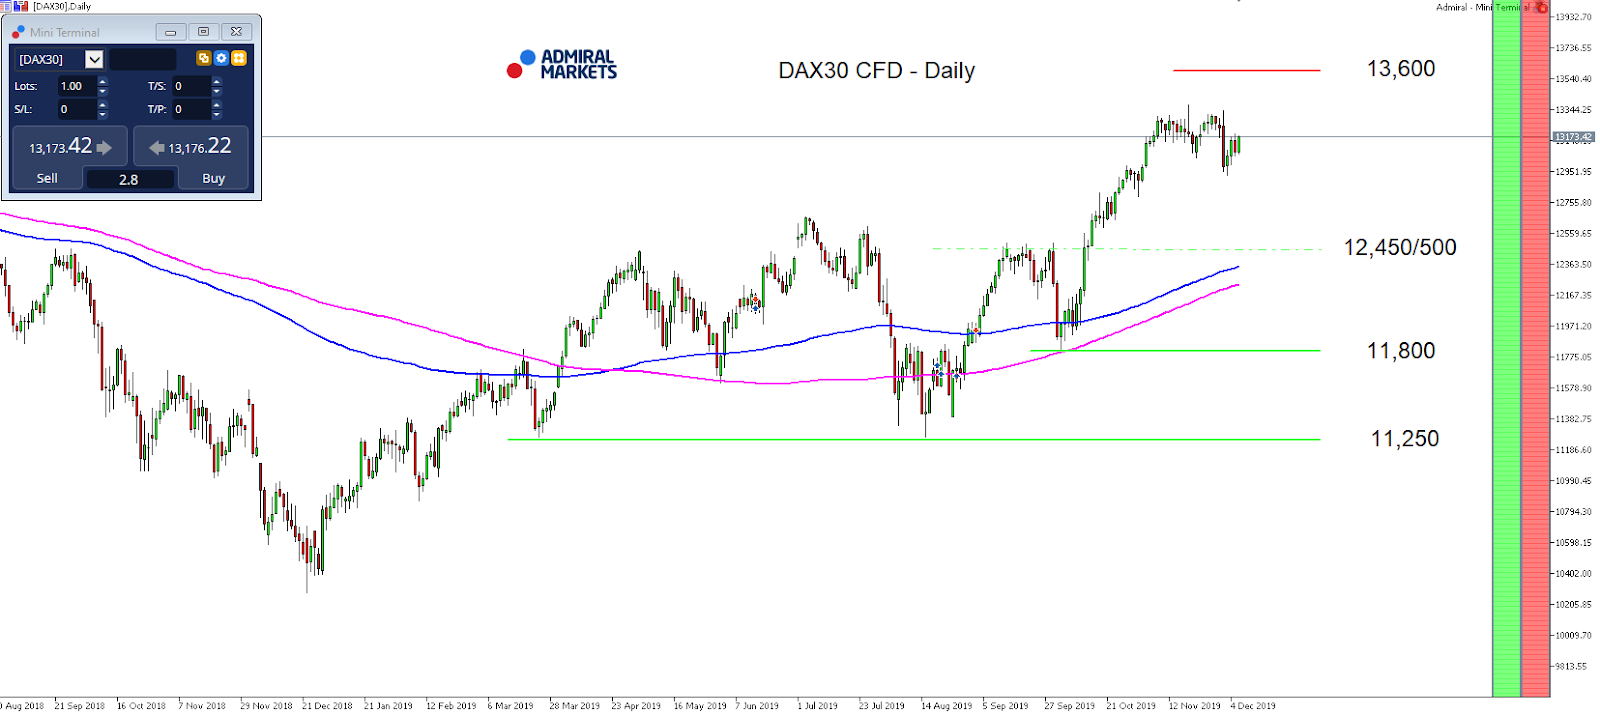
Source: Admiral Markets MT5 with MT5SE Add-on DAX30 CFD Daily chart (between 30 August 2018 to 06 December 2019). Accessed: 06 December 2019 at 10:00 PM GMT
Please note: Past performance is not a reliable indicator of future results, or future performance.
In 2014, the value of the DAX30 CFD increased by 2.65%, in 2015, it increased by 9.56%, in 2016 it increased by 6.87%, in 2017 it increased by 12.51%, in 2018 it fell by 18.26%, meaning that after five years, it was up by 10.5%.
Disclaimer: The given data provides additional information regarding all analysis, estimates, prognosis, forecasts or other similar assessments or information (hereinafter “Analysis”) published on the website of Admiral Markets. Before making any investment decisions please pay close attention to the following:
This is a marketing communication. The analysis is published for informative purposes only and are in no way to be construed as investment advice or recommendation. It has not been prepared in accordance with legal requirements designed to promote the independence of investment research, and that it is not subject to any prohibition on dealing ahead of the dissemination of investment research.
Any investment decision is made by each client alone whereas Admiral Markets shall not be responsible for any loss or damage arising from any such decision, whether or not based on the Analysis.
Each of the Analysis is prepared by an independent analyst (Jens Klatt, Professional Trader and Analyst, hereinafter “Author”) based on the Author’s personal estimations.
To ensure that the interests of the clients would be protected and objectivity of the Analysis would not be damaged Admiral Markets has established relevant internal procedures for prevention and management of conflicts of interest.
Whilst every reasonable effort is taken to ensure that all sources of the Analysis are reliable and that all information is presented, as much as possible, in an understandable, timely, precise and complete manner, Admiral Markets does not guarantee the accuracy or completeness of any information contained within the Analysis. The presented figures refer that refer to any past performance is not a reliable indicator of future results.
The contents of the Analysis should not be construed as an express or implied promise, guarantee or implication by Admiral Markets that the client shall profit from the strategies therein or that losses in connection therewith may or shall be limited.
Any kind of previous or modeled performance of financial instruments indicated within the Publication should not be construed as an express or implied promise, guarantee or implication by Admiral Markets for any future performance. The value of the financial instrument may both increase and decrease and the preservation of the asset value is not guaranteed.
The projections included in the Analysis may be subject to additional fees, taxes or other charges, depending on the subject of the Publication. The price list applicable to the services provided by Admiral Markets is publicly available from the website of Admiral Markets.
Leveraged products (including contracts for difference) are speculative in nature and may result in losses or profit. Before you start trading, you should make sure that you understand all the risks.
On Monday, December 9th, Oil prices are correcting after skyrocketing last Friday. So far, Brent is trading at 64.18 USD, but earlier it tested the high at 64.87 reached on September 23rd.
OPEC and OPEC+ December meeting was over with a typical agreement signed by all parties to cut down the oil extraction in the first quarter of 2020. Most of all, it may influence Saudi Arabia and Russia. However, later Saudis announced that they were willingly ready to cut their share by additional 400 thousand barrels per day.
As a result, the total amount to be cut down by all members of OPEC+ is 2.1 million barrels.
Generally, these measures should make Oil prices more stable. The global economy is expected to continue slowing down early in 2020, while the oil production by the countries that aren’t members of the cartel will surely increase. This is exactly why these arrangements between OPEC+ countries will be helpful to avoid Oil oversupply.
The December agreement is expected to expire in March 2020, when the next meeting of OPEC+ is scheduled to take place.
As we can see in the H4 chart, Brent has broken 64.50 to the upside and may continue growing to reach 68.50 and form the third wave inside the uptrend. Today, the pair may reach 67.50 and then start another correction to return to 64.50. Later, the market may continue growing towards 68.00. From the technical point of view, this scenario is confirmed by MACD Oscillator: its signal line is moving upwards above 0, thus indicating further growth.
In the H1 chart, after breaking the consolidation range to the upside and expanding it towards 65.46 with a continuation pattern, Brent has returned to the breakout level; right now, it is still moving upwards. If later the price breaks 65.46, the instrument may continue growing to reach the short-term target at 66.80. From the technical point of view, this scenario is confirmed by Stochastic Oscillator: its signal line is moving above 50, thus directly indicating further growth.
Disclaimer
Any predictions contained herein are based on the authors’ particular opinion. This analysis shall not be treated as trading advice. RoboForex shall not be held liable for the results of the trades arising from relying upon trading recommendations and reviews contained herein.
On Friday the 6th of December, the EURUSD price was down at the close of trading. The weakening of the single currency was the result of encouraging data being published, which concerned the US labour market. This reinforced the Fed’s position of maintaining the current level of interest rates at the upcoming meeting, scheduled to take place on Wednesday, December 11.
The number of jobs in the non-agricultural sector increased by 266,000 against the forecast of 180,000. The figure for September was revised from 180,000 to over 193,000, and October from 128,000 to 156,000. The revision totaled an increase of more than 41,000.
The unemployment rate dropped to 3.5% (forecast was 3.6%), wages decreased by 0.2% (forecast was 0.3% vs. the previous value of 0.4%). The proportion of economically active members of the population decreased to 63.2% from 63.3%. Once again, we note that there is no correlation between ADP and NFP.
The positive data regarding the US labour market was supported by the business activity index in Michigan, which was above the forecasted level. Statistics aroused optimism among stock market investors and supported the USD. The euro fell to 1.1040. The euro fell badly versus the Canadian dollar, because it was sold off across all crosses.
The fall stopped at around the 67th degree, after the currency fell 58 points. Similar data taken from the 2000s shows that back then, the price fluctuations were 250-300 points. At the time of writing, the euro is valued at 1.1061. According to the forecast, we are waiting for a correction to the balance line. If the price starts to wander around the area of 1.1068-1.1070, you need to look out for the activity of both the bulls and bears. If there is no quick recovery, then after 17:00 (GMT+3), we can expect the price to fall.
This week is full of important events. Britain and Japan will publish third quarter GDP data. The Fed, SNB and the ECB will hold meetings regarding interest rate levels. Then, after the meetings, ECB President K. Largad, SNB President T. Jordan and US Federal Reserve Chairman J. Powell will give press conferences.
Given that on Wednesday, the US Federal Reserve looks nailed on to maintain its current rates, and K. Largad generally adheres to a soft monetary policy, it can be assumed that by Thursday, the euro will still hit a new high. The 1.1025-1.1030 zone is a key support. If it holds up, we will see a sharp rebound upwards.
By Hussein Sayed, Chief Market Strategist (Gulf & MENA), ForexTime
Traders and investors are bracing for a volatile week ahead as several events may determine the direction of markets for the foreseeable future.
Will the Conservatives secure a majority in the UK election?
Looking at where Sterling stands now, it seems evident that currency traders have been pricing in a Conservative majority in Parliament. With only a few days remaining until voters head to the ballot box on Thursday, bookies and opinion polls are showing the Tories still on course for a solid victory.
This would mean PM Johnson can get his Brexit deal through Parliament before Christmas, so taking the UK out of the EU by the end of January. Such an outcome will reduce uncertainty, but that wouldn’t be the end of the story as the UK still needs to reach a trade agreement with the EU. Expect the Pound’s upside to be limited in the event that the Conservatives win a majority on Thursday, as much of this outcome has already been priced in.
However, traders should be reminded of the most recent UK election two years ago and also the referendum result in 2016. Financial markets got both those results completely wrong and so there is a chance this could happen again. The possibility of another hung parliament shouldn’t be completely ruled out and traders need to be prepared for such a scenario. This would further delay Brexit and mean continued uncertainty for UK businesses and the economy, which in turn could hit Sterling hard and take it back below 1.28.
US-China trade talks
With less than a week until the December 15 deadline for the US to impose new tariffs on China, investors will be closely watching statements from US and Chinese officials. As of now, all that we have heard about is that trade talks are heading in the right direction. However, there aren’t any signs yet of a deal taking place in the next few days.
With US equity markets holding near record highs, most market participants believe that new tariffs will be delayed. President Trump doesn’t want to upset investors as we approach the 2020 Presidential elections as he needs to improve his approval rating. But given his unpredictable nature, it’s very difficult to anticipate his next move. A decision to delay tariffs for a few weeks, along with robust retail sales data released on Friday may provide a further push to equity markets. If Trump announces that December 15 tariffs will take effect, get ready for a big rally in safe-haven assets and a similar sized sell-off in stocks.
Fed and ECB policy decisions
After Friday’s robust US jobs report, Fed policymakers have strong justification as to why they will end the mid-cycle adjustment which has seen three interest rate cuts since July. We do not expect any significant change in language, but it will be interesting to see if growth and inflation forecasts have changed since September.
Inflation data will be released on the same day the Fed announces its decision. If CPI moves above 2%, there’s a chance the Fed will begin leaning towards tightening policy rather than loosening. That’s especially the case if a “phase one” trade deal gets signed.
The ECB is also expected to stand pat when it delivers its policy decision the following day. Instead, the focus will be on Christine Lagarde’s press conference as she delivers her first statement at the helm of the central bank. Investors want to know whether her approach will represent a continuation of Draghi’s policies or whether she has a different strategy.
Disclaimer: The content in this article comprises personal opinions and should not be construed as containing personal and/or other investment advice and/or an offer of and/or solicitation for any transactions in financial instruments and/or a guarantee and/or prediction of future performance. ForexTime (FXTM), its affiliates, agents, directors, officers or employees do not guarantee the accuracy, validity, timeliness or completeness, of any information or data made available and assume no liability as to any loss arising from any investment based on the same.
The Canadian company announced a $21 million budget and aims to complete the expansion by year-end 2020.
Great Bear Resources Ltd. (GBR:TSX.V; GTBDF:OTCQX) more than doubled its ongoing drill program at Dixie in Ontario’s Red Lake District to 200,000 meters (200,000m) from 90,000m, it announced in a news release. The explorer aims to complete the remaining meters of drilling by year-end 2020.
“We are about to undertake one of Canada’s largest, gold-focused exploration drill programs in 2020,” President and CEO Chris Taylor said in the release. “We anticipate 2020 will mark our most exciting year to date.”
To accommodate the expansion and allow for getting down to a 2,000m depth, higher capacity drill rigs are being mobilized to the site for 2020. The company expects to have five rigs working early next year and to adjust the number as needed.
The 2020 budget for the expanded drill program is $21 million, for which Great Bear remains fully funded, the company stated, noting it has a total potential cash position of approximately $41 million, composed of $31 million in cash and about $10 million in warrants.
Drilling, which will occur all throughout 2020, will target the known gold zones at the LP and North faults, the Hinge and Dixie Limb zones and additional new targets across Dixie’s 22 kilometer strike length.
“It’s remarkable to think that when our drilling began two years ago, the Hinge Zone and the multiple zones along the LP Fault were still waiting to be discovered,” Taylor stated. “As we enter 2020, over 80% of the Dixie property remains to be explored. With over $30 million on hand, more and larger drill rigs, and the knowledge weve gained through our ongoing successes, we can now further accelerate that discovery process.”
Disclosure: 1) Doresa Banning compiled this article for Streetwise Reports LLC and provides services to Streetwise Reports as an independent contractor. She or members of her household own securities of the following companies mentioned in the article: None. She or members of her household are paid by the following companies mentioned in this article: None. 2) The following companies mentioned in this article are billboard sponsors of Streetwise Reports: Great Bear. Click here for important disclosures about sponsor fees. 3) Comments and opinions expressed are those of the specific experts and not of Streetwise Reports or its officers. The information provided above is for informational purposes only and is not a recommendation to buy or sell any security. 4) The article does not constitute investment advice. Each reader is encouraged to consult with his or her individual financial professional and any action a reader takes as a result of information presented here is his or her own responsibility. By opening this page, each reader accepts and agrees to Streetwise Reports’ terms of use and full legal disclaimer. This article is not a solicitation for investment. Streetwise Reports does not render general or specific investment advice and the information on Streetwise Reports should not be considered a recommendation to buy or sell any security. Streetwise Reports does not endorse or recommend the business, products, services or securities of any company mentioned on Streetwise Reports. 5) From time to time, Streetwise Reports LLC and its directors, officers, employees or members of their families, as well as persons interviewed for articles and interviews on the site, may have a long or short position in securities mentioned. Directors, officers, employees or members of their immediate families are prohibited from making purchases and/or sales of those securities in the open market or otherwise from the time of the interview or the decision to write an article until three business days after the publication of the interview or article. The foregoing prohibition does not apply to articles that in substance only restate previously published company releases.
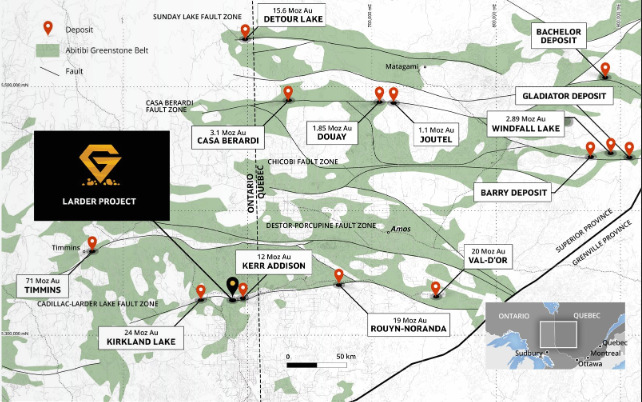
Jay Taylor of J. Taylor’s Gold, Energy & Tech Stocks examines the prospects of a company working in the exploration and development of Larder gold deposits along the Cadillac-Larder Lake Fault in Ontario.
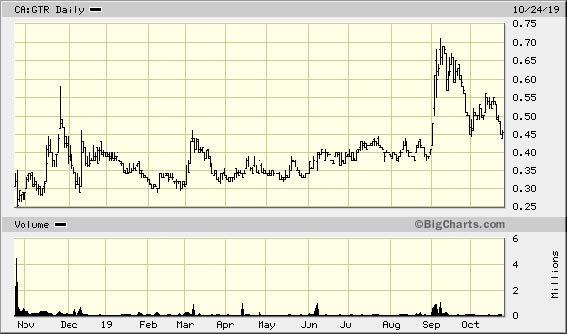
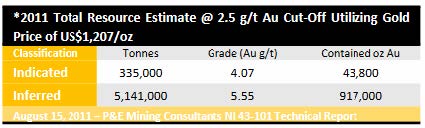
Trades Toronto: GTR US OTC: GATGF Shares Outstanding: 47.5 million Price 10/25/19: US$0.356; 12/5/19 US$0.32 Market Cap: ~US$17 million Cash: ~$4 million Gold Resource (All NI-43-101 Categories): 960,800 ounces (The current gold resource calculation is broken down in the following chart) Progress Rating: A3 Phone: 604-678-5308 Web: Gatlingexploration.com
Mining, like any business, is all about people. For success in the junior exploration business, you obviously need to start with good, competent exploration geologists. Gatling Exploration is strong in that regard, with Dale Ginn leading that task. He and Nav Dhaliwal (the President and CEO) have proven their ability to succeed in the exploration business with a huge amount of success at Bonterra. But few stories covered in this letter have been as disappointing tome as Bonterra. The downturn came after a monetary infusion brought in a merger and management company that not only killed the upside that was to be had thanks to the successful exploration efforts of Ginn and his team, but after a merger with Metanor, the stock dropped like a rock.
But there is good news! The Larder Project located on the Ontario/Quebec border and owned by Bonterra was spun off to shareholders into what is now Gatling Exploration. And the successful Dhaliwal/Ginn team left Bonterra to head up this very promising project located along the prolific Cadillac-Larder Lake Fault in Ontario. By the looks of things, Ginn and Dhaliwal have picked up where they left off with the same kind of success on the Gladiator Gold Discovery as when they were at Bonterra.
As you can see from the map above, the company’s Larder Project is located along the Cadillac-Larder fault zone in prime gold real estate. Along that fault zone, lies the 24-million-ounce Kirkland Lake mine to the west. And just a few kilometers to the east of the Larder mine is the 10.5-million-ounce Kerr Addison gold mine. In fact the gold mineralization on the Larder Project is exactly identical to the Kerr Addison Mine.
By no means is this a new discovery. What management is very sure about is that these various zones that were drilled by different companies in the past are all continuously gold mineralized. Having locked up the area noted above that makes up the Larder Project means that Gatling is free to fill in these gaps. A very important fact is that some 31,000 meters of drilling was carried out in the past by such well-known senior mining firms as Teck and Goldfields. None of that data has been factored into the resource of nearly 1 million ounces, nor have the significant meters of drilling this year been factored into the resource. With success, management has expanded an earlier 10,000-meter drill program this year into a 20,000-meter program and then lastly 35,000 meters of drilling to be completed by year end.
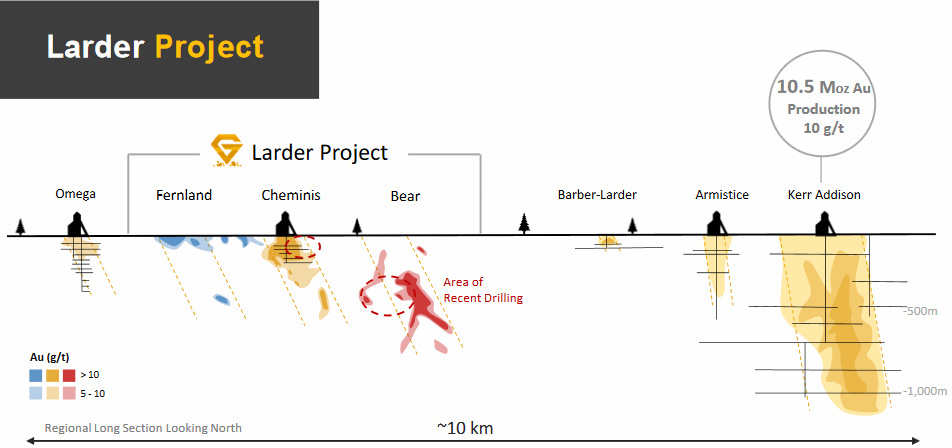
In speaking with Dale Ginn, I’m told that mining widths are very good with a minimum of about 3 meters but can swell out to 40 or more meters. Mineralization is structurally controlled and according to Dale it is relatively easy to identify those structures for drilling. The have been hitting their targets on a high percentage basis. Generally, the narrower widths are of higher grade but with widths like these it would seem mining dilution should be quite low. I’m told the metallurgy is simple and non-refractory and that the two kinds of mineralization at the Kerr Addison Mine (an ultramafic and an altered basalt) are identical on the Fernland, Cheminis, and Bear deposits. The company has two drill rigs working on the Larder Project now with most of the attention currently on the Bear. There has been a considerable amount of underground exploration on the Cheminis, where mineralization starts on surface but the underground workings were used mostly for exploration rather than production. As you can see from the illustration above, the Bear mineralization starts below surface. It is my understanding that the Fernland is a relatively new discovery with mineralization identified right on surface. What is important to keep in mind is that these gold deposits located in the Greenstone Belts of Quebec and Ontario generally run to very considerable depths. The Kerr Addison, for example, ran to a depth of over 1,000 meters. So the bottom line for me here is that the Larder Project has the potential to host many millions of ounces of gold. For obvious cost-related reasons, the attention near term will be along strike more than at depth. Also keep in mind that this is a brownfield project with several hungry mills in the immediate area. Therefore, to my way of thinking, the level of speculative risk for these shares is a lot lower than for many other companies in the junior resource space.
The Kir Vit Target
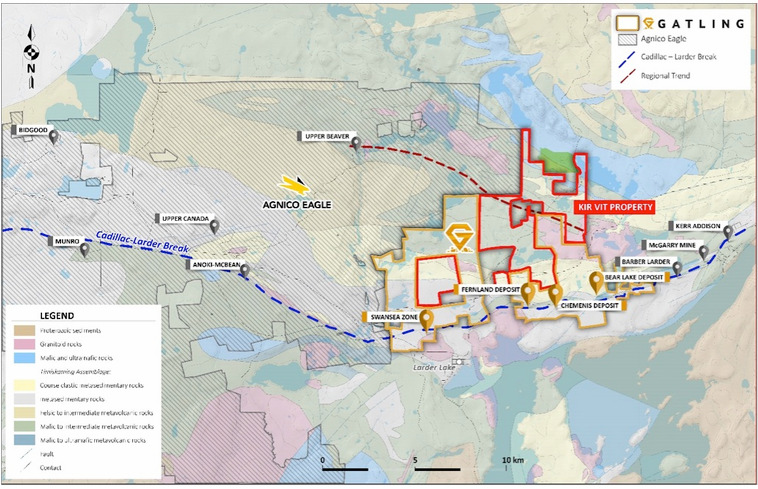
In April of this year, Gatling announced that it expanded its land position by picking up1,274 hectares known as the Kir Vit Claim Package, which is the area within the redlines shown on this map. (The initial Larder claims are within the yellow boundaries.)With this acquisition, the Larder Project as a whole covers a contiguous land position of 3,370 hectares.
The new property hosts several near-surface drill-ready target areas that trend onto proven zones such as Agnico Eagle’s Upper Beaver deposit that has an indicated mineral resource of 1,461,000 ounces gold at 6.62 grams per tonne Au with 56,006,000 pounds copper at 0.37 per cent Cu (6.87 million tonnes) and an inferred resource of712,000 oz Au at 4.85 g/t Au with 32,218,000 lb. Cu at 0.32 per cent Cu (4.57 million t).
The addition of the Kir Vit property opens up new exploration opportunities within intrusion related gold targets and Timiskaming sedimentsgeology that is consistent with hosting gold mineralization similar to the Larder gold project and elsewhere in the region. Also along with the acquisition came Teck’s database of recent exploration activities on the property, including geophysics and surface sampling. That data will be reviewed and compiled for future targeting.
Near surface gold mineralization has been identified with surface sampling completed at new property has returned gold values up to 7.9 g/t Au. Management has identified multiple new drill targets. The acquisition opens new exploration potential in intrusion related gold targets, along trend of the Upper Beaver deposit and geophysics has identified additional potential targets. A 3-D induced polarization survey was completed by Teck in 2017 on the property that identifies a number of targets.
While this project is early exploration and thus early drilling will be much riskier than drilling between known gold-bearing structures between the Bear, Cheminis, and Fernland deposits, a read of management’s August 27 press release discussing exploration plans paints a very exciting picture of the potential for Kir Vit, as the following highlights of early exploration work reveal.
High-grade gold at surface: Gatling’s 2019 surface exploration program has been primarily focused on the Kir Vit zone. The program has collected samples from historical trenches, pits and multiple exposed outcrops. High grade gold has been recovered along the altered volcanic contact with both the syenite intrusion and conglomerate units. Sample values include 7.0 grams per tonne gold and 6.7 g/t Au.
Geological understanding of the Kir Vit: The historical work completed on the property was reportedly well documented and aided in Gatling’s 2019 surface program. From this comprehensive work completed thus far, Gatling has been able to establish that both intrusive-style mineralization and Timiskaming conglomerate mineralization are present at the Kir Vit zone. Proximal to both mineralized trends are altered mafic volcanic rocks that also show indication of late-stage mineralization as well as hydrothermal alteration.
Large hydrothermal footprint: Multiple alteration assemblages have been identified in the field indicating a large hydrothermal footprint. Alteration encountered thus far includes sericite, albite, epidote, silica, hematite and carbonate.
Proximity to existing resources: The Kir Vit zone has displayed multiple similarities to nearby deposits including the porphyry-style mineralization at Agnico Eagle’s Upper Beaver deposit. The current exploration target is approximately 10 kilometers southeast of Agnico Eagle’s Upper Beaver deposit, which has an indicated mineral resource of 1,461,000 ounces of gold at 6.62 grams per tonne Au with 56,006,000 pounds copper at 0.37 per cent Cu (6.87 million tonnes) and an inferred resource of 712,000 ounces Au at 4.85 g/t Au with 32,218,000 pounds of Cu at 0.32 per cent Cu (4.57 million t).
The drilling program is now under way. Gatling is using all of the collected data to help with planning of the current 3,500-meter drill program at what is named the Kir Vit Zone. Initial drilling has exposed heavily altered syenites, altered volcanics, quartz-carbonate breccia patches and multiple lenses of conglomerate. Gatling will provide assay results as they come in, which is expected in a couple of months. Of course we will report in this letter and, as with all news releases for companies we cover, you can find those releases as they are published at www.Miningstocks.com.
Management
Nav Dhaliwal, President and CEO: Mr. Dhaliwal is an experienced executive, leader and team builder. He was the founder and CEO of Bonterra Resources and has a track record of success in the mining sector. Mr. Dhaliwal is particularly adept at nurturing early stage companies through their critical phases of evolution. He also brings valuable business relationships with international analysts, brokers and investment bankers throughout Canada, the United States, Europe and Asia.
Dale Ginn, COO: Dale Ginn Executive Chairman and Director Mr. Ginn is an experienced mining executive and geologist of nearly 30 years. He is the founder of a number of exploration and mining companies and has led and participated in numerous gold and base metal discoveries, many of which are in production today. Mr. Ginn has led or was part of the discovery teams for the Gladiator, Hinge, 007, 777, Trout Lake, and Tartan Lake deposits and received the Quebec Discovery of the Year Golden Hammer award in 2018 for the Gladiator deposit. His experience has included both senior and junior companies such as Goldcorp, Harmony Gold, Hudbay, Westmin, San Gold, Bonterra, Gatling Exploration and others. While specializing in complex, structurally controlled gold deposits, he also has extensive mine operations, development and startup experience.
Nathan Tribble, VP Exploration: Mr. Tribble, P.Geo. (ON) has over 13 years of professional experience in exploration and mining, with a particular focus on gold and base metal exploration and project evaluation. Past experience includes Senior Principal Geologist for Sprott Mining, Senior Geologist for Bonterra Resources, Jerritt Canyon Gold, Kerr Mines, Northern Gold, Lake Shore Gold and Vale Inco. He was also part of the exploration team that discovered the 8.2 million ounce Côté Lake gold deposit for Trelawney Mining and Exploration Inc. Mr. Tribble is registered as a Professional Geoscientist in Ontario and holds a Bachelor of Science degree in Geology from Laurentian University.
Peter Dickie, Director: Mr. Dickie has over 35 years of experience in the public and private corporate environment, with over 25 years spent in management positions. He is the former President, CEO and director of NioCorp Developments Ltd., a company developing the largest super-alloy mineral deposit in North America (niobium, titanium and scandium). During his six years with NioCorp, Mr. Dickie developed key relationships with property owners and all levels of government in the project area, built a team of internationally recognized senior executives, raised tens of millions of dollars and graduated the company to the TSX. During this time, NioCorp’s market capitalization grew from under $5million to over $200 million.
Richard Boulay, Director: Mr. Boulay has over 40 years of experience in the exploration and mining industries in Canada and internationally, including 15 years of mining and infrastructure financing experience gained with Bank of Montreal, Royal Bank of Canada and Bank of Tokyo. He has extensive experience in the management and financing of public companies in Canada and the United States. He is also a Director of Moneta Porcupine and Latin American Minerals Inc.
Jason Billan, Director: Mr. Billan is a seasoned strategy, corporate development and valuation professional with an accelerating career in the mining industry. Following the completion of an MBA at the Richard Ivey School of Business at the University of Western Ontario in 2009, he spent roughly three years in equity research covering the precious metal sector, at Salman Partners and RBC Capital Markets, with a coverage universe ranging from small to large caps. In 2012, he joined Nevsun Resources as the sole Corporate Development professional reporting into the senior executive team. After several years of evaluating hundreds of gold and copper opportunities, Nevsun acquired the world-class Timok copper-gold project in Serbia for over US$500M. Last year, Mr. Billan’s comprehensive skill set in capital markets, valuation, and transaction experience was further strengthened as he evaluated the hostile bid of Nevsun by Lundin Mining and later evaluated numerous strategic alternatives leading to the successful CA$1.9B acquisition of Nevsun by Zijin Mining. Mr. Billan also brings a strong network of corporate and institutional representatives in the mining industry to support Gatling’s objectives.
Peter Damouni, Chairman of the Board: Mr. Damouni has over 17 years of experience in senior executive positions in investment banking and capital markets, with expertise in mining and oil and gas. Throughout his career, Mr.Damouni has worked on and led equity and debt financings valued over $5 billion for companies at different stages from exploration, to development, permitting and construction to production. He has comprehensive experience inequity financing, restructuring and mergers & acquisitions. Mr. Damouni is a graduate of McGill University, Canada. He is a Canadian and British citizen, residing in the United Kingdom.
Carrie Cesaronem, Director: Ms. Cesarone has worked in the public company sector for 30 years. She worked as a paralegal for well-known Vancouver securities lawyers for 11 years and following that, has worked as an independent contractor for both public and private companies for the past 13 years. She has served as a director, Corporate Secretary and CFO for a number of listed companies and continues to serve a Corporate Secretary for Pacton Gold Inc. and BlueBird Battery Metals Inc. Ms. Cesarone holds a Bachelor of Arts degree from Simon Fraser University.
Joseph Meagher CFO and Corporate Secretary: Mr. Meagher became a Chartered Professional Accountant (CPA,CA) in 2008, and obtained the Chartered Director (C. Dir.) designation from The Directors College (a joint venture between McMaster University and The Conference Board of Canada) in 2017. Mr. Meagher currently serves as the Chief Financial Officer and a Director for several publicly listed companies. Previously, Mr. Meagher worked at Smythe CPA as a manager. Mr. Meagher also holds a Bachelor of Commerce from the University of British Columbia.
The Bottom Line
Gatling’s Larder Gold Exploration Project has without a doubt very considerable exploration potential starting with drilling between the Bear, Cheminis, and Fernland deposits. With nearly 1 million high-grade ounces already identified, its not a stretch in my view to anticipate 2 or 3 times those levels at relatively shallow depths between those three known zones. Though it’s at an earlier stage of exploration and hence represents riskier drilling, the Kir Vit Project looks to be an exceptional exploration target. We should be receiving early drill results from that project. Early results could be good but keep in mind deposits are not usually made on early drill holes that serve to educate and guide geologists to drill more perceptively in the next phase of drilling. On the other hand, I believe probability of continued very attractive drill results should be expected along the Cadillac-Larder Break.
Also adding to the attractiveness of this story is the excellent infrastructure of the area in terms of access, water, power, and nearby mills, which could conceivably come in handy in the early stages. With some 31,000 drill hole data not factored into the existing resource plus another 35,000 meters drilled this year, it is not unreasonable to anticipate the nearly 1 million ounces of high-grade gold is likely already much larger. I’m not expecting an updated resource right away. Rather, step-out drilling makes more sense as the extent of mineralization along several kilometers is established. Then will come infill drilling to allow for a resource calculation that as noted above should be a factor of at last 2 to 3 times larger than the existing resource. Last but most important of all, I have confidence in the ability of Nav Dhaliwal and Dale Ginn to carry out the business plan and in this portion of their careers to avoid the kind of destructive relationships in their last experience.
Originally published in J. Taylor’s Gold, Energy & Tech Stocks on October 25, 2019.
As he followed the demolition of the U.S. gold standard and the rapid rise in the national debt, Jay Taylor’s interest in U.S. monetary and fiscal policy grew, particularly as it related to gold. He began publishing North American Gold Mining Stocks in 1981. In 1997, he decided to pursue his avocation as a new full-time careerincluding publication of his weekly J. Taylor’s Gold, Energy & Tech Stocks newsletter. He also has a radio program, “Turning Hard Times Into Good Times.”
Disclosure: 1) Jay Taylor’s disclosures are below. 2) The following companies mentioned in this article are billboard sponsors of Streetwise Reports: Gatling Exploration. Click here for important disclosures about sponsor fees. 3) Statements and opinions expressed are the opinions of the author and not of Streetwise Reports or its officers. The author is wholly responsible for the validity of the statements. The author was not paid by Streetwise Reports for this article. Streetwise Reports was not paid by the author to publish or syndicate this article. The information provided above is for informational purposes only and is not a recommendation to buy or sell any security. Streetwise Reports requires contributing authors to disclose any shareholdings in, or economic relationships with, companies that they write about. Streetwise Reports relies upon the authors to accurately provide this information and Streetwise Reports has no means of verifying its accuracy. 4) This article does not constitute investment advice. Each reader is encouraged to consult with his or her individual financial professional and any action a reader takes as a result of information presented here is his or her own responsibility. By opening this page, each reader accepts and agrees to Streetwise Reports’ terms of use and full legal disclaimer. This article is not a solicitation for investment. Streetwise Reports does not render general or specific investment advice and the information on Streetwise Reports should not be considered a recommendation to buy or sell any security. Streetwise Reports does not endorse or recommend the business, products, services or securities of any company mentioned on Streetwise Reports. 5) From time to time, Streetwise Reports LLC and its directors, officers, employees or members of their families, as well as persons interviewed for articles and interviews on the site, may have a long or short position in securities mentioned. Directors, officers, employees or members of their immediate families are prohibited from making purchases and/or sales of those securities in the open market or otherwise from the time of the interview or the decision to write an article until three business days after the publication of the interview or article. The foregoing prohibition does not apply to articles that in substance only restate previously published company releases.
Charts and graphics provided by the author.
Jay Taylor’s Disclosures: J Taylor’s Gold, Energy & Tech Stocks (JTGETS), is published monthly as a copyright publication of Taylor Hard Money Advisors, Inc. (THMA), Tel.: (718) 457-1426. Website: www.miningstocks.com. THMA provides investment ideas solely on a paid subscription basis. Companies are selected for presentation in JTGETS strictly on their merits as perceived by THMA. No fee is charged to the company for inclusion. The currency used in this publication is the U.S. dollar unless otherwise noted. The material contained herein is solely for information purposes. Readers are encouraged to conduct their own research and due diligence, and/or obtain professional advice. The information contained herein is based on sources, which the publisher believes to be reliable, but is not guaranteed to be accurate, and does not purport to be a complete statement or summary of the available information. Any opinions expressed are subject to change without notice. The editor, his family and associates and THMA are not responsible for errors or omissions. They may from time to time have a position in the securities of the companies mentioned herein. No statement or expression of any opinions contained in this report constitutes an offer to buy or sell the shares of the company mentioned above. Under copyright law, and upon their request companies mentioned in JTGETS, from time to time pay THMA a fee of $250 to $500 per page for the right to reprint articles that are otherwise restricted solely for the benefit of paid subscribers to JTGETS.
To subscribe to J Taylors Gold, Energy & Tech Stocks Visit: https://www.miningstocks.com/select/gold. Receive J Taylors Gold, Energy & Tech Stocks monthly newsletter and weekly e-mail messages for the period of your choice (U.S. and Canada). For foreign postal delivery contact us at e-mail below. Return to: 6003 72nd St., Maspeth, NY 11378, USA. Phone or Fax: 718-457-1426; e-mail: [email protected].
The rationale for investing in this company is provided in a Pareto Securities report.
In a Dec. 2 research note, analyst Tom Erik Kristiansen reported that Pareto Securities initiated coverage on Quantafuel SA (QFUEL:NO) with a Buy rating and a NOK250 per share target price that “upon proof of commerciality could more than double over the next year.” Further, Quantafuel is “likely to add additional projects to its portfolio that leads to an even larger long-term upside potential.” The current share price is NOK165.
Kristiansen highlighted that Quantafuel is “well positioned to benefit from its potential first mover advantage in a large, underserved chemical recycling market.” Also, it has a scalable business model and a well-defined plan to facilitate growth near term.
The company produces high-quality synthetic fuels and chemical products, such as low-carbon diesel, naphtha and heating oil, from nonrecyclable plastic waste through a proprietary chemical process. This affords the business an attractive environmental social governance profile.
The next major catalyst for Quantafuel, scheduled to occur shortly, by year-end 2019, is the launch of commercial production at its plant in Skive, Denmark, Kristiansen relayed. “If successful, Quantafuel will have the first, large-scale commercial plant for chemical recycling of plastic waste in the world,” he added.
It also will then, with its partners, look to expand in the short term, building two more facilities, each with a capacity of 300 million tons per day, likely in Antwerp and Bayern. Quantafuel already has plans to triple the capacity of the Skive plant to 180 million tons per day.
The renewable energy company has partly derisked production ramp-up by engaging strong partners, in Vitol, a large oil trader, and BASF, a chemical producer, Kristiansen indicated. Together, both companies invested US$25 million in Quantafuel. Having these partners also validates the potential of the company’s technology.
Kristiansen noted that at current prices, Quantafuel’s products are estimated to generate, through its processes at new large-scale plants, an unleveraged internal rate of return of 30%-plus.
Many view Quantafuel’s technology as “the future solution as it will enable larger volumes to be turned into high quality products,” the analyst pointed out, referring to the problem of unrecyclable plastics, production of which is projected to double by 2050. Additionally, recycling capacity in Europe will have to double by 2025 to meet current mandates. The need for a remedy is compounded by China’s ban on plastic imports in 2018, which “implies that about 19 million containers of plastic waste will need to find a new home over the next decade.”
With three plants operating, Quantafuel could process about “3% of the additional need caused by the China ban alone, highlighting the industry and Quantafuel’s high growth potential,” wrote Kristiansen.
To maximize the potential benefit from first mover advantage, Quantafuel is taking steps to standardize its production concept. “This may also make it an attractive acquisition candidate as some of world’s largest petrochemical companies, refiners and oil majors today are targeting this market,” Kristiansen added.
Disclosure: 1) Doresa Banning compiled this article for Streetwise Reports LLC and provides services to Streetwise Reports as an independent contractor. She or members of her household own securities of the following companies mentioned in the article: None. She or members of her household are paid by the following companies mentioned in this article: None. 2) The following companies mentioned in this article are billboard sponsors of Streetwise Reports: None. Click here for important disclosures about sponsor fees. 3) Comments and opinions expressed are those of the specific experts and not of Streetwise Reports or its officers. The information provided above is for informational purposes only and is not a recommendation to buy or sell any security. 4) The article does not constitute investment advice. Each reader is encouraged to consult with his or her individual financial professional and any action a reader takes as a result of information presented here is his or her own responsibility. By opening this page, each reader accepts and agrees to Streetwise Reports’ terms of use and full legal disclaimer. This article is not a solicitation for investment. Streetwise Reports does not render general or specific investment advice and the information on Streetwise Reports should not be considered a recommendation to buy or sell any security. Streetwise Reports does not endorse or recommend the business, products, services or securities of any company mentioned on Streetwise Reports. 5) From time to time, Streetwise Reports LLC and its directors, officers, employees or members of their families, as well as persons interviewed for articles and interviews on the site, may have a long or short position in securities mentioned. Directors, officers, employees or members of their immediate families are prohibited from making purchases and/or sales of those securities in the open market or otherwise from the time of the interview or the decision to write an article until three business days after the publication of the interview or article. The foregoing prohibition does not apply to articles that in substance only restate previously published company releases.
Disclosures from Pareto Securities AS, Quantafuel, December 2, 2019
This publication or report has been prepared solely by Pareto Securities Research.
Opinions or suggestions from Pareto Securities Research may deviate from recommendations or opinions presented by other departments or companies in the Pareto Securities Group. The reason may typically be the result of differing time horizons, methodologies, contexts or other factors.
Analysts Certification The research analyst(s) whose name(s) appear on research reports prepared by Pareto Securities Research certify that: (i) all of the views expressed in the research report accurately reflect their personal views about the subject security or issuer, and (ii) no part of the research analysts compensation was, is, or will be directly or indirectly related to the specific recommendations or views expressed by the research analysts in research reports that are prepared by Pareto Securities Research.
The research analysts whose names appears on research reports prepared by Pareto Securities Research received compensation that is based upon various factors including Pareto Securities total revenues, a portion of which are generated by Pareto Securities investment banking activities.
Conflicts of interest
Companies in the Pareto Securities Group, affiliates or staff of companies in the Pareto Securities Group, may perform services for, solicit business from, make a market in, hold long or short positions in, or otherwise be interested in the investments (including derivatives) of any company mentioned in the publication or report.
In addition Pareto Securities Group, or affiliates, may from time to time have a broking, advisory or other relationship with a company which is the subject of or referred to in the relevant Research, including acting as that companys official or sponsoring broker and providing corporate finance or other financial services. It is the policy of Pareto to seek to act as corporate adviser or broker to some of the companies which are covered by Pareto Securities Research. Accordingly companies covered in any Research may be the subject of marketing initiatives by the Corporate Finance Department.
To limit possible conflicts of interest and counter the abuse of inside knowledge, the analysts of Pareto Securities Research are subject to internal rules on sound ethical conduct, the management of inside information, handling of unpublished research material, contact with other units of the Group Companies and personal account dealing. The internal rules have been prepared in accordance with applicable legislation and relevant industry standards. The object of the internal rules is for example to ensure that no analyst will abuse or cause others to abuse confidential information. It is the policy of Pareto Securities Research that no link exists between revenues from capital markets activities and individual analyst remuneration. The Group Companies are members of national stockbrokers associations in each of the countries in which the Group Companies have their head offices. Internal rules have been developed in accordance with recommendations issued by the stockbrokers associations.
This material has been prepared following the Pareto Securities Conflict of Interest Policy. The guidelines in the policy include rules and measures aimed at achieving a sufficient degree of independence between various departments, business areas and sub-business areas within the Pareto Securities Group in order to, as far as possible, avoid conflicts of interest from arising between such departments, business areas and sub-business areas as well as their customers. One purpose of such measures is to restrict the flow of information between certain business areas and sub-business areas within the Pareto Securities Group, where conflicts of interest may arise and to safeguard the impartialness of the employees. For example, the Corporate Finance departments and certain other departments included in the Pareto Securities Group are surrounded by arrangements, so-called Chinese Walls, to restrict the flows of sensitive information from such departments. The internal guidelines also include, without limitation, rules aimed at securing the impartialness of, e.g., analysts working in the Pareto Securities Research departments, restrictions with regard to the remuneration paid to such analysts, requirements with respect to the independence of analysts from other departments within the Pareto Securities Group rules concerning contacts with covered companies and rules concerning personal account trading carried out by analysts.
This week – December 8 through December 14 – central banks from 20 countries or jurisdictions are scheduled to decide on monetary policy: Kazakhstan, Kyrgyz Republic, Iceland, Georgia, Armenia, Moldova, United States, Brazil, Fiji, Philippines, Switzerland, Serbia, Turkey, Ukraine, Euro area, Mozambique, Peru, Russia, Uganda and Azerbaijan.
Following table includes the name of the country, the date of the next policy decision, the current policy rate, the result of the last policy decision, the change in the policy rate year to date, and the rate one year ago.
The table is updated when the latest decisions are announced and can always accessed by clicking on This Week.