Imagin Medical Poised for Breakout with Bladder Cancer Detection Device

By The Life Science Report

Source: Knox Henderson for Streetwise Reports   12/06/2019

A new advancement in bladder-related endoscopic surgery is endorsed and de-risked.

You don’t often hear about it, but bladder cancer is the sixth most common cancer in the U.S., with approximately 80,000 new cases reported every year, and some 600,000 Americans living in fear of recurrence. Bladder cancer is also the most expensive cancer to treat due to the more that 50% recurrence rate and the need for life-long surveillance to the tune of $4 billion per year spent in the U.S. alone.

Marching ever closer to taking a giant slice of that market is Vancouver/Boston-based Imagin Medical Inc. (IME:CSE; IMEXF:OTCQB). The company has made a significant new advancement in one of the mission-critical procedures used in urological surgery, that will enable physicians to clearly more clearly visualize cancerous tumors during endoscopic procedures, receiving overwhelmingly positive feedback from leading members of the American Urological Association. Recently its i/Blue product entered the verificatoin stage of the medical device design control process.

“Imagin Medical stock is great value here with the potential to make big percentage gains from the current very low price.” – Clive Maund

With that kind of response, this CSE/OTCQB-listed company, with a market cap of a little over $7 million, has huge catalysts ahead and is poised for a significant breakout. What kind of catalysts? The product is defined, doctors like it and the company is in the final six months of development. “Imagin has all the component parts to put together a functional product, and we will have verifiable units available by year-end,” stated Jim Hutchens, Imagin’s CEO.

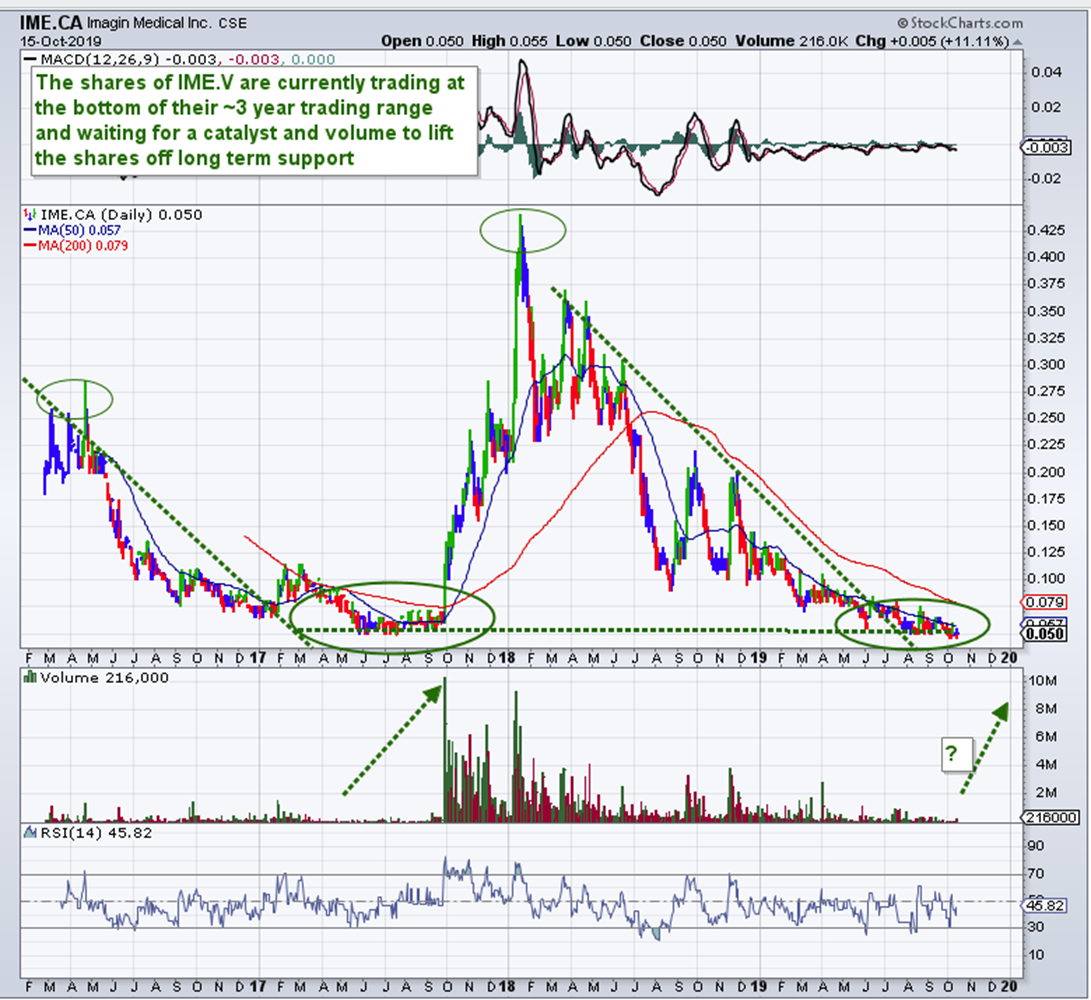
Take note: Since Imagin’s last financing of CA$3.9 million in April of 2018 at CA$0.22, its shares have been battered down to CA$0.05 by impatient investors. At this juncture, there is strong support at CA$0.05 for returning to the CA$0.22 level with room to move to the ceiling set by the related warrants at CA$0.38 due April 2020. Post-FDA approval levels should run well beyond the dollar ranges.

The company has caught the attention of investment analysts. Technical analyst Clive Maund wrote on November 8, “Whilst we cannot be 100% sure that the company’s key product will gain final approval, which is why the stock price is at a very low level, the signs are that it will and it is well along the road to getting it. So this look like an excellent point to accumulate the stock—even better than when we last looked at it.”

In September, when Imagin’s stock was trading at CA$0.06, Maund wrote, “Imagin Medical stock is great value here with the potential to make big percentage gains from the current very low price.”

To Chris Temple, editor and publisher of the National Investor, who gave the company a strong “Buy” in 2018, the global market is enormous: “I’m sure you won’t be surprised to learn that, globally, nearly $50 billion a year is spent on endoscopic procedures. This is not always to treat maladies or to eradicate cancerous tissue, but sometimes to just confirm that further medical attention is not needed.” He adds, “If successful here—Imagin may well be poised to disrupt the market.”

Doctors have jumped on the bandwagon. In an oversubscribed financing last year, investors included Dr. Stan Swierzewski, Chief of Surgery and Director of Urology at Holyoke Medical Center in Massachusetts, and Dr. Roger Buckley, Division Head of Urology at North York General Hospital in Toronto.

Upon making his investment in IME, Dr. Swierzewski publicly stated, “As a practicing urologist, I invested in Imagin because I have a duty and responsibility to advance any improvements in treatment and technology that will benefit my patients and save lives. Current technology is cumbersome and time consuming … making it less effective as a screening or follow-up tool. Bladder cancer patients are basically monitored for life with in-office cystoscopies, which are not effective in differentiating between inflammation and cancer. To be safe, we perform surgery on many patients which often turns out to be negative. Imagin’s i/Blue technology, given its potential speed and sensitivity, will help us assess the patient’s condition more quickly and accurately and avoid unnecessary surgery. It will also make necessary surgery more successful, ultimately saving lives and reducing medical expenses. I’m confident that using the i/Blue system will become the standard of care. . .I cannot wait to use this technology in treating my bladder cancer patients.”

Imagin has already met key milestones as reported with its Q3 financials, which included a $659,836 spend on R&D. Pay attention the second bullet!

  • In April, 2019, Imagin reached a major product development milestone with completion of the i/Blue imaging system’s initial functional unit.
  • At the American Urological Association’s annual meeting, held in May in Chicago, Imagin held private focus groups, where leading urologists assessed the initial functional product and provided overwhelmingly positive feedback that was used to finalize the i/Blue product’s user needs.
  • In July, 2019, Imagin reported that it had moved to step five of the seven-step development process that the FDA defines in its design control guidance for medical device manufacturers: (1) user needs; (2) design input; (3) design process; (4) design output; (5) design verification; (6) device realization; and finally, (7) device validation.
  • Imagin has met with the FDA on two occasions to discuss the i/Blue Imaging System’s regulatory path and is using the content and feedback from these meetings to refine its strategy. Imagin will continue to meet with the FDA until it submits its official application for approval.

With this kind of momentum, Imagin is planning to initiate the commercialization of the i/Blue Imaging system during late 2020. Keep in mind the technology is also relevant for other cancer treatments, so there is more “‘blue sky”‘ upside in store. Once commercially available for urological indications, Imagin plans to expand its product platform to laparoscopic (abdominal) colorectal, thoracic and other medical procedures.

Trading on the Canadian Securities Exchange (CSE:IME) and listed on the OTCQB (IMEXF), IME has about 140 million shares out currently trading at around CA$0.05 for a market capitalization of about CA$7 million. Around 18 million warrants are out at CA$0.38 and with 10.8 million options (weighted average CA$0.29), while insiders hold about 6.31% of the company. Cash on hand is $3.4 million as of June 30. CEO Jim Hutchens says the company will require additional financing to see it through to FDA approvals and, once approved, the company anticipates fast ramp-up of revenues, marching toward positive EBITDA after 18 months post commercialization.

A quick glance at the three-year IME.C chart shows that technically this stock, now at CA$0.05 has hit a historical support level and is just waiting for a catalyst … refer back to bullet #2 above!

Keep in mind, Imagin’s i/Blue Imaging System is pairing up with two elements that are already FDA approved: the endoscope, which has been around forever, and fluorescing agents that have been approved since 2010. Imagin is not reinventing the wheel, it’s consolidating the instrumentation with advanced optics.

While full FDA approval for Imagin’s i/Blue system is advancing forward, it is important to understand bladder cancer surgery using blue-light endoscopes is a technique that is already FDA approved, as is the contrast agent used to fluoresce, to illuminate, the cancer. IME’s patented advanced optical designis tweaking the procedure, using its state-of-the art components to greatly improve the existing technology and significantly reduce the cost with its groundbreaking method.

So let’s talk about that method.

In typical white-light endoscopy, a small camera is mounted on an endoscope, which enters the body and projects images onto a monitor of the bladder and any tumors that protrude above the wall that the surgeon evaluates for possible removal.

However, the challenge of using white light is that a surgeon cannot easily differentiate flat or tiny malignant and premalignant tumors from normal tissue or see the borders/margins of the tumor. Consequently, some cancer cells may remain behind undetected, contributing to the more than 50% recurrence rate in bladder cancer.

The remedy has been to use a “blue” light in conjunction with fluorescing imaging agents. The agents are absorbed by the cancerous cells in the bladder. When exposed to blue light, they fluoresce, improving the surgeons’ ability to detect flat cancers and visualize the margin for removal.

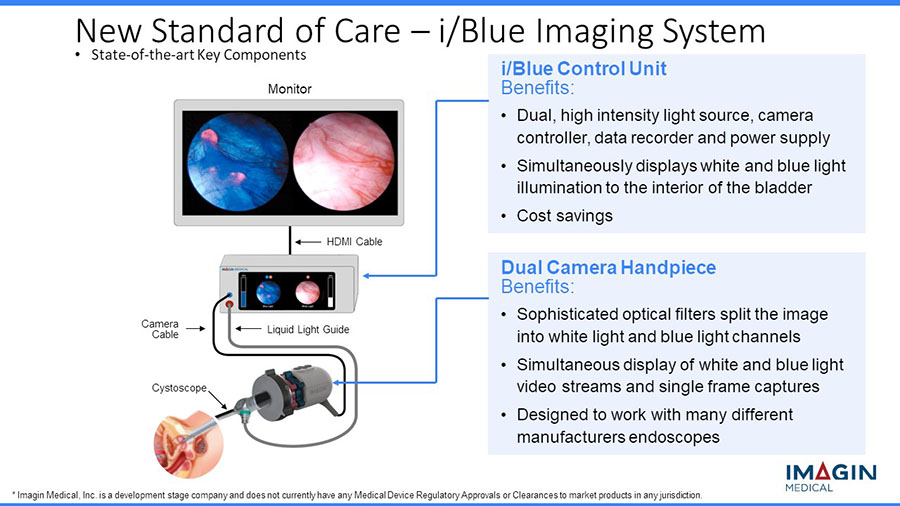
Surgeons still need to see both white- and blue-light images during surgery because the white light image shows the full landscape of the bladder but doesn’t highlight the cancer, and the blue light shows the cancer but doesn’t show exactly where it is, so the surgeon loses orientation. In addition, the current blue-light technology gives the surgeons only one image at a time on the monitor, so surgeons have to switch back and forth between the two and compare them from memory to remove the cancer. Imagin’s i/Blue Imaging System addresses this problem because it shows both images on the monitor at the same time, side-by-side, and in real time. So now, the surgeon won’t have to switch back and forth and rely on memory to locate and remove the cancer. The procedure has the potential to dramatically reduce bladder cancer recurrence rates.

Today, there is only one company that offers blue-light cystoscopy, and its system can only be used with its proprietary endoscopes. For this reason, as well the system’s expensive price tag, blue-light cystoscopy, although the recommended treatment for Non-Muscle Invasive Bladder Cancer (NMIBC) by the American Urological Association (AUA), has not become the norm, or even available in all major cities in the U.S.

The i/Blue System, however, can be used with almost any endoscope on the market, making it more accessible, while dramatically increasing the size of the market and is less expensive, reducing cost to the healthcare system.

Another groundbreaking aspect of Imagin’s technology is the consolidation of instrumentation. The current blue-light method, which needs a system tower that houses multiple units, including the light source, camera control unit and the video data recorder, is purchased as a “bundle” and, depending on accessories, can cost well over $100,000. The i/Blue system, on the other hand, using state-of-the-art technology, combines the three modules into one device, taking up a much smaller footprint, and offering a much lower price tag.

Imagin currently has three issued patents with additional patents pending.

Imagin Medical

Imagin his helmed by an experienced management team, with direct medical device experience moving products from concept through development to commercialization, including managing the FDA process. One of its medical advisors, Dr. Ashish Kamat, Endowed Professor of Urologic Oncology and Cancer Research at University of Texas MD Anderson Cancer Center, has been named by Expertscape as the world’s top-rated expert in urinary bladder neoplasms.

Like all medical device companies, Imagin’s fate rides on FDA approvals, but given team’s deep experience in this market, a proven concept utilizing instruments and agents already approved by the FDA and a glowing endorsement by leading members of the AUA, this is an advancement that likely could—and for the sake of bladder cancer patients, really should—move forward.

Knox Henderson is a journalist and capital markets communications consultant. He has advised for a broad range of small cap companies in the resource, life sciences and technology sectors for more than 25 years.

Sign up for our FREE newsletter at: www.streetwisereports.com/get-news

Disclosure:
1) Knox Henderson: I, or members of my immediate household or family, do not own shares of the following companies mentioned in this article: None. I personally am, or members of my immediate household or family are, paid by the following companies mentioned in this article: Imagin Medical. My company has a financial relationship with the following companies mentioned in this article: None. I determined which companies would be included in this article based on my research and understanding of the sector.
2) The following companies mentioned in this article are billboard sponsors of Streetwise Reports: Imagin Medical. Click here for important disclosures about sponsor fees. As of the date of this article, an affiliate of Streetwise Reports has a consulting relationship with Imagin Medical. Please click here for more information.
An affiliate of Streetwise Reports is conducting a digital media marketing campaign for this article on behalf of Imagin Medical. Please click here for more information. The information provided above is for informational purposes only and is not a recommendation to buy or sell any security.
3) Statements and opinions expressed are the opinions of the author and not of Streetwise Reports or its officers. The author is wholly responsible for the validity of the statements. The author was not paid by Streetwise Reports for this article. Streetwise Reports was not paid by the author to publish or syndicate this article. Streetwise Reports requires contributing authors to disclose any shareholdings in, or economic relationships with, companies that they write about. Streetwise Reports relies upon the authors to accurately provide this information and Streetwise Reports has no means of verifying its accuracy.
4) This article does not constitute investment advice. Each reader is encouraged to consult with his or her individual financial professional and any action a reader takes as a result of information presented here is his or her own responsibility. By opening this page, each reader accepts and agrees to Streetwise Reports’ terms of use and full legal disclaimer. This article is not a solicitation for investment. Streetwise Reports does not render general or specific investment advice and the information on Streetwise Reports should not be considered a recommendation to buy or sell any security. Streetwise Reports does not endorse or recommend the business, products, services or securities of any company mentioned on Streetwise Reports.
5) From time to time, Streetwise Reports and its directors, officers, employees or members of their families, as well as persons interviewed for articles and interviews on the site, may have a long or short position in securities mentioned. Directors, officers, employees or members of their immediate families are prohibited from making purchases and/or sales of those securities in the open market or otherwise from the time of the interview or the decision to write an article until three business days after the publication of the interview or article. The foregoing prohibition does not apply to articles that in substance only restate previously published company releases. As of the date of this article, officers and/or employees of Streetwise Reports LLC (including members of their household) own securities of Imagin Medical, a company mentioned in this article.

Additional Disclosures

Clive Maund does not own shares of Imagin Medical and neither he nor his company has been paid by Imagin Medical.

National Investor: The Editor may have positions in some securities discussed. Subscribers are encouraged to investigate any situation or recommendation further before investing. The Editor receives no undisclosed kickbacks, fees, commissions, gratuities, honoraria or other emoluments from any companies, brokers or vendors discussed herein in exchange for his recommendation of them. None of the content of this newsletter is to be considered as an offer to sell or a solicitation of an offer to buy any security.

( Companies Mentioned: IME:CSE; IMEXF:OTCQB,
)

Aurinia Pharma Shares Open 100% Higher on Phase 3 Lupus Data

By The Life Science Report

Source: Streetwise Reports   12/05/2019

Shares of Aurinia Pharmaceuticals traded much higher today after it reported positive results from its Phase 3 AURORA trial of Voclosporin for treatment of lupus nephritis. The company plans to submit a New Drug Application to the FDA in H1/20.

Yesterday afternoon, Victoria, B.C.-based late-stage clinical biopharmaceutical company Aurinia Pharmaceuticals Inc. (AUPH:NASDAQ; AUP:TSX), which is focused on advancing voclosporin across multiple inflammatory and autoimmune conditions, announced “positive efficacy and safety results from its pivotal AURORA Phase 3 trial of voclosporin, in combination with mycophenolate mofetil (MMF) and low-dose corticosteroids, in the treatment of lupus nephritis (LN).”

The firm indicated that the Phase 3 AURORA clinical trial is a global, randomized, double-blind study of 357 LN patients in 27 countries to evaluate whether voclosporin when added to background therapy of MMF/CellCept can increase the speed and overall renal response rates in the presence of low dose steroids. Aurinia stated that in the trial, it succeeded in reaching its primary endpoint of renal response rates for voclosporin compared to the control group. The company further advised that voclosporin was well tolerated with no unexpected safety signals and that all pre-specified secondary endpoints achieved statistical significance in favor of voclosporin.

Aurinia claims that voclosporin is an investigational immunosuppressant drug, and is a novel and potentially best-in-class calcineurin inhibitor with clinical data in over 2,600 patients across indications. The company noted that voclosporin was granted Fast Track designation by the FDA in 2016 and that the company plans to submit an NDA to the FDA in H2/20.

The company’s Chief Medical Officer Neil Solomons, M.D., commented, “This extraordinary pivotal data confirms voclosporin’s ability to achieve statistically significant improvements in clinically meaningful endpoints for this complex disease, with a comparable safety profile to the current standard of care…This data represents a significant advance for people living with LN, which can lead to irreversible kidney damage, eventual kidney failure and death.”

Brad Rovin, MD, FASN, chief of the Division of Nephrology and medical director of the Clinical Trials Management Organization at The Ohio State University Wexner Medical Center, added, “These data represent a potential game changer for patients suffering from this debilitating disease…This confirmatory Phase 3 result represents a clinically meaningful leap forward in the treatment of lupus nephritis. Importantly, the data indicate no excess of adverse events in the voclosporin group compared to patients managed with standard of care alone.”

Aurinia’s President and CEO Peter Greenleaf remarked, “We are thrilled with the outcomes reported today from the AURORA trial, which unequivocally demonstrate the tremendous potential for voclosporin to play an important role in the treatment of the approximately one million people worldwide living with LN…We are aware of the intense need for a clinically impactful therapy for this serious disease and are working with urgency to complete regulatory filings in the U.S. and worldwide. If approved, we look forward to potentially making voclosporin available to patients beginning in 2021.”

Stevan W. Gibson, president and CEO of the Lupus Foundation of America added, “The treatment of lupus nephritis has been extremely challenging to date, and people with lupus are in need of innovative treatments for this serious disease…Voclosporin is the first novel treatment that has demonstrated therapeutic efficacy for people living with lupus nephritis and today marks an important advance in the treatment of this potentially life-threatening disease.”

The company explains in the report that “LN is an inflammation of the kidney caused by Systemic Lupus Erythematosus…In patients with LN, renal damage results in proteinuria and/or hematuria and a decrease in renal function.” LN can lead to permanent and irreversible tissue damage within the kidney, resulting in end-stage renal disease.

Aurinia Pharmaceuticals, headquartered in Victoria, British Columbia, is a late clinical-stage biopharmaceutical company focused on developing and commercializing therapies to treat patients in the fields of nephrology and autoimmunity. The company is currently developing voclosporin, an investigational drug, for the treatment of lupus nephritis, focal segmental glomerulosclerosis and dry eye syndrome.

Aurinia Pharmaceuticals started off the day with a market capitalization of approximately $791.1 million with about 94.28 million shares outstanding and around a 10.1% short interest. AUPH shares opened nearly 100% higher today at US$16.70 (+$8.31, +99.05%) over yesterday’s $8.39 closing price. The stock established a new 52-week high price of US$17.48 this morning. The firm’s shares have traded today on higher than average volume between US$14.75 and US$17.48 per share and are currently trading at US$16.04 (+$7.61, +90.95%).

Sign up for our FREE newsletter at: www.streetwisereports.com/get-news

Disclosure:
1) Stephen Hytha compiled this article for Streetwise Reports LLC and provides services to Streetwise Reports as an independent contractor. He or members of his household own securities of the following companies mentioned in the article: None. He or members of his household are paid by the following companies mentioned in this article: None.
2) The following companies mentioned in this article are billboard sponsors of Streetwise Reports: None. Click here for important disclosures about sponsor fees.
3) Comments and opinions expressed are those of the specific experts and not of Streetwise Reports or its officers. The information provided above is for informational purposes only and is not a recommendation to buy or sell any security.
4) The article does not constitute investment advice. Each reader is encouraged to consult with his or her individual financial professional and any action a reader takes as a result of information presented here is his or her own responsibility. By opening this page, each reader accepts and agrees to Streetwise Reports’ terms of use and full legal disclaimer. This article is not a solicitation for investment. Streetwise Reports does not render general or specific investment advice and the information on Streetwise Reports should not be considered a recommendation to buy or sell any security. Streetwise Reports does not endorse or recommend the business, products, services or securities of any company mentioned on Streetwise Reports.
5) From time to time, Streetwise Reports LLC and its directors, officers, employees or members of their families, as well as persons interviewed for articles and interviews on the site, may have a long or short position in securities mentioned. Directors, officers, employees or members of their immediate families are prohibited from making purchases and/or sales of those securities in the open market or otherwise from the time of the interview or the decision to write an article until three business days after the publication of the interview or article. The foregoing prohibition does not apply to articles that in substance only restate previously published company releases.
6) This article does not constitute medical advice. Officers, employees and contributors to Streetwise Reports are not licensed medical professionals. Readers should always contact their healthcare professionals for medical advice.

COT Speculators drop USD bets for 9th week. Gold bets rise to 10-week high

By CountingPips.comReceive our weekly COT Reports by Email


Here are the latest links to our coverage of the Commitment of Traders data changes.


Currency Speculators trim US Dollar Index bets for 9th week. AUD & NZD bets rise

Large currency speculators cut back on their net positions in the US Dollar Index futures markets this week, according to the latest Commitment of Traders (COT) data released by the Commodity Futures Trading Commission (CFTC) on Friday. See full article.


WTI Crude Oil Speculators sharply dropped their bullish bets after strong run up

The large speculator contracts of WTI crude futures totaled a net position of 428,035 contracts, according to the latest data this week. This was a change of -42,901 contracts from the previous weekly total. See full article.


10-Year Note Speculators raised their bearish bets to 11-week high

Large speculator contracts of the 10-Year Bond futures totaled a net position of -221,895 contracts, according to the latest data this week. This was a change of -76,150 contracts from the previous weekly total. See full article.


Gold Speculators lifted their bullish bets to highest in 10 weeks

Large precious metals speculator contracts of the Gold futures totaled a net position of 290,705 contracts, according to the latest data this week. This was a change of 19,071 contracts from the previous weekly total. See full article


VIX Speculators cut bearish bets for a 2nd week after record high

Large stock market volatility speculator contracts of the VIX futures totaled a net position of -199,312 contracts, according to the latest data this week. This was a change of 11,387 contracts from the previous weekly total. See full article.


Silver Speculators cut back on their bullish bets for 1st time in 3 weeks

Large precious metals speculator contracts of the silver futures totaled a net position of 50,227 contracts, according to the latest data this week. This was a change of -2,283 contracts from the previous weekly total. See full article.


Copper Speculators slightly reduced their bearish bets this week

Metals speculator contracts of the copper futures totaled a net position of -37,707 contracts, according to the latest data this week. This was a change of 855 contracts from the previous weekly total. See full article.


Article By CountingPips.comReceive our weekly COT Reports by Email

*COT Report: The COT data, released weekly to the public each Friday, is updated through the most recent Tuesday (data is 3 days old) and shows a quick view of how large speculators or non-commercials (for-profit traders) were positioned in the futures markets.

The CFTC categorizes trader positions according to commercial hedgers (traders who use futures contracts for hedging as part of the business), non-commercials (large traders who speculate to realize trading profits) and nonreportable traders (usually small traders/speculators).

Find CFTC criteria here: (http://www.cftc.gov/MarketReports/CommitmentsofTraders/ExplanatoryNotes/index.htm).


Currency Speculators trim US Dollar Index bets for 9th week. AUD & NZD bets rise

December 7th – By CountingPips.comReceive our weekly COT Reports by Email

US Dollar Index Speculator Positions

Large currency speculators continued to lower their bullish net positions in the US Dollar Index futures markets once again this week, according to the latest Commitment of Traders (COT) data released by the Commodity Futures Trading Commission (CFTC) on Friday.

The non-commercial futures contracts of US Dollar Index futures, traded by large speculators and hedge funds, totaled a net position of 23,877 contracts in the data reported through Tuesday December 3rd. This was a weekly lowering of -261 contracts from the previous week which had a total of 24,138 net contracts.

This week’s net position was the result of the gross bullish position (longs) gaining by 1,949 contracts (to a weekly total of 31,182 contracts) compared to the gross bearish position (shorts) which saw an advance by 2,210 contracts on the week (to a total of 7,305 contracts).

US Dollar Index bets continued their downfall this week as positions have declined for nine weeks in a row and by a total of -19,151 contracts over that time. The dollar index positioning, despite the recent declines, remains bullish and has continued to stayed above the +20,000 net contract level for seventy-seven consecutive weeks.


Individual Currencies Data this week:

Overall, the major currencies that saw improving speculator positions this week were the British pound sterling (6,526 contracts), Canadian dollar (1,127 contracts), Australian dollar (8,922 contracts) and the New Zealand dollar (8,834 contracts).

The currencies whose speculative bets declined this week were the US dollar index (-261 weekly change in contracts), euro (-7,633 weekly change in contracts), Japanese yen (-8,232 contracts), Swiss franc (-1,312 contracts) and the Mexican peso (-5,522 contracts).

Notables:

New Zealand dollar positions improved this week by over +8,000 contracts and have seen less bearish levels in four out of the past five weeks. The current level of NZD positions remains bearish at -26,992 contracts but is down from the record bearish position of -42,474 contracts that was recorded on October 1st.

Australian dollar positions also improved this week by over +8,000 contracts and have seen better positioning in the past two weeks. AUD contracts still remain in bearish levels but bearish bets have declined to -36,433 contracts this week after spending thirty-five straight weeks above the -40,000 net contract level from March 5th to October 29th.

Canadian dollar positions rose slightly this week after having declined in the previous three weeks. Overall, the CAD positioning remains in bullish territory for the twenty-third straight week after turning bullish in early July. The Canadian dollar is only one of three major currencies currently with overall bullish net positions (USD Index and Mexican peso being the other ones).


Chart: Current Strength of Each Currency compared to their 3-Year Range

See the table and individual currency charts below.


Table of Large Speculator Levels & Weekly Changes:

CurrencyNet Speculator PositionSpecs Weekly Change
USD Index23,877-261
EuroFx-69,049-7,633
GBP-30,0506,526
JPY-47,823-8,232
CHF-22,287-1,312
CAD21,4711,127
AUD-36,4338,922
NZD-26,9928,834
MXN130,127-5,522


This latest COT data is through Tuesday and shows a quick view of how large speculators or non-commercials (for-profit traders) were positioned in the futures markets. All currency positions are in direct relation to the US dollar where, for example, a bet for the euro is a bet that the euro will rise versus the dollar while a bet against the euro will be a bet that the dollar will gain versus the euro.


Weekly Charts: Large Trader Weekly Positions vs Price

EuroFX:

The Euro large speculator standing this week equaled a net position of -69,049 contracts in the data reported through Tuesday. This was a weekly fall of -7,633 contracts from the previous week which had a total of -61,416 net contracts.


British Pound Sterling:

The large British pound sterling speculator level recorded a net position of -30,050 contracts in the data reported this week. This was a weekly gain of 6,526 contracts from the previous week which had a total of -36,576 net contracts.


Japanese Yen:

Large Japanese yen speculators totaled a net position of -47,823 contracts in this week’s data. This was a weekly lowering of -8,232 contracts from the previous week which had a total of -39,591 net contracts.


Swiss Franc:

The Swiss franc speculator standing this week equaled a net position of -22,287 contracts in the data through Tuesday. This was a weekly lowering of -1,312 contracts from the previous week which had a total of -20,975 net contracts.


Canadian Dollar:

Canadian dollar speculators was a net position of 21,471 contracts this week. This was a gain of 1,127 contracts from the previous week which had a total of 20,344 net contracts.


Australian Dollar:

The large speculator positions in Australian dollar futures came in at a net position of -36,433 contracts this week in the data ending Tuesday. This was a weekly advance of 8,922 contracts from the previous week which had a total of -45,355 net contracts.


New Zealand Dollar:

The New Zealand dollar speculative standing equaled a net position of -26,992 contracts this week in the latest COT data. This was a weekly increase of 8,834 contracts from the previous week which had a total of -35,826 net contracts.


Mexican Peso:

Mexican peso speculators equaled a net position of 130,127 contracts this week. This was a weekly fall of -5,522 contracts from the previous week which had a total of 135,649 net contracts.


Article By CountingPips.comReceive our weekly COT Reports by Email

*COT Report: The COT data, released weekly to the public each Friday, is updated through the most recent Tuesday (data is 3 days old) and shows a quick view of how large speculators or non-commercials (for-profit traders) were positioned in the futures markets.

The CFTC categorizes trader positions according to commercial hedgers (traders who use futures contracts for hedging as part of the business), non-commercials (large traders who speculate to realize trading profits) and nonreportable traders (usually small traders/speculators).

Find CFTC criteria here: (http://www.cftc.gov/MarketReports/CommitmentsofTraders/ExplanatoryNotes/index.htm).


WTI Crude Oil Speculators sharply dropped their bullish bets after strong run up

December 7th – By CountingPips.comReceive our weekly COT Reports by Email

WTI Crude Oil Non-Commercial Speculator Positions:

Large energy speculators cut back on their bullish net positions in the WTI Crude Oil futures markets this week, according to the latest Commitment of Traders (COT) data released by the Commodity Futures Trading Commission (CFTC) on Friday.

The non-commercial futures contracts of WTI Crude Oil futures, traded by large speculators and hedge funds, totaled a net position of 428,035 contracts in the data reported through Tuesday December 3rd. This was a weekly decline of -42,901 net contracts from the previous week which had a total of 470,936 net contracts.

The week’s net position was the result of the gross bullish position (longs) falling by -22,617 contracts (to a weekly total of 531,120 contracts) while the gross bearish position (shorts) increased by 20,284 contracts for the week (to a total of 103,085 contracts).

Crude oil speculators cooled off on their bullish positions this week following a strong run over the previous two months. Bullish bets had previously risen for seven consecutive weeks through November 26th and gained by a total of +115,851 bets in that time-frame. This week’s decline by over -40,000 net contracts marks the highest one-week fall since June while the overall standing (+428,035 contracts) remains above the +400,000 contract level for a fifth straight week.

WTI Crude Oil Commercial Positions:

The commercial traders position, hedgers or traders engaged in buying and selling for business purposes, totaled a net position of -437,710 contracts on the week. This was a weekly boost of 37,066 contracts from the total net of -474,776 contracts reported the previous week.

WTI Crude Oil Futures:

Over the same weekly reporting time-frame, from Tuesday to Tuesday, the WTI Crude Oil Futures (Front Month) closed at approximately $56.10 which was a decline of $-2.31 from the previous close of $58.41, according to unofficial market data.

*COT Report: The COT data, released weekly to the public each Friday, is updated through the most recent Tuesday (data is 3 days old) and shows a quick view of how large speculators or non-commercials (for-profit traders) as well as the commercial traders (hedgers & traders for business purposes) were positioned in the futures markets.

The CFTC categorizes trader positions according to commercial hedgers (traders who use futures contracts for hedging as part of the business), non-commercials (large traders who speculate to realize trading profits) and nonreportable traders (usually small traders/speculators).

Find CFTC criteria here: (http://www.cftc.gov/MarketReports/CommitmentsofTraders/ExplanatoryNotes/index.htm).

Article By CountingPips.comReceive our weekly COT Reports by Email

10-Year Note Speculators raised their bearish bets to 11-week high

December 7th – By CountingPips.comReceive our weekly COT Reports by Email

10-Year Note Non-Commercial Speculator Positions:

Large bond speculators added to their bearish net positions in the 10-Year Note futures markets this week, according to the latest Commitment of Traders (COT) data released by the Commodity Futures Trading Commission (CFTC) on Friday.

The non-commercial futures contracts of 10-Year Note futures, traded by large speculators and hedge funds, totaled a net position of -221,895 contracts in the data reported through Tuesday December 3rd. This was a weekly change of -76,150 net contracts from the previous week which had a total of -145,745 net contracts.

The week’s net position was the result of the gross bullish position (longs) tumbling by -5,978 contracts (to a weekly total of 702,318 contracts) while the gross bearish position (shorts) jumped by 70,172 contracts for the week (to a total of 924,213 contracts).

10-Year speculators added to their bearish bets for the second time in three weeks and by a total of -73,101 contracts over that time-frame. This rise in bearishness pushed the overall bearish standing to the highest level in eleven weeks, dating back to September 17th. Despite the recent uptick in bearish bets, the current level (-221,895 contracts) remains below the 2019 average level of -257,672 contracts.

10-Year Note Commercial Positions:

The commercial traders position, hedgers or traders engaged in buying and selling for business purposes, totaled a net position of 241,919 contracts on the week. This was a weekly increase of 116,614 contracts from the total net of 125,305 contracts reported the previous week.

10-Year Note Futures:

Over the same weekly reporting time-frame, from Tuesday to Tuesday, the 10-Year Note Futures (Front Month) closed at approximately $130.03 which was an advance of $0.28 from the previous close of $129.75, according to unofficial market data.

*COT Report: The COT data, released weekly to the public each Friday, is updated through the most recent Tuesday (data is 3 days old) and shows a quick view of how large speculators or non-commercials (for-profit traders) as well as the commercial traders (hedgers & traders for business purposes) were positioned in the futures markets.

The CFTC categorizes trader positions according to commercial hedgers (traders who use futures contracts for hedging as part of the business), non-commercials (large traders who speculate to realize trading profits) and nonreportable traders (usually small traders/speculators).

Find CFTC criteria here: (http://www.cftc.gov/MarketReports/CommitmentsofTraders/ExplanatoryNotes/index.htm).

Article By CountingPips.comReceive our weekly COT Reports by Email

Gold Speculators lifted their bullish bets to highest in 10 weeks

December 7th – By CountingPips.comReceive our weekly COT Reports by Email

Gold Non-Commercial Speculator Positions:

Large precious metals speculators increased their bullish net positions in the Gold futures markets this week, according to the latest Commitment of Traders (COT) data released by the Commodity Futures Trading Commission (CFTC) on Friday.

The non-commercial futures contracts of Gold futures, traded by large speculators and hedge funds, totaled a net position of 290,705 contracts in the data reported through Tuesday December 3rd. This was a weekly gain of 19,071 net contracts from the previous week which had a total of 271,634 net contracts.

The week’s net position was the result of the gross bullish position (longs) increasing by 21,239 contracts (to a weekly total of 346,525 contracts) while the gross bearish position (shorts) rose by just 2,168 contracts for the week (to a total of 55,820 contracts).

Gold speculators boosted their bets to the highest level in ten weeks this week. The current bullish level is now at the highest standing standing since September 24th when the net position totaled +312,444 contracts. Overall, speculative positions have gained in six out of the past nine weeks to maintain an overall strong bullish level.

Gold Commercial Positions:

The commercial traders position, hedgers or traders engaged in buying and selling for business purposes, totaled a net position of -322,787 contracts on the week. This was a weekly decrease of -17,320 contracts from the total net of -305,467 contracts reported the previous week.

Gold Futures:

Over the same weekly reporting time-frame, from Tuesday to Tuesday, the Gold Futures (Front Month) closed at approximately $1484.40 which was an uptick of $17.00 from the previous close of $1467.40, according to unofficial market data.

*COT Report: The COT data, released weekly to the public each Friday, is updated through the most recent Tuesday (data is 3 days old) and shows a quick view of how large speculators or non-commercials (for-profit traders) as well as the commercial traders (hedgers & traders for business purposes) were positioned in the futures markets.

The CFTC categorizes trader positions according to commercial hedgers (traders who use futures contracts for hedging as part of the business), non-commercials (large traders who speculate to realize trading profits) and nonreportable traders (usually small traders/speculators).

Find CFTC criteria here: (http://www.cftc.gov/MarketReports/CommitmentsofTraders/ExplanatoryNotes/index.htm).

Article By CountingPips.comReceive our weekly COT Reports by Email

VIX Speculators cut bearish bets for a 2nd week after record high

December 7th – By CountingPips.comReceive our weekly COT Reports by Email

VIX Non-Commercial Speculator Positions:

Large volatility speculators dropped their bearish net positions in the VIX futures markets for a second straight week this week, according to the latest Commitment of Traders (COT) data released by the Commodity Futures Trading Commission (CFTC) on Friday.

The non-commercial futures contracts of VIX futures, traded by large speculators and hedge funds, totaled a net position of -199,312 contracts in the data reported through Tuesday December 3rd. This was a weekly change of 11,387 net contracts from the previous week which had a total of -210,699 net contracts.

The week’s net position was the result of the gross bullish position (longs) sliding by -4,902 contracts (to a weekly total of 75,209 contracts) while the gross bearish position (shorts) fell by a larger amount of -16,289 contracts for the week (to a total of 274,521 contracts).

VIX speculators decreased their bearish positions for two straight weeks and by a total of 19,050 contracts over that period. Previously, speculative positions had risen to an all-time record high bearish level for four consecutive weeks with the latest bearish top coming in at a total of -218,362 contracts on November 19th. This week’s total standing of -199,312 contracts marks the first time contracts have been under -200,000 since late October.

VIX Commercial Positions:

The commercial traders position, hedgers or traders engaged in buying and selling for business purposes, totaled a net position of 208,807 contracts on the week. This was a weekly shortfall of -12,052 contracts from the total net of 220,859 contracts reported the previous week.

VIX Futures:

Over the same weekly reporting time-frame, from Tuesday to Tuesday, the VIX Futures (Front Month) closed at approximately $16.22 which was a rise of $2.35 from the previous close of $13.87, according to unofficial market data.

*COT Report: The COT data, released weekly to the public each Friday, is updated through the most recent Tuesday (data is 3 days old) and shows a quick view of how large speculators or non-commercials (for-profit traders) as well as the commercial traders (hedgers & traders for business purposes) were positioned in the futures markets.

The CFTC categorizes trader positions according to commercial hedgers (traders who use futures contracts for hedging as part of the business), non-commercials (large traders who speculate to realize trading profits) and nonreportable traders (usually small traders/speculators).

Find CFTC criteria here: (http://www.cftc.gov/MarketReports/CommitmentsofTraders/ExplanatoryNotes/index.htm).

Article By CountingPips.comReceive our weekly COT Reports by Email

Silver Speculators cut back on their bullish bets for 1st time in 3 weeks

December 7th – By CountingPips.comReceive our weekly COT Reports by Email

Silver Non-Commercial Speculator Positions:

Large precious metals speculators slightly pulled back on their bullish net positions in the Silver futures markets this week, according to the latest Commitment of Traders (COT) data released by the Commodity Futures Trading Commission (CFTC) on Friday.

The non-commercial futures contracts of Silver futures, traded by large speculators and hedge funds, totaled a net position of 50,227 contracts in the data reported through Tuesday December 3rd. This was a weekly dip of -2,283 net contracts from the previous week which had a total of 52,510 net contracts.

The week’s net position was the result of the gross bullish position (longs) tumbling by -1,654 contracts (to a weekly total of 89,241 contracts) while the gross bearish position (shorts) rose by 629 contracts for the week (to a total of 39,014 contracts).

Silver speculators decreased their bullish bets this week following gains in the previous two straight weeks. Despite this week’s decline, the overall standing remains very bullish and above the +50,000 net contract level for a second consecutive week. This is first time silver bets have been higher than +50,000 net contracts for two straight weeks since September 17th and 24th.

Silver Commercial Positions:

The commercial traders position, hedgers or traders engaged in buying and selling for business purposes, totaled a net position of -74,299 contracts on the week. This was a weekly drop of -426 contracts from the total net of -73,873 contracts reported the previous week.

Silver Futures:

Over the same weekly reporting time-frame, from Tuesday to Tuesday, the Silver Futures (Front Month) closed at approximately $1724.80 which was a rise of $6.00 from the previous close of $1718.80, according to unofficial market data.

*COT Report: The COT data, released weekly to the public each Friday, is updated through the most recent Tuesday (data is 3 days old) and shows a quick view of how large speculators or non-commercials (for-profit traders) as well as the commercial traders (hedgers & traders for business purposes) were positioned in the futures markets.

The CFTC categorizes trader positions according to commercial hedgers (traders who use futures contracts for hedging as part of the business), non-commercials (large traders who speculate to realize trading profits) and nonreportable traders (usually small traders/speculators).

Find CFTC criteria here: (http://www.cftc.gov/MarketReports/CommitmentsofTraders/ExplanatoryNotes/index.htm).

Article By CountingPips.comReceive our weekly COT Reports by Email

Copper Speculators slightly reduced their bearish bets this week

December 7th – By CountingPips.comReceive our weekly COT Reports by Email

Copper Non-Commercial Speculator Positions:

Large precious metals speculators cut back on their bearish net positions in the Copper futures markets for the first time in four weeks, according to the latest Commitment of Traders (COT) data released by the Commodity Futures Trading Commission (CFTC) on Friday.

The non-commercial futures contracts of Copper futures, traded by large speculators and hedge funds, totaled a net position of -37,707 contracts in the data reported through Tuesday December 3rd. This was a weekly change of 855 net contracts from the previous week which had a total of -38,562 net contracts.

The week’s net position was the result of the gross bullish position (longs) advancing by 3,059 contracts (to a weekly total of 64,225 contracts) while the gross bearish position (shorts) rose by a lesser amount of 2,204 contracts for the week (to a total of 101,932 contracts).

Copper speculators trimmed their bearish bets after having added to bearish positions in the previous three weeks (by a total of -15,251 contracts). The copper speculative standing continues to remain very bearish overall and is above the -35,000 net contract level for a third consecutive week.

Copper Commercial Positions:

The commercial traders position, hedgers or traders engaged in buying and selling for business purposes, totaled a net position of 35,628 contracts on the week. This was a weekly drop of -1,010 contracts from the total net of 36,638 contracts reported the previous week.

Copper Futures:

Over the same weekly reporting time-frame, from Tuesday to Tuesday, the Copper Futures (Front Month) closed at approximately $262.30 which was a fall of $-7.45 from the previous close of $269.75, according to unofficial market data.

*COT Report: The COT data, released weekly to the public each Friday, is updated through the most recent Tuesday (data is 3 days old) and shows a quick view of how large speculators or non-commercials (for-profit traders) as well as the commercial traders (hedgers & traders for business purposes) were positioned in the futures markets.

The CFTC categorizes trader positions according to commercial hedgers (traders who use futures contracts for hedging as part of the business), non-commercials (large traders who speculate to realize trading profits) and nonreportable traders (usually small traders/speculators).

Find CFTC criteria here: (http://www.cftc.gov/MarketReports/CommitmentsofTraders/ExplanatoryNotes/index.htm).

Article By CountingPips.comReceive our weekly COT Reports by Email