The Yen has been weakening gradually for several months with slowly increasing risk appetite as we keep getting hopeful signs from US-Chinese trade talks.
More recently, on Monday, we got Q3 GDP numbers. These caught the market by surprise showing significant growth in output. The news helped fuel the retracement that the yen has been having against major pairs so far this month.
Tomorrow we have the release of manufacturing data. This could show improving outlook for Japan, which might give the pair some extra weight if the USDJPY tried to break through the 108.30 support level.
There is some optimism that we might get a break in the trend this time around. But, there are some mitigating factors that have led many economists to expect disappointment.
What We Are Expecting
There are two extraordinary factors that could drag down the Tankan index this time.
The first is the impact of the sales tax hike in October. The second is the economic impact of Typhoon Hagabis.
This would imply that the underlying figure is higher than reported, indicating that the market might take a worse than expected result in stride.
The figure we want to pay attention to is the Tankan Large Manufacturing Index. Expectations are for this to dip to +3 from +5 in the prior release. That would be a continuation of the downward trend that started at the beginning of 2018. It would also be the worst result since 2013 (though the last report was the worst since 2013 as well.)
Reuters’ monthly Tankan survey, designed to predict the official figure, has been consistently negative since the last release. The consensus of economists might be a little over-optimistic.
The Other Figures
The bigger sector, though less influential for the currency, is the Non-Manufacturing Index. Expectations are for this to decline to 17 from 21 prior.
While this, too, has been trending down since early 2018, the slope hasn’t been as pronounced. This suggests that the domestic market remains more resilient.
We can expect the large manufacturing outlook to go slightly negative to -1 compared to 2 prior. This is largely attributed to the lack of concrete measures taken in the trade dispute.
Expectations are for Capex, on the other hand, to increase to 11.5% from 6.6% prior. This figure generally doesn’t affect the markets immediately. However, if Japanese businesses are increasing their investments, it could signal an expectation for the trend to turn positive in the near future.
What’s interesting to note is that small businesses are leading the increase in spending. This is compared to larger businesses (often more dependent on exports) that we’re expecting to cut spending during the first quarter of next year.
The Market Reaction
So far, the markets appear to have been pricing in a slightly worse set of data. If the Tankan Large Manufacturing Index were to move above 5, it could prompt a stronger market reaction, and actually weaken the yen (as a better domestic situation would improve the Nikkei). This would show a break in the trend.
On the other hand, deepening significantly into negative would prompt speculation that the BOJ might consider further intervention, which could also weaken the yen, especially against the dollar.
Falling New Zealand food prices bearish for NZDUSD
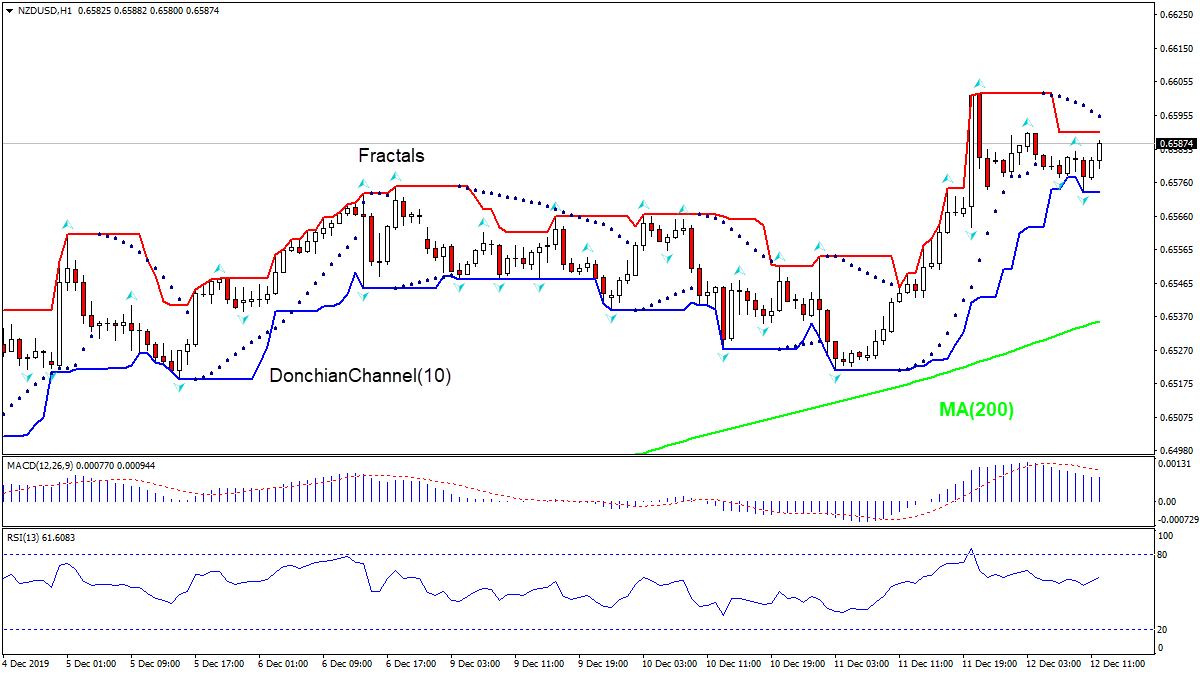
Food Price Index in New Zealand declined 0.7% over month in November after 0.3% drop in previous month. Will the NZDUSD decline?
The price chart on 1-hour timeframe shows NZDUSD: H1 is trading sideways. The price is falling above the 200-period moving average MA(200) which is rising. And the RSI oscillator is falling toward 50 level. There is no trend yet formed, traders have to decide when it would be a best time to enter the market.
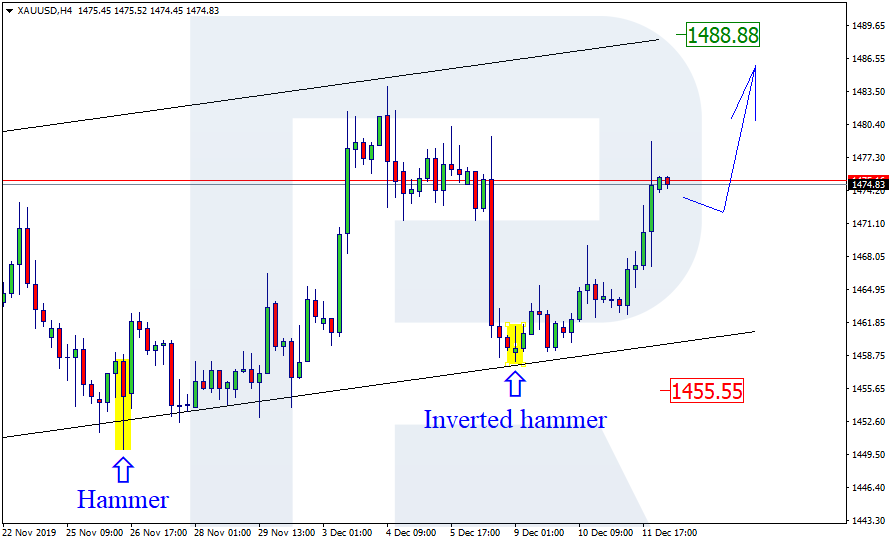
As we can see in the H4 chart, the ascending tendency continues. After completing several reversal patterns, including Inverted Hammer, close to the channel’s downside, XAUUSD is trying to reverse. In this case, the price may form a slight correction and resume growing with the upside target at 1488.88. At the same time, we shouldn’t exclude an opposite scenario, which implies that the instrument may continue falling towards 1455.55.
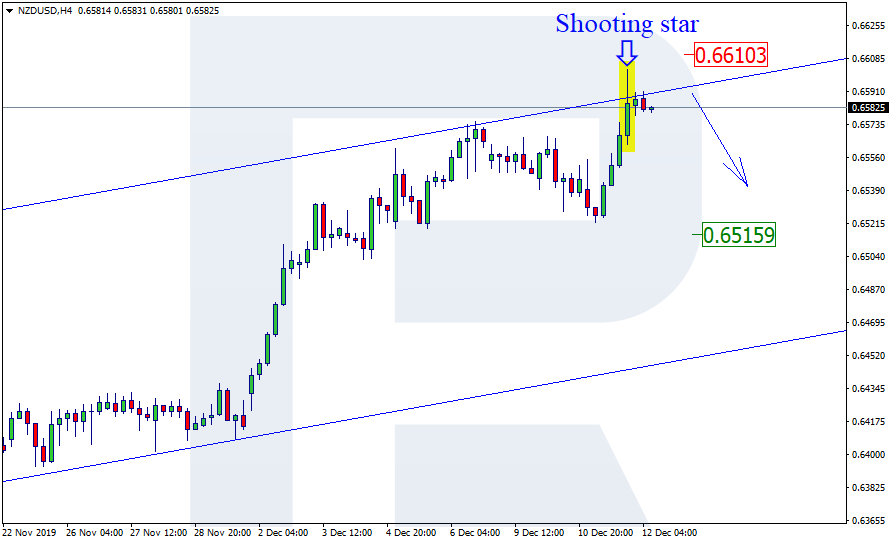
NZDUSD, “New Zealand vs. US Dollar”
As we can see in the H4 chart, the ascending tendency continues. After forming several reversal patterns, including Shooting Star, near the channel’s upside border, NZDUSD is trying to reverse. Later, the market may start a new decline to reach the closest support level at 0.6515. At the same time, one shouldn’t exclude an opposite scenario, according to which the instrument may update its highs and grow towards 0.6610.
Attention! Forecasts presented in this section only reflect the author’s private opinion and should not be considered as guidance for trading. RoboForex LP bears no responsibility for trading results based on trading recommendations described in these analytical reviews.
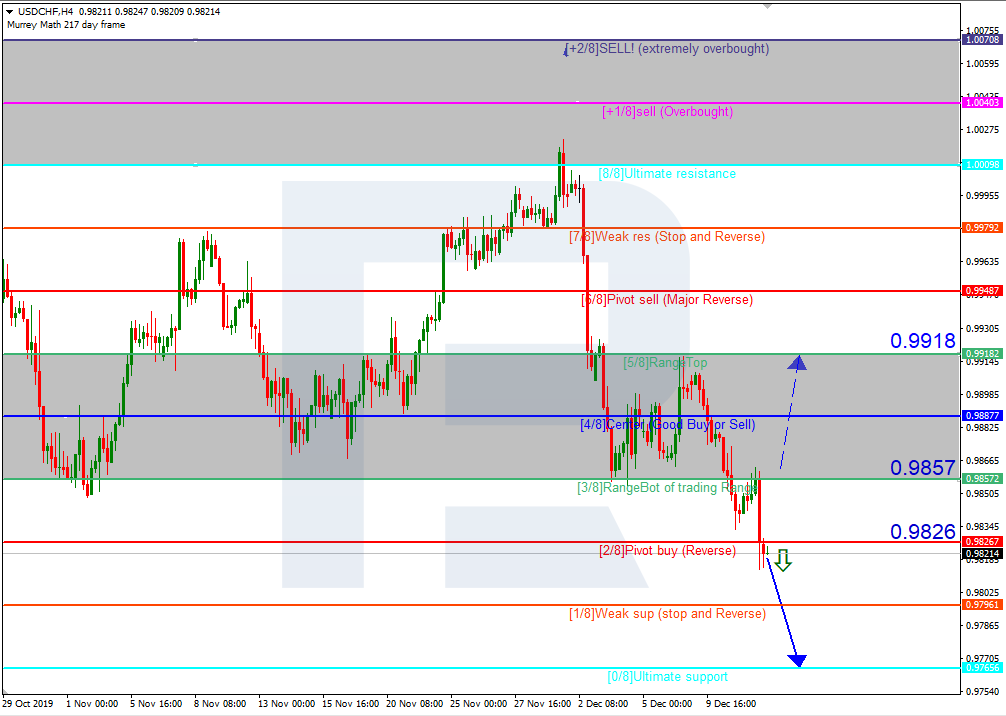
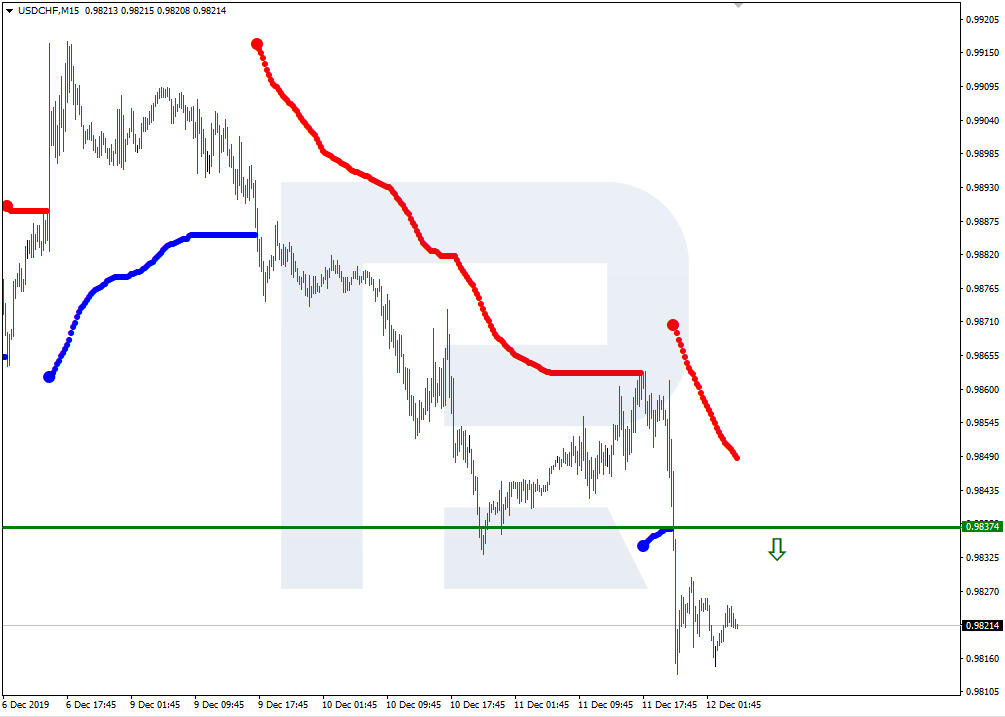
In the H4 chart, USDCHF is moving below 3/8. In this case, the price is expected to continue falling to reach the support at 0/8. However, this scenario may no longer be valid if the price breaks 3/8 to the upside. After that, the instrument may continue growing towards the resistance at 5/8.
As we can see in the M15 chart, the pair has broken the downside line of the VoltyChannel indicator and, as a result, may continue trading downwards.
XAUUSD, “Gold vs US Dollar”
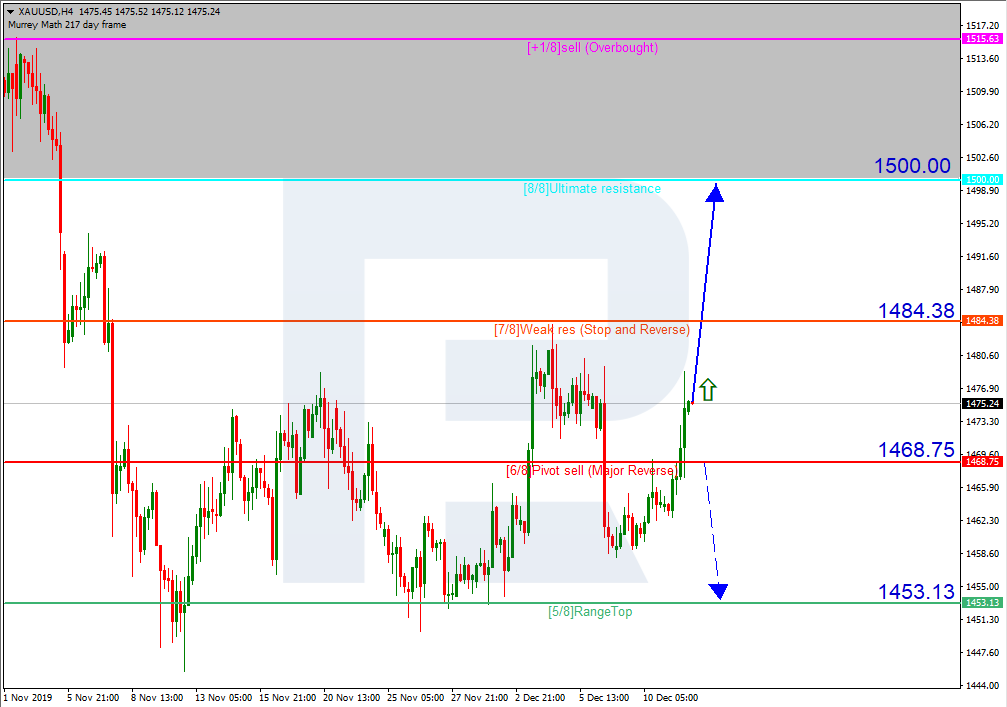
In the H4 chart, XAUUSD is moving above 5/8. In this case, the price may break 7/8 and continue trading upwards to reach the resistance at 8/8. However, this scenario may no longer be valid if the price breaks 6/8 to the downside. After that, the instrument may continue falling towards the support at 5/8.
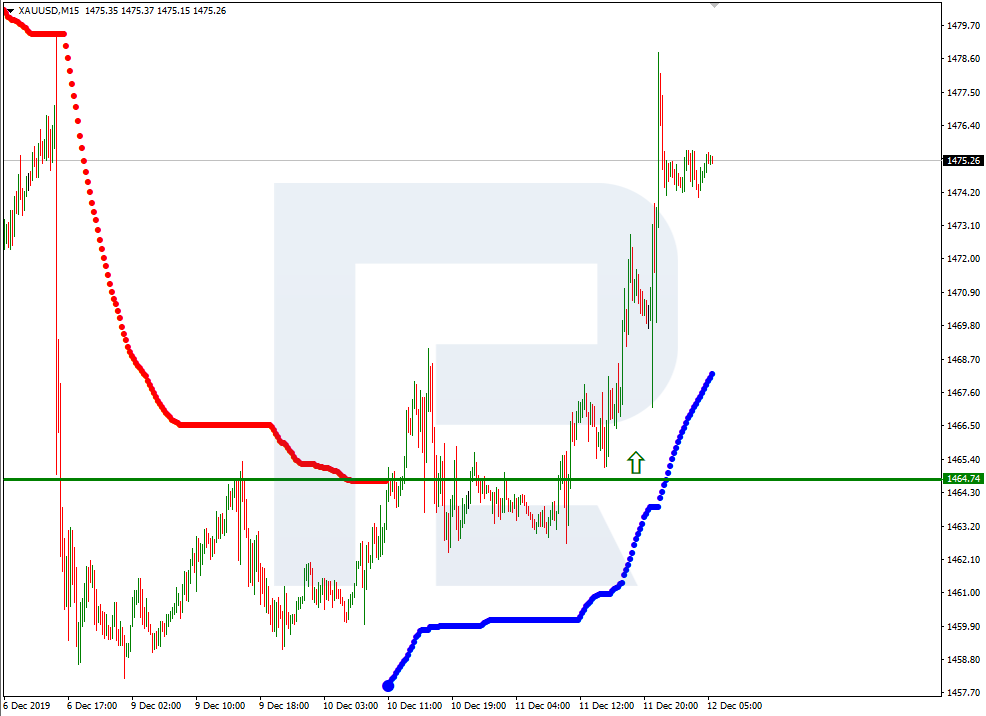
As we can see in the M15 chart, the pair has broken the upside line of the VoltyChannel indicator and, as a result, may continue the ascending tendency.
Attention! Forecasts presented in this section only reflect the author’s private opinion and should not be considered as guidance for trading. RoboForex LP bears no responsibility for trading results based on trading recommendations described in these analytical reviews.
The EUR/USD currency pair rose during yesterday’s trading. The US dollar weakened after the Fed meeting. The regulator kept interest rates unchanged at 1.75% and gave a signal that they are likely to remain unchanged until the end of 2020, while it is expected that moderate economic growth and low unemployment will continue until the next year’s presidential election . At the moment, the key support and resistance levels are 1.11200 and 1.11500, respectively. Open positions from these marks.
The Economic News Feed for 12.12.2019:
– ECB decision on interest rate – 14:45 (GMT+2:00);
– US manufacturer price index – 15:30 (GMT+2:00).
Indicators point to the strength of buyers: the price is being traded above 50 MA and 100 MA.
The MACD histogram is in the positive zone, but below the signal line, which gives a weak signal to buy EUR/USD.
The Stochastic Oscillator is near the oversold zone, the% K line is below the% D line, which indicates a bearish sentiment.
Trading recommendations
Support levels: 1.11200, 1.10900, 1.10600
Resistance levels: 1.11500, 1.11800
If the price consolidates above 1.11500, expect further growth toward 1.11800.
Alternatively, the quotes could fix below 1.11200 and descend toward 1.10900-1.10750.
The GBP/USD currency pair
Technical indicators of the currency pair:
Prev Open: 1.31546
Open: 1.31964
% chg. over the last day: -0.12
Day’s range: 1.32074 – 1.32097
52 wk range: 1.1959 – 1.3385
The GBP/USD currency pair has also moved up. Today, investors will look into the early parliamentary elections. Prime Minister Boris Johnson has decided to hold early parliamentary elections, as he hopes that the new parliament will support his Brexit deal. At the moment, the key support level is 1.31900. The key resistance level is 1.32250. We recommend opening positions from these marks.
The news background on the UK economy is calm. Today, parliamentary elections will be held.
Indicators point to the strength of buyers: the price has fixed above 50 MA and 100 MA.
The MACD histogram is in the positive zone, but below the signal line, which gives a weak signal to buy GBP/USD.
The Stochastic Oscillator is in the neutral zone, the %K line crossed the %D line. There are no signals.
Trading recommendations
Support levels: 1.31900, 1.31600, 1.31200
Resistance levels: 1.32250, 1.32600
If the price consolidates above 1.32250, expect further growth toward 1.32600-1.32800.
Alternatively, the quotes could fix below 1.31900 and descend toward 1.31600-1.31500.
The USD/CAD currency pair
Technical indicators of the currency pair:
Prev Open: 1.32300
Open: 1.31723
% chg. over the last day: -0.40
Day’s range: 1.31667 – 1.31694
52 wk range: 1.2727 – 1.3664
During yesterday’s trading, the USD/CAD quotes fell significantly due to Fed forecasts. The currency pair fell by more than 60 points. At the moment, the trading instrument is in lateral movement. The local support and resistance levels are still 1.31550 and 1.31800, respectively. We recommend paying attention to the dynamics of oil prices. Open positions from key levels.
Today, the publication of important news from Canada is not expected. We recommend you to pay attention to the speech of the head of the Bank of Canada.
Indicators point to the strength of sellers: the price is being traded below 50 MA and 100 MA.
The MACD histogram is in the negative zone, but above the signal line, which gives a weak signal to sell USD/CAD.
The Stochastic Oscillator is in the neutral zone, the %K line crossed the %D line. There are no exact signals.
Trading recommendations
Support levels: 1.31550, 1.31200
Resistance levels: 1.31800, 1.32150, 1.32500
If the price consolidates below 1.31550, expect the quotes to descend toward 1.31550 and eventually reach 1.31200-1.31000.
Alternatively, the quotes could correct toward 1.32150-1.32300.
The USD/JPY currency pair
Technical indicators of the currency pair:
Prev Open: 108.716
Open: 108.550
% chg. over the last day: -0.14
Day’s range: 108.608 – 108.656
52 wk range: 104.97 – 114.56
Quotes USD/JPY also fell during yesterday’s trading. Today, during the Asian trading session, the USD/JPY currency pair has moved into recovery. Currently, the key support and resistance levels are 108.600 and 108.800, respectively. We recommend you to pay attention to the dynamics of yield on US government bonds and open positions from key levels.
The Economic News Feed for 12.12.2019 is calm.
Indicators do not give accurate signals: the price is crossing 50 MA and 100 MA.
The MACD histogram is in the negative zone, but above the signal line, which gives a weak signal to sell USD/JPY.
The Stochastic Oscillator is in the overbought zone, the %K line crosses the %D line. There are no exact signals.
Crude oil prices were knocked sharply lower this week in response to the latest report from the Energy Information Administration. The EIA showed that in the week ending December 6th, US crude stores rose by 800k barrels.
This was in stark contrast to the expected 2.8 million barrel drawdown which analysts were forecasting ahead of the release. The data came on the back of Tuesday’s API release, which reported 1.4 million barrels.
This latest increase in surplus levels takes inventories back up to 447 million barrels.
Gasoline & Distillate Stockpiles Rise
Elsewhere, the data was equally bearish. Gasoline inventories were seen higher by 5.4 million barrels over the week, marking a further increase from the prior week’s 3.4 million barrel increase.
Gasoline production over the week was higher by a significant 9.8 million barrels, again coming on the back of the prior week’s 9.9 million barrel increase.
Distillate fuel inventories, which include diesel and heating oil, were also higher over the week by 4.1 million barrels, extending gains from the prior week’s 3.1 million barrels.
Distillate production over the week was higher by 5.2 million barrels per day.
EIA Raises US Crude Production Forecasts
The data, which once again puts focus on the growing supply/demand imbalance in the markets, has compounded the bearish update from the EIA earlier in the week.
On Tuesday, the EIA released its Short-Term Energy Outlook for December. In the latest forecast, the EIA once again revised its US crude production outlook higher. The EIA now forecasts production to hit 13.2 million barrels per day in 2020. This would be up by 0.9 million barrels per day from the 2019 level.
US Turns Net Exporter of Crude
Also of note was the section on US crude exporting. The US was recorded as having exported 90k barrels per day more than the total number of crude and petroleum products importance in September.
This marks the first month that the US has exported more crude products than it imported. It comes as evidence of the growing shift in the US away from being a net importer of oil to being a net exporter.
Looking ahead, the EIA now forecasts that US crude exports will total 570k barrels per day in 2020. This is against an average of 490 barrels per day in imports, confirming the shift to a net-exporter.
OPEC Announces Deeper Production Cuts
The continued increases in both US crude inventories and US crude output forecasts will be frustrating for OPEC.
The producer-nation cartel, along with a group of allied-nations led by Russia, recently announced that it will increase production cuts from 1.2 million barrels per day to 1.7 million barrels per day.
The group cited the ongoing downside pressure from the US-China trade war, which has yet to be resolved. With the market potentially approaching another round of US tariffs on December 15th, the near term outlook for crude has clear downside risks.
Reports this week that the US is considering postponing the tariffs are offering some support here. This should offset the downside in oil if tariffs are, in fact, postponed.
Technical Perspective
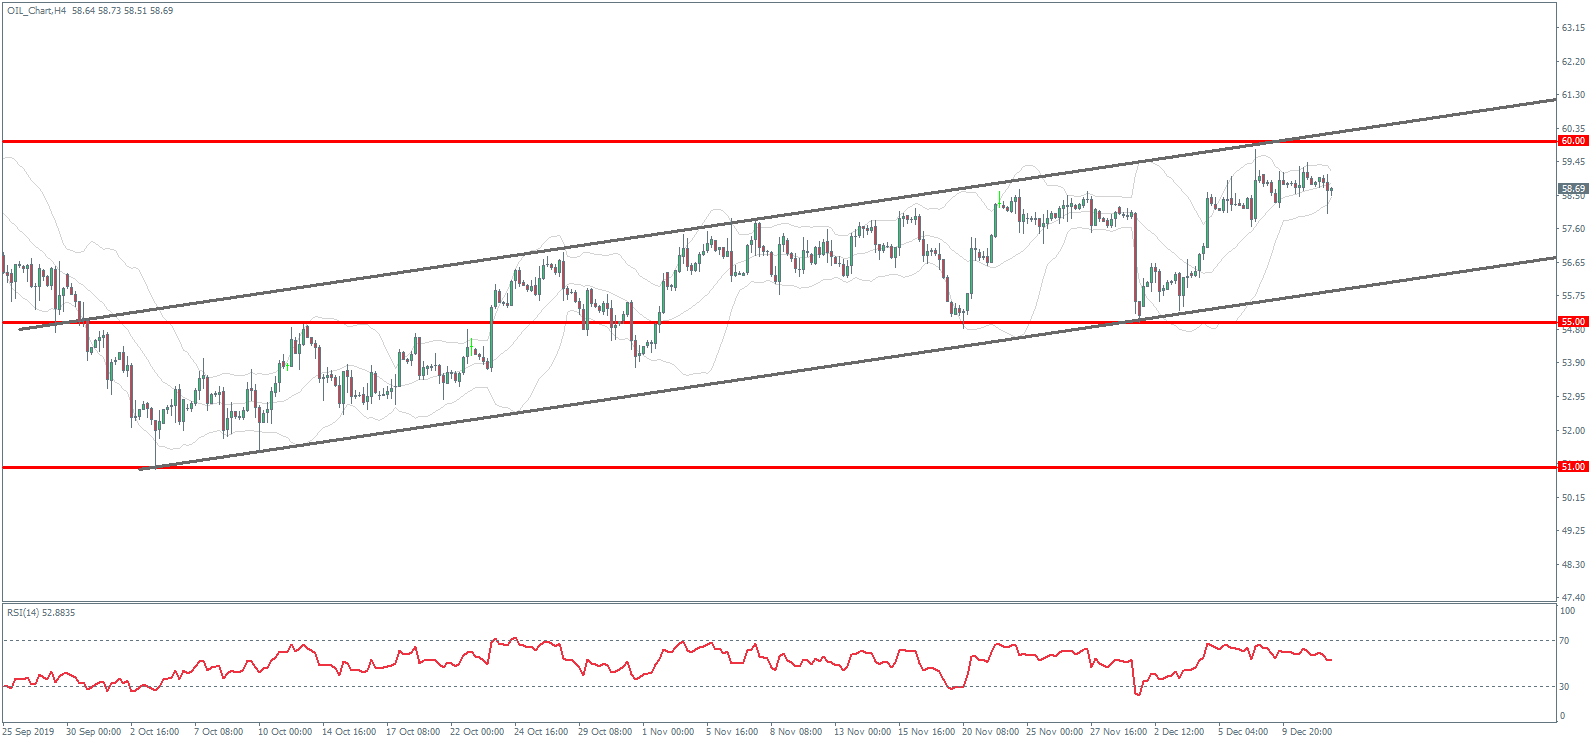
Crude prices continue to grind higher within the bullish channel which has framed the months-long recovery off the 51 level. While still capped by the 60 level resistance for now, bearish divergence in the RSI indicator raises the potential of a reversal lower.
The 55 level remains the key pivot to watch, keeping focus on further upside while above and shifting focus to the downside if we move below.
On Wednesday the 11th of December, the EURUSD pair closed up by 0.34% or 37 points (4 digits). The euro rose sharply after a US Federal Reserve meeting. The Federal Open Market Committee (FOMC) kept interest rates in the 1.5%-1.75% range, and also made it clear that it intends to take a break in 2020. Most committee members expect the base interest rate to remain unchanged until at least 2021.
The forecast for the US GDP index in 2019 remained unchanged at +2.2%, and +2.0% in 2020. The forecast for the unemployment rate in 2019 was reduced from 3.7% to 3.6%, and from 3.7% to 3.5% in 2020. The forecast for the personal consumption expenditures (PCE) index was reduced from 1.8% to 1.6% in 2019, and remained unchanged for 2020 at 1.9%.
Today’s news (GMT+3):
10:00 Eurozone: Industrial Production s.a. (MoM) (Oct).
The UK general election is being held today. The results will have a strong impact on the British pound, the euro and protective assets.
Current situation:
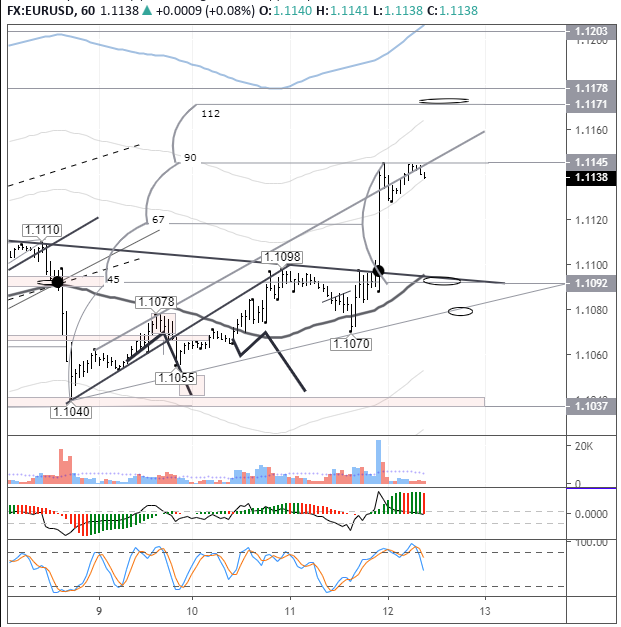
Speculators were not at all enthralled with the US Federal Reserve’s decision to freeze interest rates, although the situation in 2020 may change. The price jumped up to the 90th degree, with the 112th degree reversal located at 1.1171.
Traders’ attention is primarily focused on the UK general election results and ECB meetings. Since the market does not expect changes in rates from the regulator, Christine Lagarde’s speech is of the greatest interest at the press conference. Traders will closely monitor her performance in order to understand in which direction the bank will operate under her leadership.
As yesterday, there is no forecast. This is Lagarde’s first meeting, and how her speech and answers to questions from journalists will influence the price in euro pairs cannot be accurately predicted. However, we believe that market volatility will be no less than after the meeting of the US Federal Reserve. The first support is at 1.1092, the second at 1.1080. If we add the UK elections into the mix, it’s even harder to imagine where the euro and the pound will be at the end of the day.
The Federal Reserve bank concluded its two-day monetary policy meeting on Wednesday. As widely expected, rates were left at the current levels.
The central bank, in its forecasts, indicated that rates will remain at these levels. The forecasts come as the Fed previously signaled that it was done with lowering rates any further. The dollar slipped on the news.
Euro Trades Mixed on US Data
The euro was posting modest gains on Wednesday, in an attempt to maintain the momentum. On the economic front, the monthly inflation report from the US was the key mover.
Headline inflation in the United States rose by 2.1% on the year. On a monthly basis, inflation grew by 0.3%. However, data suggests that the pace of inflation growth continues to remain tame. Data from the eurozone was sparse.
EURUSD Testing Upper Resistance
The euro rose to session highs near 1.1100. However, price action is likely to remain within the range of 1.1100 and 1.1072 ahead of today’s ECB meeting.
A breakout from this range will probably set the stage for the near term direction in prices. To the downside, EURUSD is at risk of sliding to 1.1000 support. To the upside, above 1.1100 resistance, the 1.1131 level remains within reach.
Sterling in a Holding Pattern Ahead of Elections
The British pound was trading steady, holding out near the eight-month high. However, volatility could rise as the UK heads to the polls today.
Although the Conservative party is expected to win, the narrowing of the lead by the Labor party remains a risk. The UK is set to leave the EU on January 31st. Ahead of this, the Conservative party needs a majority win to proceed with the Brexit plan.
GBPUSD Volatility to Rise
The currency pair has already posted an impressive rally. The risks from the current highs remain mixed. There is scope for a correction in the near term. If the support at 1.3100 breaks, the GBPUSD could be looking to post a correction to 1.2960. To the upside, further gains could push the GBPUSD to the 1.3200 handle.
Gold Rises on Dovish Fed Outlook
The precious metal was posting some modest gains after the Fed meeting. As the Fed outlook stays dovish, it is likely that gold will remain in favor. Besides the Fed’s outlook, trade uncertainty also is a major factor. Today’s ECB meeting continues to be the main key risk in the short term.
XAUUSD Could Rise Higher
XAUUSD is likely to test the upper resistance level of 1483. Given the fact that this level has already been tested, there is a scope for a breakout higher. However, in the near term, XAUUSD is more likely to trade range-bound. Price action has been trading flat within the 1483 and 1462 levels.
GBPUSD is trading above the 1.32 mark, its highest level since March, as markets expect a Conservative victory in today’s UK election. An outright Conservative majority is set to break the Brexit impasse within Westminster, enabling the UK to leave the European Union by January 31. Should the official result fall in line with market expectations, any gains for GBPUSD are likely to be capped around 1.35 considering that much of this result has already been priced in. The polling stations close at 2200 GMT, when we also get the exit polls, which have historically been a reliable indicator for general election results.
Still, that doesn’t mean the UK election result is a done deal, considering that the UK political arena has thrown up huge surprises in recent years. A hung parliament or a surprise Labour victory could result in Sterling rapidly unwinding recent gains and falling back towards the mid-1.20s against the US Dollar.
Dollar weakens as Fed set to stand pat on US interest rates in 2020
The Dollar index (DXY) has weakened towards the 97 psychological level, taking its year-to-date gains to less than one percent, after Fed chair Jerome Powell signaled that the central bank is set to keep US interest rates unchanged through 2020. With the Fed seemingly raising the bar on US interest rate hikes, that leaves Dollar bulls with one less leg to stand on.
The DXY’s 2019 gains could come under further pressure if markets see another significant bout of risk-on sentiment However, should the Pound see a steep decline on either a hung parliament or a shock Labour victory, that could help alleviate the downward pressure on the Dollar index over the near-term.
Tumultuous Thursday ahead?
Besides the UK elections, there are other key events today that also warrant investors’ attention. The European Central Bank is set to make a policy decision, the first under its new President Christine Lagarde. Even though investors expect the bank to leave its current policy settings intact at this meeting, any clues on future policy direction from Lagarde could greatly influence the Euro’s outlook, considering that the new ECB President has already announced a policy review. Lagarde’s style and tone of communication will be key things to watch.
The signing of the ‘phase one’ US-China trade deal will continue to act as the primary driver for global market sentiment, as US President Donald Trump is reportedly set to meet his trade team today. Any indication of an agreement would be another shot in the arm for risk assets, although the unpredictability of US-China negotiations ensures that a sudden selloff in risk assets cannot be fully ruled out.
Disclaimer: The content in this article comprises personal opinions and should not be construed as containing personal and/or other investment advice and/or an offer of and/or solicitation for any transactions in financial instruments and/or a guarantee and/or prediction of future performance. ForexTime (FXTM), its affiliates, agents, directors, officers or employees do not guarantee the accuracy, validity, timeliness or completeness, of any information or data made available and assume no liability as to any loss arising from any investment based on the same.
How this company’s Alzheimer’s therapeutic compares to an advanced-stage competitor is outlined in a Dawson James Securities note.
In a Dec. 2 research note, Dawson James Securities analyst Jason Kolbert purported that Anavex Life Sciences Corp.’s (AVXL:NASDAQ) ANAVEX2-73 is “a better choice” than Biogen’s beta amyloid Alzheimer’s drug aducanumab.
Kolbert chose this time to highlight Anavex as a recent Barron’s report “highlighted a former colleague’s note discussing the likelihood that the firm’s beta amyloid Alzheimer’s drug aducanumab is not likely to get approved” by the FDA. Kolbert opined that it is surprising Biogen is even trying for approval as aducanumab had “mixed clinical results.”
“Our point here is not to argue the validity of Biogen’s data but to point out, by comparison, how compelling the Anavex data looks to us,” on all studies, from animal to recent clinical ones, he noted. Anavex is currently in a Phase 2b/3 trial, which could be done by year-end 2020. If so, commercialization could ensue by the end of 2022, he stated.
Kolbert highlighted that ANAVEX2-73 has a different mechanism of action in Alzheimer’s disease than aducanumab. Rather than focus on beta amyloid, it targets and activates the Sigma-1 receptor. “It is believed that Sigma 1 can help to protect a cell from the accumulation of misfolded proteins, acting to chaperone them out of the cell. As a result, cell metabolism (oxidative stress and mitochondrial dysfunction) are kept in balance.” Accordingly, it could have “an impact across a wide range of neurodegenerative diseases from Alzheimer’s to Parkinson’s and niche orphan diseases such as Rett syndrome, which may represent a ‘fast path’ to establish proof of concept, around Sigma-1 agonism,” Kolbert commented.
Dawson James has a Buy rating and a $16 per share target price on Anavex. The stock is currently trading at around $2.38 per share.
Disclosure: 1) Doresa Banning compiled this article for Streetwise Reports LLC and provides services to Streetwise Reports as an independent contractor. She or members of her household own securities of the following companies mentioned in the article: None. She or members of her household are paid by the following companies mentioned in this article: None. 2) The following companies mentioned in this article are billboard sponsors of Streetwise Reports: None. Click here for important disclosures about sponsor fees. 3) Comments and opinions expressed are those of the specific experts and not of Streetwise Reports or its officers. The information provided above is for informational purposes only and is not a recommendation to buy or sell any security. 4) The article does not constitute investment advice. Each reader is encouraged to consult with his or her individual financial professional and any action a reader takes as a result of information presented here is his or her own responsibility. By opening this page, each reader accepts and agrees to Streetwise Reports’ terms of use and full legal disclaimer. This article is not a solicitation for investment. Streetwise Reports does not render general or specific investment advice and the information on Streetwise Reports should not be considered a recommendation to buy or sell any security. Streetwise Reports does not endorse or recommend the business, products, services or securities of any company mentioned on Streetwise Reports. 5) From time to time, Streetwise Reports LLC and its directors, officers, employees or members of their families, as well as persons interviewed for articles and interviews on the site, may have a long or short position in securities mentioned. Directors, officers, employees or members of their immediate families are prohibited from making purchases and/or sales of those securities in the open market or otherwise from the time of the interview or the decision to write an article until three business days after the publication of the interview or article. The foregoing prohibition does not apply to articles that in substance only restate previously published company releases. 6) This article does not constitute medical advice. Officers, employees and contributors to Streetwise Reports are not licensed medical professionals. Readers should always contact their healthcare professionals for medical advice.
Disclosures for Dawson James Securities, Anavex Life Sciences Corp., December 2, 2019
The Firm does not make a market in the securities of the subject company(s). The Firm has NOT engaged in investment banking relationships with AVXL in the prior twelve months, as a manager or co-manager of a public offering and has NOT received compensation resulting from those relationships. The Firm may seek compensation for investment banking services in the future from the subject company(s). The Firm has not received any other compensation from the subject company(s) in the last 12 months for services unrelated to managing or co-managing of a public offering.
Neither the research analyst(s) whose name appears on this report nor any member of his (their) household is an officer, director or advisory board member of these companies. The Firm and/or its directors and employees may own securities of the company(s) in this report and may increase or decrease holdings in the future. As of November 30, 2019, the Firm as a whole did not beneficially own 1% or more of any class of common equity securities of the subject company(s) of this report. The Firm, its officers, directors, analysts or employees may affect transactions in and have long or short positions in the securities (or options or warrants related to those securities) of the company(s) subject to this report. The Firm may affect transactions as principal or agent in those securities.
Analysts receive no direct compensation in connection with the Firm’s investment banking business. All Firm employees, including the analyst(s) responsible for preparing this report, may be eligible to receive non-product or service specific monetary bonus compensation that is based upon various factors, including total revenues of the Firm and its affiliates as well as a portion of the proceeds from a broad pool of investment vehicles consisting of components of the compensation generated by investment banking activities, including but not limited to shares of stock and/or warrants, which may or may not include the securities referenced in this report.
Analyst Certification: The analyst(s) whose name appears on this research report certifies that 1) all of the views expressed in this report accurately reflect his (their) personal views about any and all of the subject securities or issuers discussed; and 2) no part of the research analysts compensation was, is, or will be directly or indirectly related to the specific recommendations or views expressed by the research analyst in this research report; and 3) all Dawson James employees, including the analyst(s) responsible for preparing this research report, may be eligible to receive non-product or service specific monetary bonus compensation that is based upon various factors, including total revenues of Dawson James and its affiliates as well as a portion of the proceeds from a broad pool of investment vehicles consisting of components of the compensation generated by investment banking activities, including but not limited to shares of stock and/or warrants, which may or may not include the securities referenced in this report.