A.I.S. Resources: A New Gold Prospect + Manganese Trading + Li Extraction Technology

By The Gold Report

Source: Peter Epstein for Streetwise Reports   12/11/2019

Peter Epstein of Epstein Research profiles a company that is reinventing itself as moderately diversified battery metals company.

In the midst of tax loss selling across many sectors—not just battery metals (lithium, cobalt, manganese, vanadium, etc.) but cannabis/hemp segments as well (and most other metals/mining/mineral sectors)—A.I.S. Resources Ltd. (AIS:TSX.V; AISSF:OTSQB) recently announced good news. Is the market ignoring ongoing positive developments at the company?

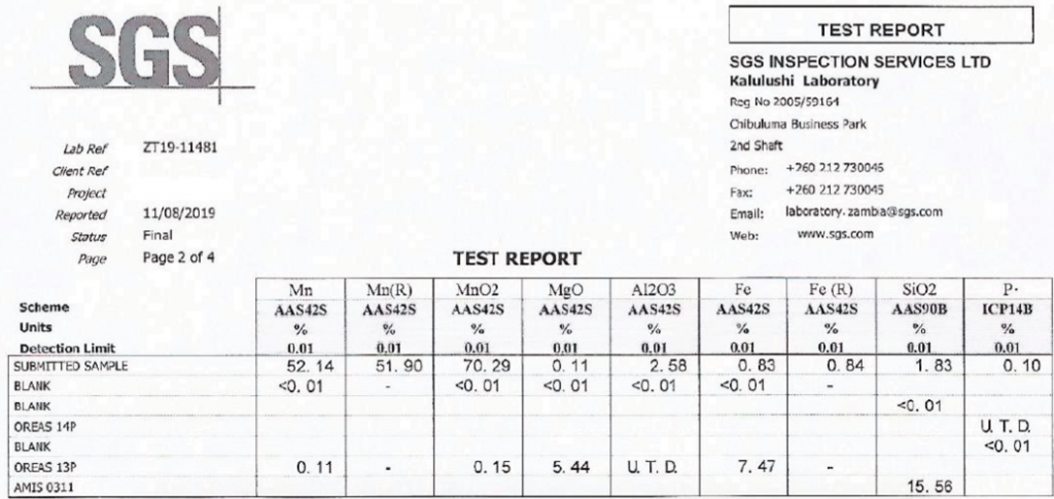
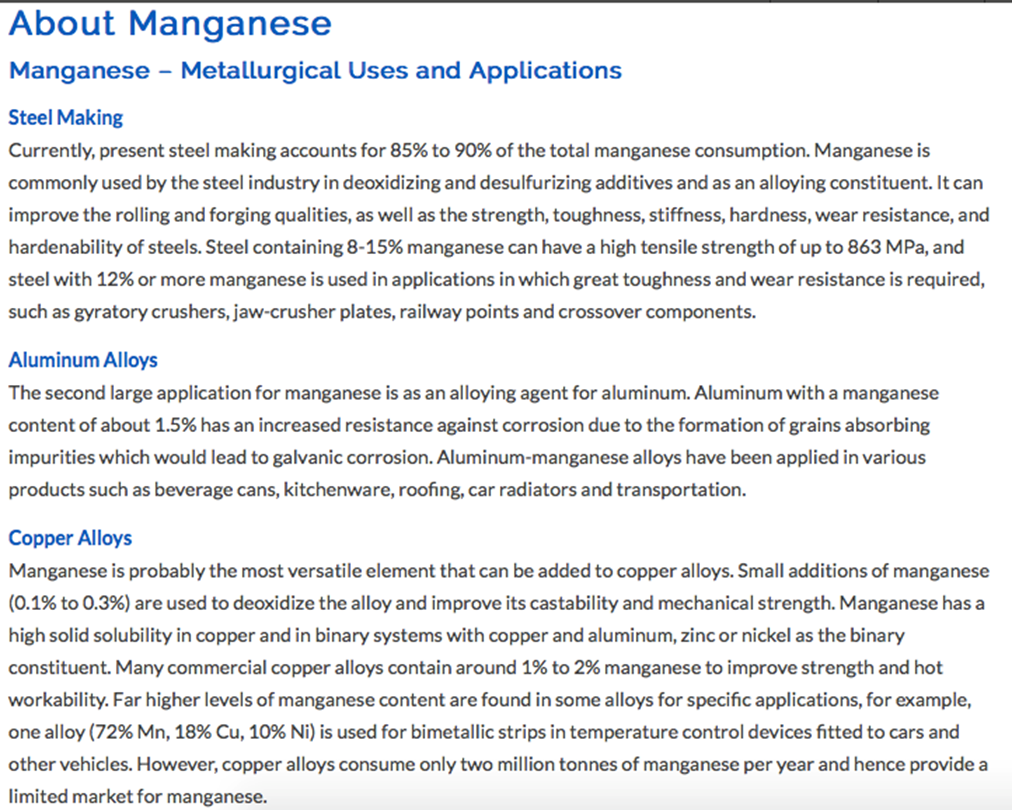
Management has successfully arranged for the supply of up to 30k tonnes/month of high-grade (48%–52%) Manganese (Mn) to China and is embarking on a trial shipment of 5–10k tonnes. Reaching this significant tonnage (which is not a sure thing) has been a consistent goal since April/May. If A.I.S. achieves 20k–30k tonnes/month, it would be an excellent outcome, assuming it can consistently deliver in that range.

Management has arranged the Mn sourcing with two African suppliers, and is negotiating a supply agreement with giant, multi-billion dollar Erdos Group, one of the world’s largest buyers of Mn. A.I.S. has issued a term sheet for a trial shipment of 5–10k tonnes, expected in January. The fact that Erdos is willing to work with A.I.S. is an impressive vote of confidence in the management team.

The trial shipment will reportedly gross ~US$2 million, subject to a final delivered grade of ~50% Mn. A.I.S. will be responsible for all logistics, including quality control, assays, shipping and related activities.

Additional suppliers from Brazil and Panama, among other places, have approached management about selling ore into A.I.S.’ trading strategy. Negotiations are underway. Importantly, detailed discussions are being held with trade and project financiers from London, Dubai and Canada to facilitate payments for the purchase and shipment of Mn ore to China. Although a risk factor, management believes that obtaining trade financing will not be problem.

This news comes on the heels of another positive development, but one that failed to capture investor’s need for instant gratification. On October 24th, management locked down an option to acquire an initial 51% interest in a gold mine in northern Peru. The mine is currently producing small quantities of gold.

After completing due diligence and determining the extent and concentration of gold mineralization, A.I.S. will contribute US$500k worth of equipment and technical expertise to increase mine productivity. Low-cost due diligence efforts will focus on drilling, soil sampling, mapping and design of a process circuit. The target is 8–10 vein systems with up to 5,000 tonnes of ore in each, grading 10g/t Au or better.

Investors have questions about this new gold project: How long will it take to do proper due diligence? Will A.I.S. need to raise additional equity capital? Company-wide funding is a concern; management needs to come up with trade finance for Mn trading, cash or a gold loan for the new gold project, and US$1 million for a 15% investment in a private lithium extraction technology company.

Readers may recall that on October 8th, A.I.S. signed an option agreement with Ekos Research, requiring an investment of US$1 million, for a 15% stake in a breakthrough lithium solvent extraction process that produces lithium chloride with 99.2% purity, but more importantly can manage high-magnesium bearing brines found in salars in Argentina like Rincón and Salinas Grandes.

Rapid lithium extraction (without solar evaporation ponds), with high recoveries and purity levels, and a strong environmental profile, is the holy grail. There are dozens of technologies in the works, but none (that I’m aware of) are operating at full commercial scale anywhere in the world.

Management gave me an example of a 20,000 tonne per year lithium carbonate plant that could reduce its cap-ex from $560 million to $210 million by using this new technology. With no evaporation ponds, the process can easily be turned on and off, and there’s no ground water issues.

How far will US$1 million take this emerging technology? While I have respect for the A.I.S. technical team being able to expertly evaluate a promising lithium extraction technology, it could take years to reach meaningful cash flow (net to the company’s 15% interest).

Ekosolve is building a semi-commercial scale demonstration plant for under US$1 million, so the cash contributed by A.I.S will go directly into this demonstration plant with a nine-month build. I’m told there is at least one producer having their brines tested now.

Is management spreading themselves too thin? The company is now reportedly pursuing three projects at once; lithium technology, manganese trading and a gold joint venture, spanning several countries (Peru, Australia, Tanzania, China). Management doesn’t think so, and they’re only actively spending on Mn trading at the moment. Gold project due diligence costs are said to be minimal.

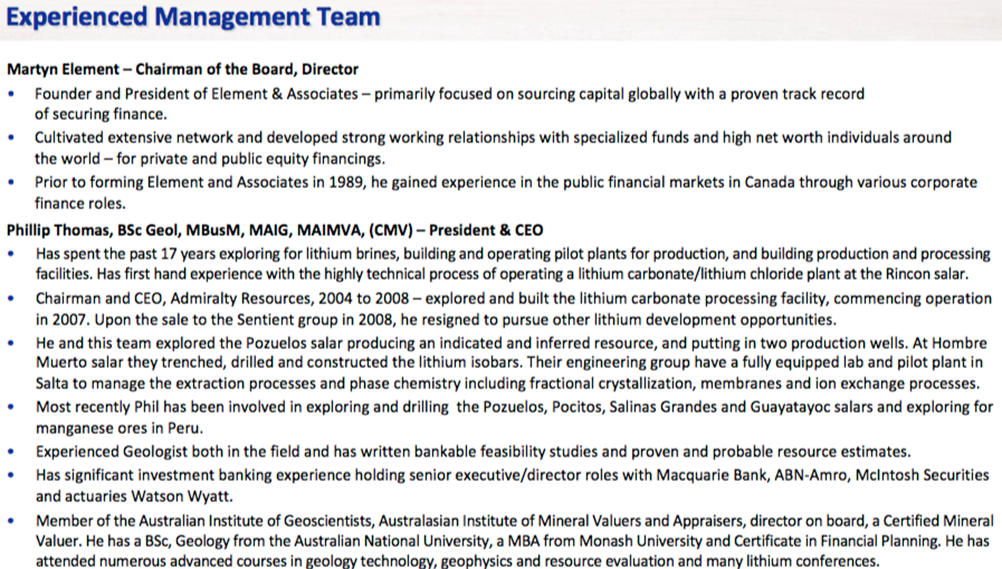
CEO Phil Thomas has more than 17 years’ experience in lithium technologies being highly qualified in geochemistry especially lithium, worked for more than 15 years in trading ores and has explored and operated five gold mines, with eight staff in Peru and two in China. Phil is based in Australia.

Yes, the shares of A.I.S. Resources remain highly speculative, but the upside potential is bigger than ever before. Can a company with a $3.8 million market cap (83.4 million shares at $0.045) move its Mn project forward over the next 3, 6, 12 months without massive equity dilution?

I like the diversification here, Mn, Au (gold) + a Li extraction technology. Management saw the decline in lithium prices and prudently dropped their Guayatayoc lithium project. Consider the difference in pricing of lithium (down a lot) and gold (up moderately). A year ago, A.I.S. was solely an Argentina lithium brine play. If management had not branched out into other sectors, the company would be dead in the water like many others in South America’s Lithium Triangle.

If all goes according to plan, which is rarely the case for somewhat complex logistical operations, A.I.S. has the opportunity to become cash flow positive within six months. I think it’s great that cash flow from Mn trading could be deployed into a gold project rather than a lithium brine story in Argentina.

Although the avoidance of further equity dilution is very important to the management team, readers should probably assume some equity issuance as a necessary evil. A.I.S. should be able to get by with a modest raise before reaching cash flow break even next year. There’s reason to expect only minimal equity dilution because management believes it can secure trade/working capital financing. The announcement of non-dilutive financing working cap would be a tremendous de-risking event.

Bottom line, A.I.S. Resources (TSX-V – AIS, OTCQB: AISSF) is worth a lot more than $3.8 million if it can reach 20k–30k tonnes/month of Mn trading. Management has a number of boxes checked in this endeavor, but there are more boxes to tick.

Working with Erdos and sending them a sizable (trial) bulk shipment is great news, but timing is everything. A three-month delay in reaching 20k–30k tonnes/month could make a big difference in the number of shares outstanding.

However, to reiterate, if all goes reasonably as planned, there’s substantial upside from the current $3.8 million valuation.

Peter Epstein is the founder of Epstein Research. His background is in company and financial analysis. He holds an MBA degree in financial analysis from New York University’s Stern School of Business.

Sign up for our FREE newsletter at: www.streetwisereports.com/get-news

Disclosures: The content of this article is for information only. Readers fully understand and agree that nothing contained herein, written by Peter Epstein of Epstein Research [ER], (together, [ER]) about A.I.S. Resources, including but not limited to, commentary, opinions, views, assumptions, reported facts, calculations, etc. is not to be considered implicit or explicit investment advice. Nothing contained herein is a recommendation or solicitation to buy or sell any security. [ER] is not responsible under any circumstances for investment actions taken by the reader. [ER] has never been, and is not currently, a registered or licensed financial advisor or broker/dealer, investment advisor, stockbroker, trader, money manager, compliance or legal officer, and does not perform market making activities. [ER] is not directly employed by any company, group, organization, party or person. The shares of A.I.S. Resources are highly speculative, not suitable for all investors. It is assumed and agreed upon by readers that they will consult with their own licensed or registered financial advisors before making any investment decisions.

At the time this article was posted, Peter Epstein owned no shares of A.I.S. Resources and the Company was an advertiser on [ER].

Readers understand and agree that they must conduct their own due diligence above and beyond reading this article. While the author believes he’s diligent in screening out companies that, for any reasons, are unattractive investment opportunities, he cannot guarantee that his efforts will (or have been) successful. [ER] is not responsible for any perceived, or actual, errors including, but not limited to, commentary, opinions, views, assumptions, reported facts, financial calculations, etc., or for the completeness of this interview or future content. [ER] is not expected or required to subsequently follow or cover events & news, or write about any particular company. [ER] is not an expert in any company, industry sector or investment topic.

Streetwise Reports Disclosure:
1) Peter Epstein’s disclosures are listed above.
2) The following companies mentioned in the article are billboard sponsors of Streetwise Reports: None. Click here for important disclosures about sponsor fees. The information provided above is for informational purposes only and is not a recommendation to buy or sell any security.
3) Statements and opinions expressed are the opinions of the author and not of Streetwise Reports or its officers. The author is wholly responsible for the validity of the statements. The author was not paid by Streetwise Reports for this article. Streetwise Reports was not paid by the author to publish or syndicate this article. Streetwise Reports requires contributing authors to disclose any shareholdings in, or economic relationships with, companies that they write about. Streetwise Reports relies upon the authors to accurately provide this information and Streetwise Reports has no means of verifying its accuracy.

4) The article does not constitute investment advice. Each reader is encouraged to consult with his or her individual financial professional and any action a reader takes as a result of information presented here is his or her own responsibility. By opening this page, each reader accepts and agrees to Streetwise Reports’ terms of use and full legal disclaimer. This article is not a solicitation for investment. Streetwise Reports does not render general or specific investment advice and the information on Streetwise Reports should not be considered a recommendation to buy or sell any security. Streetwise Reports does not endorse or recommend the business, products, services or securities of any company mentioned on Streetwise Reports.
5) From time to time, Streetwise Reports LLC and its directors, officers, employees or members of their families, as well as persons interviewed for articles and interviews on the site, may have a long or short position in securities mentioned. Directors, officers, employees or members of their immediate families are prohibited from making purchases and/or sales of those securities in the open market or otherwise from the time of the interview or the decision to write an article until three business days after the publication of the interview or article. The foregoing prohibition does not apply to articles that in substance only restate previously published company releases.

( Companies Mentioned: AIS:TSX.V,
)

EURUSD: euro stronger after UK general election

By Alpari.com

On Thursday the 12th of December, the EURUSD pair was two points down at the close of trading. The euro noticeably weakened during the American session. Pressure was exerted on the single currency by the rallying US dollar, and the reaction to Christine Lagarde’s speech at the ECB meeting.

As expected, the European Central Bank upheld the current interest rate channel of monetary policy, but made minor changes to GDP forecasts and raised its inflation forecast for 2020.

The dollar was boosted by the news of the trade deal between China and the United States finally being agreed. Trump posted on his Twitter that: “we are close to concluding a major deal with China. They want to conclude it, just like us! ” Bloomberg later reported that US President Donald Trump had signed off on the trade deal between the US and China to prevent planned tariff hikes coming into force on December 15.

Agreed in the trade deal:

  • The rollback of existing tariff rates for Chinese goods;
  • The abolition of new tariffs, which were due to enter into force on Sunday;
  • China will purchase agricultural products worth $50 billion USD in 2020 (along with energy and other goods);
  • The United States will reduce the tariff rate for many types of Chinese imports (currently by 15-25%).

Today’s events (GMT+3):

  • 16:30 USA: Retail Sales Control Group (Nov).
  • 19:00 USA: Fed’s Williams speech.
  • 21:00 USA: Baker Hughes US Oil Rig Count.

Рис. 1Current situation:

In Asia, the euro and the pound are trading in positive territory. The euro’s state of flux was 100 points, and GBP – 450 points. Sharp fluctuations in the market were seen in reaction to the initial results of the UK general election. The Conservative Party won the election, winning enough seats to create a ruling majority in the UK House of Commons.

The price has fallen away from 135th degree. The pound also calmed down for a while. The correction was brief. Bulls refuse to lock-in profits, expecting further growth. The GBP price is located in the off-peak zone at the hourly TF, therefore, after a rally of 450 points, it is better to take profits and start afresh after the correction.

Bloomberg reports that US President Donald Trump has agreed on the first phase of a trade deal with China, and signed it. The dollar has strengthened, now we should see a correction, and risky assets should gain in strength. However, since the main movement came at the transition of the day, according to the forecast, we are waiting to see a correction to the balance line – 1.1146 (45th). If the fall ends up quicker, then a correction is more likely to 1.1135. The ECB’s monetary policy will deter the euro from strengthening.

By Alpari.com

The Analytical Overview of the Main Currency Pairs on 2019.12.13

by JustForex

The EUR/USD currency pair

Technical indicators of the currency pair:
  • Prev Open: 1.11289
  • Open: 1.11501
  • % chg. over the last day: +0.48
  • Day’s range: 1.11369 – 1.11992
  • 52 wk range: 1.0884 – 1.1623

The EUR/USD currency pair continues to show positive dynamics. EUR updated key extremes. Quotes are currently being consolidated. The trading tool found resistance at 1.11900. 1.11450 is already a mirror support. The ECB, as expected, kept the basic parameters of monetary policy at the same level. The mood of financial market participants improved amid positive news about the conclusion of the first stage of a trade agreement between Washington and Beijing. We recommend you to keep track of current information on this issue. Open positions from key levels.

At 15:30 (GMT+2:00), a report on US retail sales will be published.

EUR/USD

The price has fixed above 50 MA and 100 MA, which signals the power of buyers.

The MACD histogram is in the positive zone, but below the signal line, which gives a weak signal to buy EUR/USD.

The Stochastic Oscillator is in the neutral zone, the %K line is above the %D line, which indicates bullish sentiment.

Trading recommendations
  • Support levels: 1.11450, 1.11100, 1.10900
  • Resistance levels: 1.11900, 1.12300

If the price consolidates above the resistance level of 1.11900, expect further growth toward 1.12200-1.12400.

Alternatively, the quotes could drop toward 1.11200-1.11000.

The GBP/USD currency pair

Technical indicators of the currency pair:
  • Prev Open: 1.31964
  • Open: 1.33362
  • % chg. over the last day: +2.11
  • Day’s range: 1.33362 – 1.35147
  • 52 wk range: 1.1959 – 1.3385

The GBP/USD currency pair is showing aggressive purchases. GBP has updated annual highs against the greenback. According to exit polls, the conservative party of Boris Johnson showed a landslide victory in the election. Currently, GBP/USD quotes are consolidating. The local support and resistance levels are 1.33400 and 1.34500, respectively. The trading instrument has the potential for further growth. We recommend opening positions from key levels.

The Economic News Feed for 13.12.2019 is calm.

GBP/USD

Indicators point to the power of buyers: the price is being traded above 50 MA and 100 MA.

The MACD histogram is in the positive zone, but below the signal line, which gives a weak signal to buy GBP/USD.

The Stochastic Oscillator is near the oversold zone, the %K line crossed the %D line. There are no signals at this time.

Trading recommendations
  • Support levels: 1.33400, 1.32300, 1.31650
  • Resistance levels: 1.34500, 1.35150

If the price consolidates above 1.34500, expect further growth toward 1.35250-1.35750.

Alternatively, the quotes could descend toward 1.32600-1.32300.

The USD/CAD currency pair

Technical indicators of the currency pair:
  • Prev Open: 1.31723
  • Open: 1.31830
  • % chg. over the last day: +0.04
  • Day’s range: 1.31507 – 1.31835
  • 52 wk range: 1.2727 – 1.3664

The USD/CAD currency pair is still dominated by a bearish sentiment. At the moment, quotes are testing key lows. Demand for CAD is supported by the positive dynamics of oil prices. The local support and resistance levels are: 1.31500 and 1.31750, respectively. The Canadian dollar has the potential for further growth relative to the US currency. Open positions from key levels.

The Economic News Feed for 13.12.2019 is calm.

USD/CAD

Indicators point to the power of sellers: the price is being traded below 50 MA and 100 MA.

The MACD histogram is in the negative zone, but above the signal line, which gives a weak signal to sell USD/CAD.

The Stochastic Oscillator is in the neutral zone, the %K line is below the %D line, which also indicates a bearish sentiment.

Trading recommendations
  • Support levels: 1.31500, 1.31200
  • Resistance levels: 1.31750, 1.32000, 1.32250

If the price consolidates below 1.31500, expect the quotes to descend toward 1.31200-1.31000

Alternatively, the quotes could correct toward 1.32000-1.32200.

The USD/JPY currency pair

Technical indicators of the currency pair:
  • Prev Open: 108.550
  • Open: 109.197
  • % chg. over the last day: +0.78
  • Day’s range: 109.131 – 109.678
  • 52 wk range: 104.97 – 114.56

The USD/JPY currency pair is showing a steady uptrend. The trading tool has updated local highs. Demand for the safe haven currencies weakened amid positive news about the conclusion of the first phase of a trade agreement between Washington and Beijing. At the moment, USD/JPY quotes are consolidating in the range 109.400-109.700. We recommend that you pay attention to the dynamics of yield on US government bonds. Open positions from key levels.

Some controversial economic releases from Japan were published in the Asian trading session.

USD/JPY

Indicators point to the strength of buyers: the price has fixed above 50 MA and 100 MA.

The MACD histogram is in the positive zone, but below the signal line, which gives a weak signal to buy USD/JPY.

The Stochastic Oscillator is in the neutral zone, the %K line is crossing the %D line. There are no exact signals.

Trading recommendations
  • Support levels: 109.400, 109.200, 108.950
  • Resistance levels: 109.700, 110.000

If the price consolidates above 109.700, expect the quotes to rise toward 110.000-110.200.

Alternatively, the quotes could descend toward 109.200-109.000.

by JustForex

High US Retail Sales expectations – The USD/JPY set to test 108?

By Admiral Markets

Economic Event

Source: Economic Events December 13, 2019 – Admiral Markets’ Forex Calendar

After the Fed rate decision last Wednesday, we want to concentrate on the USD/JPY and the upcoming release of US Retail Sales data into the weekly close.

The Fed, as expected, didn’t announce a rate cut, and presented a ‘balanced’ statement, the Fed dot plot likewise signalled no interest rate changes in 2020, and the Fed Watch Tool remained at an expectation of around 60% of at least one 25 basis point cut for 2020, which resulted in subdued volatility in the USD/JPY, US Retail Sales could change that today.

Last month, US retail trade rose 0.3 percent from a month earlier, reversing a 0.3 percent drop in September and beating market expectations of 0.2 percent. The rebound in trade was driven by motor vehicle sales and higher gasoline prices, but expectations of 0.5% seem a little too optimistic and any disappointment could push the Greenback lower.

In addition to that, comments from the BoJ on Wednesday stated that it expects a sizable impact from the economic package from prime minister Shinzo Abe and that the BoJ could, as a result, modify its GDP forecast in January.

That said, we remain cautious in regards to an overly bearish USD/JPY outlook into the weekly, but also yearly close (probably especially with the current erratic developments around the trade ‘deal’ between the US and China and open question whether and how US tariffs on Chinese goods from December 15, will go into effect), but still consider the USD/JPY an attractive Short candidate with a first target on the downside around 108.00 where a break lower activates 106.80/107.00:

Source: Admiral Markets MT5 with MT5-SE Add-on USD/JPY Daily chart (between 04 October 2018 to 12 December 2019). Accessed: 12 December 2019 at 10:00 PM GMT – Please note: Past performance is not a reliable indicator of future results, or future performance.

In 2014, the value of the USD/JPY increased by 13.7%, in 2015, it increased by 0.5%, in 2016, it fell by 2.8%, in 2017, it fell by 3.6%, in 2018, it fell by 2.7%, meaning that after five years, it was up by 4.1%.

Discover the world’s #1 multi-asset platform

Admiral Markets offers professional traders the ability to trade with a custom, upgraded version of MetaTrader 5, allowing you to experience trading at a significantly higher, more rewarding level. Experience benefits such as the addition of the Market Heat Map, so you can compare various currency pairs to see which ones might be lucrative investments, access real-time trading data, and so much more. Click the banner below to start your FREE download of MT5 Supreme Edition!

Download MetaTrader 5 and begin trading today!

Disclaimer: The given data provides additional information regarding all analysis, estimates, prognosis, forecasts or other similar assessments or information (hereinafter “Analysis”) published on the website of Admiral Markets. Before making any investment decisions please pay close attention to the following:

  1. This is a marketing communication. The analysis is published for informative purposes only and are in no way to be construed as investment advice or recommendation. It has not been prepared in accordance with legal requirements designed to promote the independence of investment research, and that it is not subject to any prohibition on dealing ahead of the dissemination of investment research.
  2. Any investment decision is made by each client alone whereas Admiral Markets shall not be responsible for any loss or damage arising from any such decision, whether or not based on the Analysis.
  3. Each of the Analysis is prepared by an independent analyst (Jens Klatt, Professional Trader and Analyst, hereinafter “Author”) based on the Author’s personal estimations.
  4. To ensure that the interests of the clients would be protected and objectivity of the Analysis would not be damaged Admiral Markets has established relevant internal procedures for prevention and management of conflicts of interest.
  5. Whilst every reasonable effort is taken to ensure that all sources of the Analysis are reliable and that all information is presented, as much as possible, in an understandable, timely, precise and complete manner, Admiral Markets does not guarantee the accuracy or completeness of any information contained within the Analysis. The presented figures refer that refer to any past performance is not a reliable indicator of future results.
  6. The contents of the Analysis should not be construed as an express or implied promise, guarantee or implication by Admiral Markets that the client shall profit from the strategies therein or that losses in connection therewith may or shall be limited.
  7. Any kind of previous or modeled performance of financial instruments indicated within the Publication should not be construed as an express or implied promise, guarantee or implication by Admiral Markets for any future performance. The value of the financial instrument may both increase and decrease and the preservation of the asset value is not guaranteed.
  8. The projections included in the Analysis may be subject to additional fees, taxes or other charges, depending on the subject of the Publication. The price list applicable to the services provided by Admiral Markets is publicly available from the website of Admiral Markets.
  9. Leveraged products (including contracts for difference) are speculative in nature and may result in losses or profit. Before you start trading, you should make sure that you understand all the risks.

By Admiral Markets

Britain on course for Brexit after Conservatives win big

By Lukman Otunuga, Research Analyst, ForexTime

After almost three and a half years since Britain voted to leave the European Union, the country is finally on track to sever its ties with the continent next month as results forecast the Conservatives winning a clear majority.

If it is confirmed that UK Prime Minister Boris Johnson has secured a decisive election victory with a majority of around 85 seats, this will be warmly received by investors seeking clarity and direction on Brexit.  This sentiment has already been reflected in Sterling which has appreciated against every single G10 currency and jumped 2.7% versus the Dollar to breach 1.35 – its highest level since May 2018. While the pound is positioned to push higher on Brexit optimism, the longer-term outlook may be clouded by how easy the withdrawal agreement will pass through Parliament and what happens during the transition period.

Given that lawmakers will return to the House of Commons on December 17, Johnson will waste no time in ‘getting Brexit done’ by pushing through the withdrawal agreement as soon as possible. Even if the process is smooth sailing from here and MP’s sign off the agreement before January 31 next year, this is only part one of the complicated Brexit saga. Once the temporary sugar rush offered by the withdrawal agreement diminishes, investors are then likely to turn their attention to the 11-month transition period the UK needs to negotiate a new trade relationship with the EU. Will that time be enough to formulate a new deal, or will the UK decide on extending the transition period by up to a further two years?

As the dust settles, investors may start re-evaluating the threat of a no-deal Brexit by the end of next year amid fears over the UK failing to reach a trade agreement with the European Union. Without a post-Brexit deal, Britain will revert to World Trade Organization (WTO) rules to trade with the European Union which could see additional tariffs and quotas on a range of goods. The reality of more drama and uncertainty looming in the year ahead has the potential to cap gains on the British Pound.

With regard to the technical picture, GBPUSD is strongly bullish on the daily chart. Prices have jumped over 300 pips within the past few hours with buyers currently in the driving seat. A solid breakout above 1.35 should encourage a push higher towards 1.36. However, should 1.35 prove to be a stubborn resistance level, GBPUSD could decline back towards 1.3380, this year’s previous high set in March.

Disclaimer: The content in this article comprises personal opinions and should not be construed as containing personal and/or other investment advice and/or an offer of and/or solicitation for any transactions in financial instruments and/or a guarantee and/or prediction of future performance. ForexTime (FXTM), its affiliates, agents, directors, officers or employees do not guarantee the accuracy, validity, timeliness or completeness, of any information or data made available and assume no liability as to any loss arising from any investment based on the same.


Forex-Time-LogoArticle by ForexTime

ForexTime Ltd (FXTM) is an award winning international online forex broker regulated by CySEC 185/12 www.forextime.com

Pound surges as UK elections’ exit polls point to Conservatives majority

By Han Tan, Market Analyst, ForexTime

GBPUSD has gained over two percent to breach 1.35, reaching its highest level since May 2018, as the UK election’s exit polls show the Conservatives winning a clear majority. The Pound is also currently at its strongest level versus the Euro since June 2016, with Sterling also gaining against all other G10 currencies. If the official results indeed prove as much over the coming hours, a Conservative majority would pave the way for Boris Johnson’s Brexit deal to be approved in parliament by end-January 2020, while alleviating concerns over the UK’s economic outlook.

However, once the initial euphoria settles, investors are then likely to turn their attentions to the transition period that the UK needs in order to formulate its future relationship with its largest trading partner, the European Union. That could make for another bumpy ride for the Pound in 2020. At least Sterling bulls can enjoy their time in the sun now, while knowing that the support level for GBPUSD has been raised significantly, given that the UK election risk has passed.


Disclaimer: The content in this article comprises personal opinions and should not be construed as containing personal and/or other investment advice and/or an offer of and/or solicitation for any transactions in financial instruments and/or a guarantee and/or prediction of future performance. ForexTime (FXTM), its affiliates, agents, directors, officers or employees do not guarantee the accuracy, validity, timeliness or completeness, of any information or data made available and assume no liability as to any loss arising from any investment based on the same.


Forex-Time-LogoArticle by ForexTime

ForexTime Ltd (FXTM) is an award winning international online forex broker regulated by CySEC 185/12 www.forextime.com

Global markets rally on US-China deal hopes

By IFCMarkets

Dollar weakening halts

US stocks rally was intact on Thursday on US-China trade deal hopes. President Trump tweeted “Getting VERY close to a BIG DEAL with China.” The S&P 500 rallied 0.9% to new record 3168.58. The Dow Jones industrial average gained 0.8% to 28132.05. Nasdaq composite index advanced 0.7% to fresh record 8717.32. The dollar weakening continued at steady pace after the Federal Reserve left interest rates unchanged on Wednesday while New York Federal Reserve said on Thursday it would increase the amount of funds it would inject into the multi trillion dollar repo market: live dollar index data show the ICE US Dollar index, a measure of the dollar’s strength against a basket of six rival currencies, lost 0.4% to 96.72 but is higher currently. Futures on US stock indices point to sharply higher openings today.

FTSE 100 leads European indexes gains as Conservatives win elections

European stock markets advanced on Thursday. Both the EUR/USD and GBP/USD accelerated their climbs yesterday, with Pound higher currently while euro turning lower. The European Central Bank kept its main deposit rate at negative 0.5%, leaving its rate of asset purchases at €20 billion a month, as widely expected by markets. The Stoxx Europe 600 index ended 0.5% higher led by auto, basic resources and bank shares. Germany’s DAX 30 advanced 0.6% to 13221.64. France’s CAC 40 added 0.4% and UK’s FTSE 100 rose 0.8% to 7273.47. Thursday’s general election results show the conservative party won majority.

Nikkei leads Asian indexes rally

Asian stock indices are sharply higher today. Nikkei ended up 2.6% at 24023.10 with yen slide against dollar continuing. Chinese stocks are rising following reports US trade negotiators had offered to cancel new China tariffs and reduce existing levies on Chinese goods by up to 50% on $360 billion worth of imports: the Shanghai Composite Index is up 1.8% and Hong Kong’s Hang Seng Index is 2.3% higher. Australia’s All Ordinaries Index gained 0.5% as Australian dollar halted its climb against the greenback.

Brent advance continues

Brent futures prices are extending gains today. Prices ended higher yesterday after reports Washington and Beijing are very close to signing the phase one trade deal. February Brent crude rose 0.8% to $64.20 a barrel on Thursday. And rising oil prices support the Initial Public Offering (IPO) of Saudi Arabia’s largest oil company – Aramco. Shares of Aramco started trading on the Saudi Stock Exchange, known as Tadawul, on Wednesday. And Saudi Aramco valuation climbed to $2 trillion from $1.7 trillion on its second day of trading yesterday. The IPO is open to investors who have a certain amount of assets, and is structured so that Saudi citizens get extra shares if they stay invested in the company for six months. After six months the company can be listed on other international exchanges.

BRENT testing MA(200)    12/13/2019 Market Overview IFC Markets chart

Gold inching up

Gold prices are recovering today. Prices ended lower yesterday after news China and the US reached a phase one trade deal in principle. February gold lost 0.1% to $1473.40 an ounce Thursday as the uncertainty of the unresolved trade dispute subsided.

Market Analysis provided by IFCMarkets

Note:
This overview has an informative and tutorial character and is published for free. All the data, included in the overview, are received from public sources, recognized as more or less reliable. Moreover, there is no guarantee that the indicated information is full and precise. Overviews are not updated. The whole information in each overview, including opinion, indicators, charts and anything else, is provided only for familiarization purposes and is not financial advice or а recommendation. The whole text and its any part, as well as the charts cannot be considered as an offer to make a deal with any asset. IFC Markets and its employees under any circumstances are not liable for any action taken by someone else during or after reading the overview.

Coffee, Kobe Steel and Tullow Oil PLC lead the Weekly Top Gainers/Losers

By IFCMarkets

Top Gainers – The World Market

1. Coffee – CFD for Arabica coffee brand.

2. Kobe Steel, Ltd. –Japanese steel company

market sentiment ratio long short positions

 Top Losers – The World Market

1. Tullow Oil PLC – British oil and gas company.

2. Boral Ltd – Australian manufacturer of building materials.

market sentiment ratio long short positions

 Top Gainers – Foreign Exchange Market (Forex)

1. EURZAR, USDZAR – the growth of these charts means the weakening of the South African rand against the euro and the US dollar.

2. GBPAUD, EURTRY, USDTRY -The growth of these charts means the strengthening of the British pound against the Australian dollar, as well as the euro and the US dollar against the Turkish lira.

market sentiment ratio long short positions

 Top Losers – Foreign Exchange Market (Forex)

1. USDMXN, EURMXN – The decrease in these charts means the weakening of the US dollar and euro against the Mexican peso.

2. USDRUB, EURRUB – The decrease in these charts means the weakening of the US dollar and the euro against the Russian ruble.

market sentiment ratio long short positions

Market Analysis provided by IFCMarkets

Note:
This overview has an informative and tutorial character and is published for free. All the data, included in the overview, are received from public sources, recognized as more or less reliable. Moreover, there is no guarantee that the indicated information is full and precise. Overviews are not updated. The whole information in each overview, including opinion, indicators, charts and anything else, is provided only for familiarization purposes and is not financial advice or а recommendation. The whole text and its any part, as well as the charts cannot be considered as an offer to make a deal with any asset. IFC Markets and its employees under any circumstances are not liable for any action taken by someone else during or after reading the overview.

ECB & UK Elections In Focus

By Orbex

USD Down Following Flat FOMC

The US dollar has recovered so far across the European morning on Thursday following a sharp sell-off last night in reaction to the December FOMC meeting. The Fed kept rates unchanged, as expected. But, it seems traders were disappointed by the lack of hawkish signals.

Although the statement itself was a little more positive than last time, there was not much in the way of new information. The Fed said that current policy levels remain appropriate. However, it will be monitoring incoming data. USD index trades 97.17 last, up off the post-FOMC 97.01 lows.

ECB On Watch

EURUSD is retreating so far on Thursday as the recovery in USD weighs on price. Looking ahead today, the main focus is the ECB meeting which will be the first headed by new ECB chief Lagarde.

We expect no policy changes. However, traders will be keen to hear Lagarde’s outlook to judge whether we are likely to see ECB easing in Q1 2020.

So far, Lagarde has said that the ECB will remain committed to achieving its inflation target. This supports the view that she will continue with Draghi’s easing program. As such, any dovish guidance from Lagarde today will likely weigh on EUR. EURUSD trades 1.1126 last.

All Eyes on UK Elections

GBPUSD has paused near recent highs as the UK takes to the polls today. The outcome of these elections will have a direct impact on the outlook for Brexit.

It could cause significant volatility in GBP if we see anything other than a clear Conservative party win, which would keep GBP supported. While polls continue to point to a win for the Tories, the specter of recent political shocks is present and caution is advised today. GBPUSD trades 1.3204 last.

Risk Sentiment Remains Firm

Risk assets remain buoyant on Thursday morning as the Fed delivered a fairly muted meeting statement reiterating its message that it will remain on hold for now but will be monitoring incoming data. The meeting was kept the door to further easing still ajar, seeing SPX500 trading back up to 3147.83 last.

JPY & Gold Lower

Safe havens have been weaker so far today, weighed on by a stronger US dollar and better risk appetite. XAUUSD trades 1473.09 last, retreating from yesterday’s post-FOMC highs.USDJPY trades 108.68 last, making its way back up off yesterday’s lows.

Crude Shrugs Off Bearish EIA Report

Oil prices remain supported today. Despite the EIA reporting another rise in US crude stores last week, it seems that the recent OPEC cuts along with optimism over a US-China trade deal are helping keep crude sentiment positive. Crude trades 58.96 last, holding just below the 60 level for now, in the upper part of the recent bullish channel.

Loonie Breaks Support

USDCAD has had a quiet morning so far but is attempting to break higher. For now, price is sitting at the bottom of the heavy declines seen yesterday which took the pair back down below the 1.3207 level to trade 1.3170 last.

AUD Holding Near Highs

AUDUSD has been a little flat over early European trading today though remain supported near yesterday’s highs. The sell-off in USD helped AUD rally firmly yesterday trading up to highs of .6889 before softening a little. With optimism over a US/China trade deal there is room for a further push to the upside if new US tariffs are postponed this weekend.

By Orbex


LCATTLE Analysis: Lower US beef exports bearish for LCATTLE

By IFCMarkets

Lower US beef exports bearish for LCATTLE

US beef exports are lower this year. Will the LCATTLE decline?

US beef exports are lower this year compared to the same periods a year ago, according to the USDA data. Beef exports in October declined 8% from last year’s high volume to 108017 tons. October beef exports declined 11% in value to $649.1 million. And for the January to October period beef exports declined 2.5%, equal to $6.75 billion decline in value from last year’s record shipments. For the first ten months of 2019, exports accounted for 14.1% of total beef production. Lower export is bearish for LCATTLE.

LCATTLE testing support 12/12/2019 Technical Analysis IFC Markets chart

On the daily timeframe the LCATTLE: D1 is testing a support line above the 200-day moving average MA(200) which is level.

  • The Parabolic indicator gives a sell signal.
  • The Donchian channel indicates no trend: it is flat.
  • The MACD indicator gives a bearish signal: it is above the signal line and the gap is narrowing.
  • The RSI oscillator has formed a bearish divergence above the 50 level.

We believe the bearish momentum will continue after the price breaches below the lower boundary of Donchian channel at 123.67. This level can be used as an entry point for placing a pending order to sell. The stop loss can be placed above the upper Donchian boundary at 126.52. After placing the order, the stop loss is to be moved every day to the next fractal high, following Parabolic signals. Thus, we are changing the expected profit/loss ratio to the breakeven point. If the price meets the stop loss level (123.67) without reaching the order (126.52), we recommend cancelling the order: the market has undergone internal changes which were not taken into account.

Technical Analysis Summary

OrderSell
Sell stopBelow 123.67
Stop lossAbove 126.52

Market Analysis provided by IFCMarkets