Technical Analyst: Gold’s Downtrend Has Further to Run

By The Gold Report

Source: Clive Maund for Streetwise Reports   12/12/2019

Technical analyst Clive Maund looks at recent moves in gold and their correlation to the dollar.

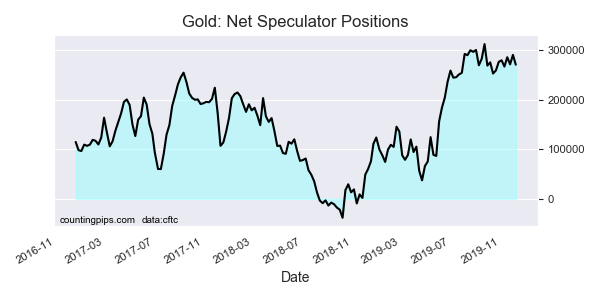
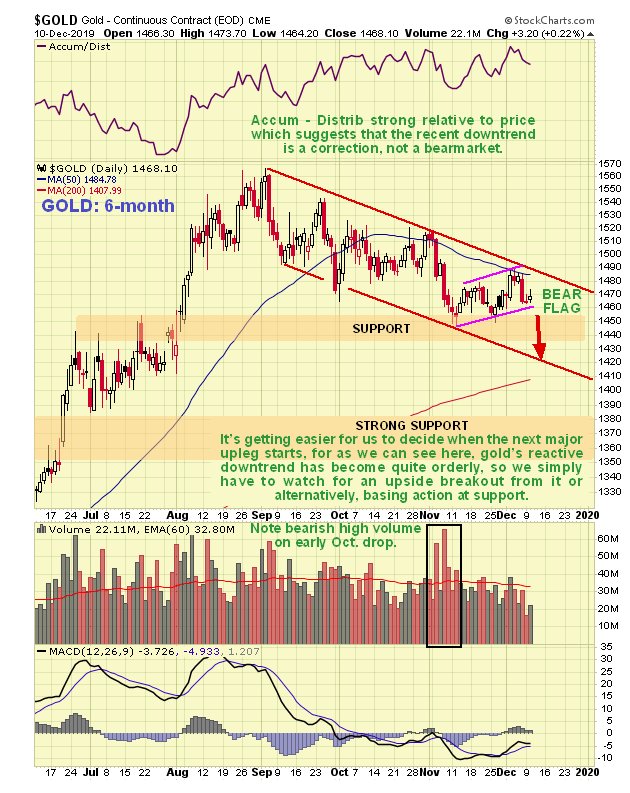
Gold’s post breakout reaction back from its early September peak has evolved into a steady downtrend as we can see on its 6-month chart below. The approach of the rising 200-day moving average below suggests that this reactive downtrend will have run its course before much longer leading to a second upleg. However, gold’s COTs have shown no improvement as this downtrend has unfolded, which is a sign that the downtrend has further to run. The now orderly downtrend has one distinct advantage, which is that bulls simply have to wait either for a breakout from it or the development of a basing pattern. One indication that the downtrend is a correction and not the start of something more sinister is the positive divergence of the Accumulation line compared to the price.


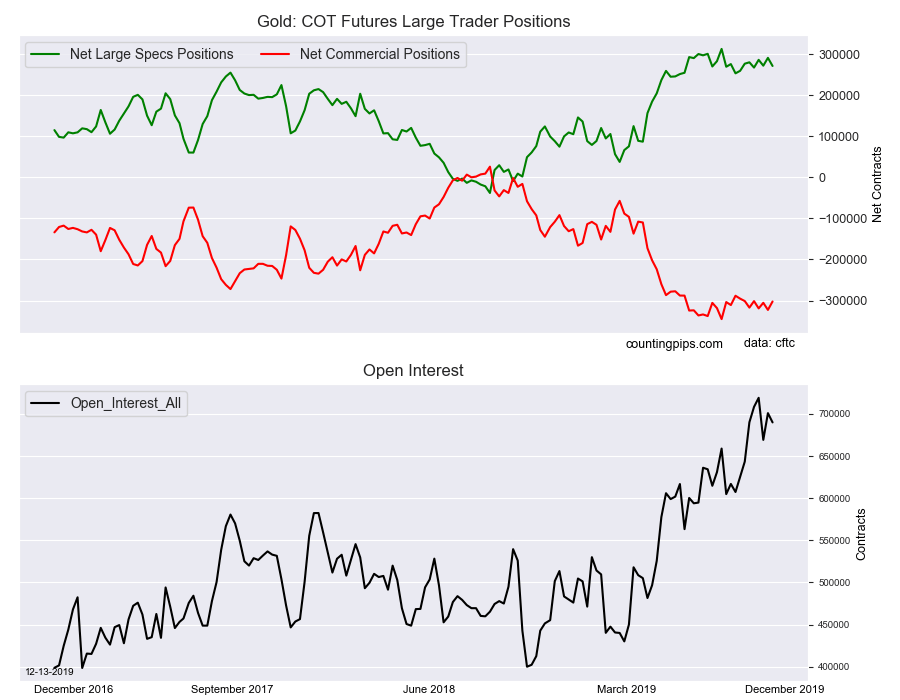
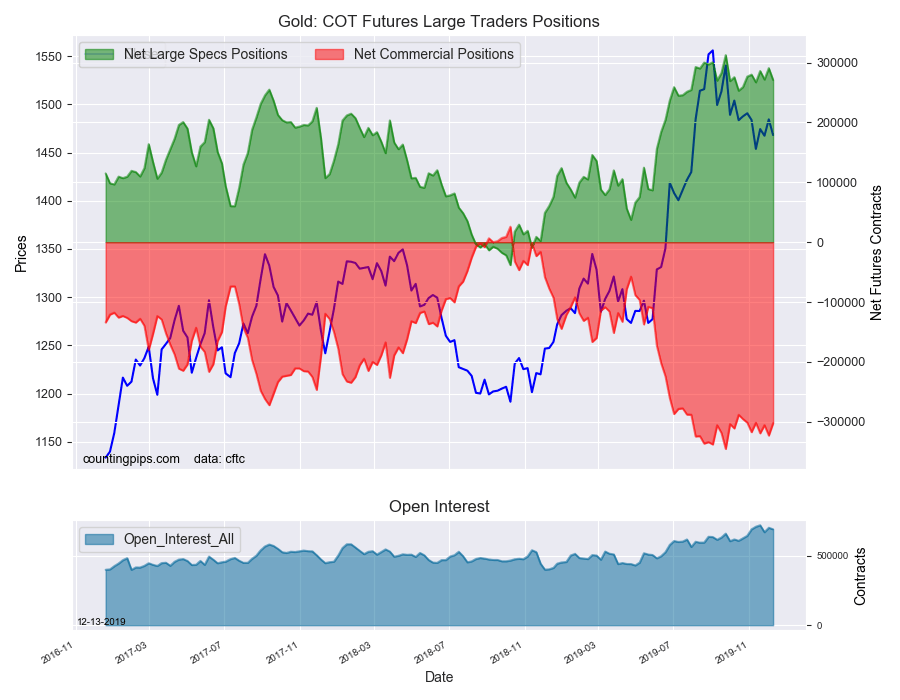
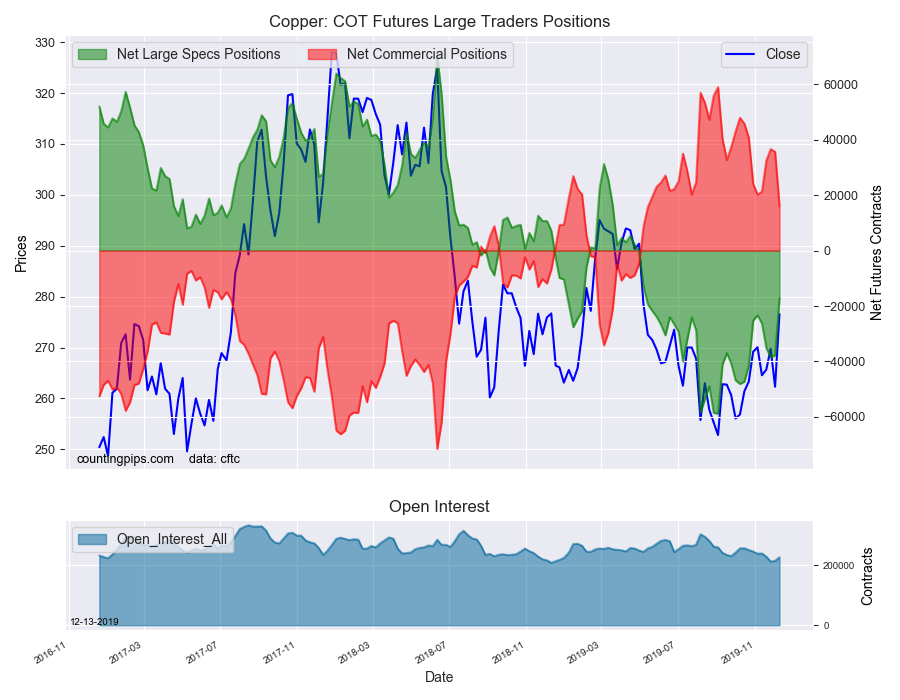
Gold’s COTs continue to sound a note of caution, with Commercials holding big short positions and the Large Specs not giving up and reducing their long positions. Normally this means that the decline will continue. Where is it likely to stop? To determine that we will now look at a long-term 10-year chart.

Click on chart to pop-up a larger, clearer version.

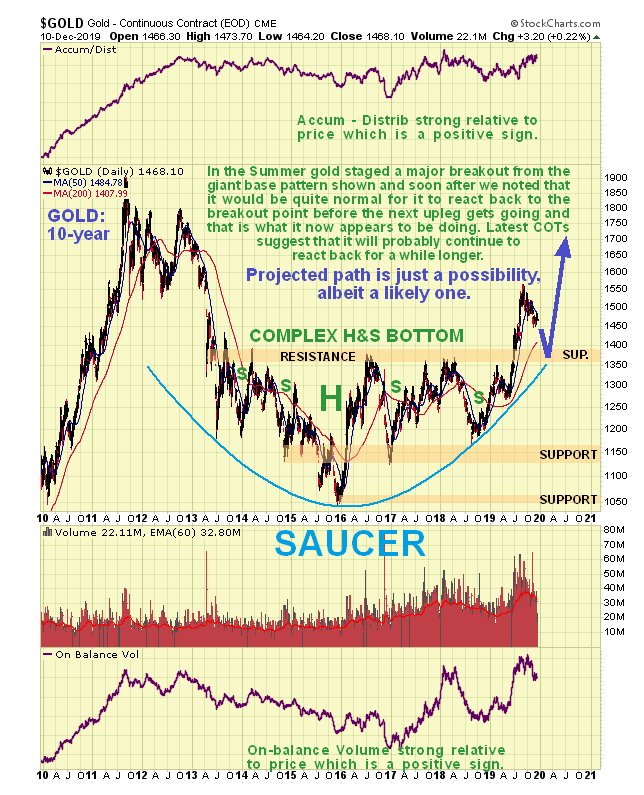
On the 10-year chart we can see gold’s impressive summer breakout from a giant complex Head-and-Shoulders bottom, which also had characteristics of a Saucer base. Not long after it broke out we noted that it would be quite normal for it to react back to test support at the breakout point before the new bull market gains traction, and that is what it now appears to be doing. As the reaction back unfolds we can expect all the tired old negative attitudes towards gold to re-emerge—gold is a “barbarous relic,” don’t fight the Fed, the stock market’s going to go up forever, etc., etc.—and that is already starting to happen and these negative pronouncements will be the cover behind which we can build positions across the sector once gold drops back into support in the $1360–$1400 zone near to the top of the giant base pattern, which as we noted above, the COTs suggest is likely.


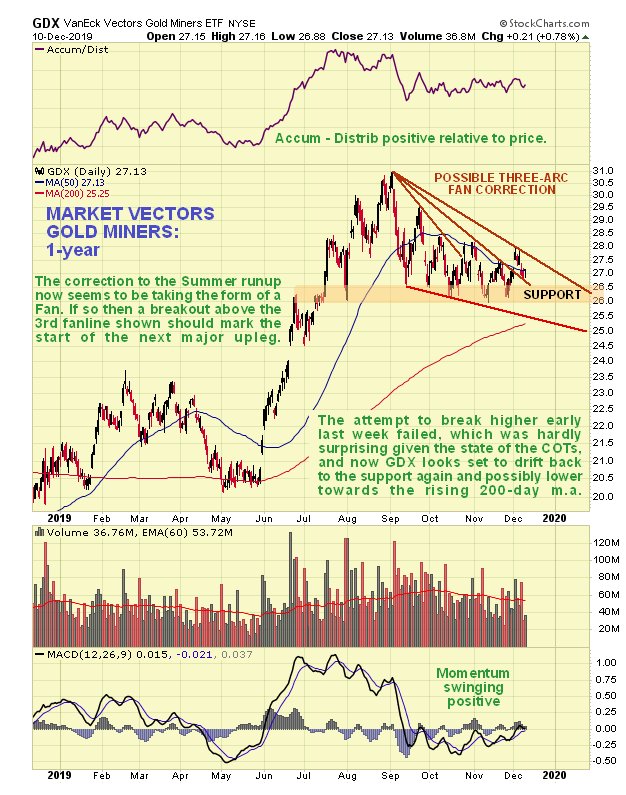
As for stocks we can see that the retreat by GDX from its early September peak does not look like a top formation—it looks like nothing more than a normal correction to the big run up that preceded it. It now looks like it is marking out a 3-arc Fan correction, in which case we simply have to break for a breakout above the third fanline for the next major upleg to start. In the meantime, with gold looking set to react back further, there is scope for it to react drop to the lower trendline shown and into the vicinity of the rising 200-day moving average before this reactive phase is done.


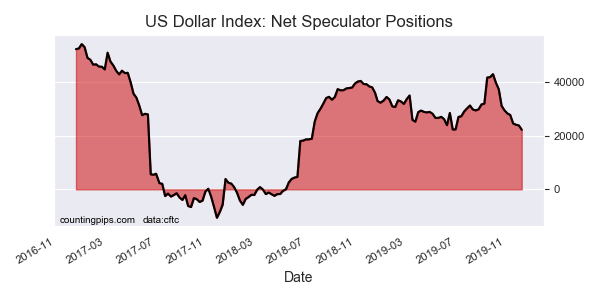
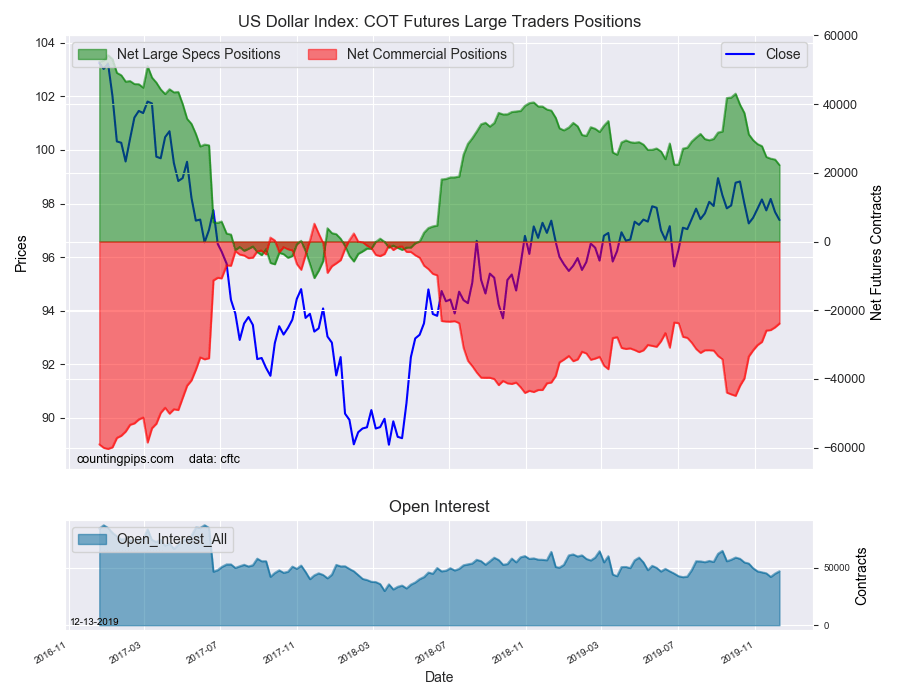
So what about the glorious unassailable dollar? The extraordinary thing about the dollar index is that, despite the relentless and shameless abuse heaped on it by the Fed, it has continued to hold up, but this is largely due to everybody else around the world following suit and playing the same game.

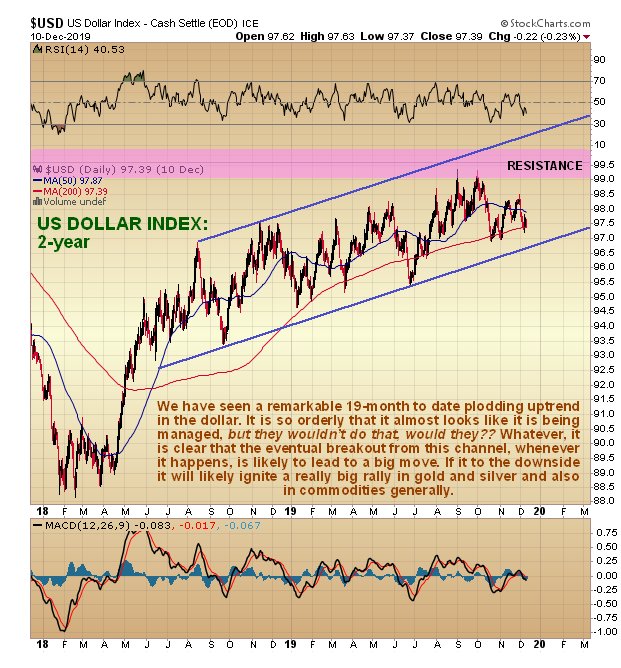
On the 2-year chart for the dollar index we can that it has been shepherded gradually higher for the past 19 months within a remarkably steady uptrend. This uptrend has been so steady and been going on for such a long time that it almost makes one think that it is being managed, but they wouldn’t do that would they? Managed or not, all intermediate-term currency traders need to concern themselves with is to look out for a breakout from this trend channel, because that’s when the fireworks will start, not just in the currency markets but in commodities too.


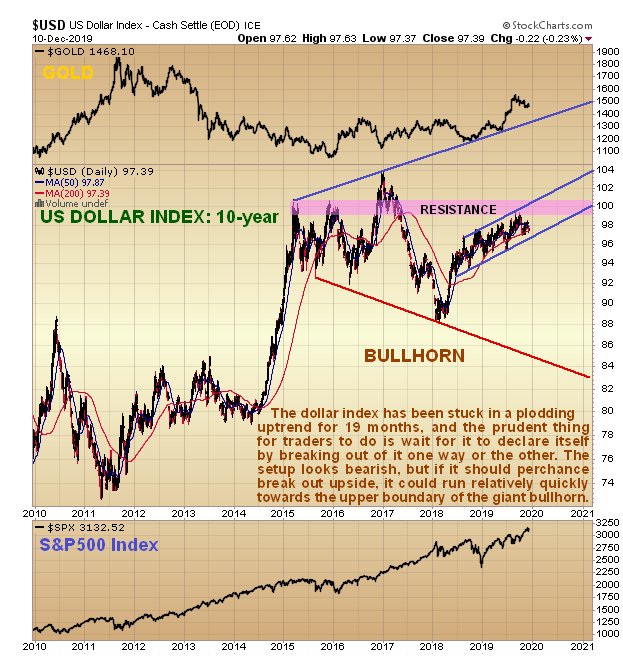
The setup on the long-term 10-year dollar chart looks rather bearish, with the long plodding uptrend bringing the dollar up to a resistance zone at prior highs. On long-term charts gold’s current reaction also looks like a bull Flag, and if it is it makes it more likely that the dollar will soon drop, and here we should not forget that far-eastern efforts to undermine the dollar and dethrone it as the world’s reserve currency are ongoing and will eventually bear fruit. Before leaving this chart we should note that, although the setup looks bearish, if the dollar should succeed in breaking out of its trend channel and above resistance, then it could run quite quickly towards the upper boundary of the giant bullhorn pattern shown, although it does seem rather fanciful to imagine that it would get as high as the boundary of this pattern. This would only be likely to happen in the event of some mass liquidation event, which at this point looks unlikely.


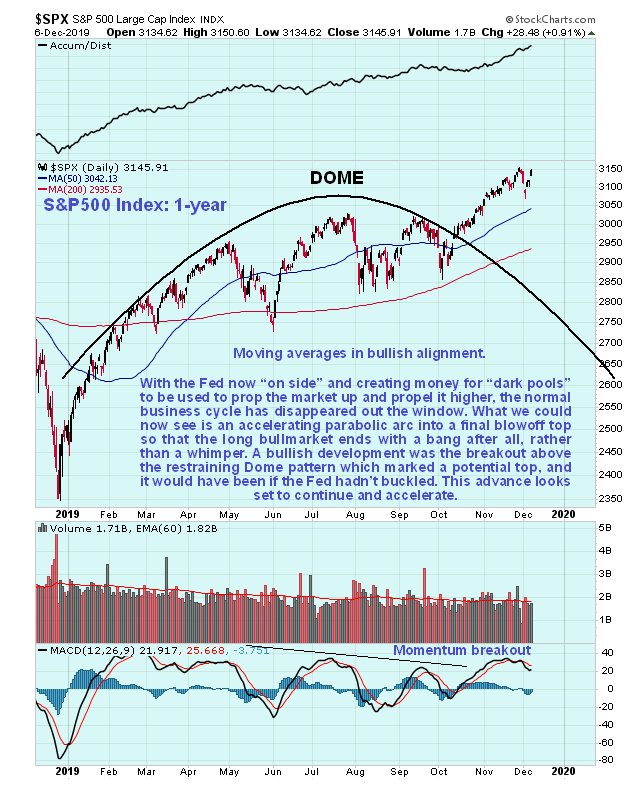
One argument against the precious metals sector advancing is that the stock market is now romping ahead again, fueled by QE4 and the huge amounts of cash sat on the sidelines piling in. While this argument has some validity, we should keep in mind that there are some serious black swans out there that could derail this stock bull market out any time, but more importantly what happens to the precious metals sector going forward depends much more on the fate of the dollar, but as we have already seen on gold’s 10-year chart the technicals say that it is going to react back to the breakout point of its giant base pattern, and after some chopping around there, take off higher again.

Clive Maund has been president of www.clivemaund.com, a successful resource sector website, since its inception in 2003. He has 30 years’ experience in technical analysis and has worked for banks, commodity brokers and stockbrokers in the City of London. He holds a Diploma in Technical Analysis from the UK Society of Technical Analysts.

Sign up for our FREE newsletter at: www.streetwisereports.com/get-news

Disclosure:
1) Statements and opinions expressed are the opinions of Clive Maund and not of Streetwise Reports or its officers. Clive Maund is wholly responsible for the validity of the statements. Streetwise Reports was not involved in the content preparation. Clive Maund was not paid by Streetwise Reports LLC for this article. Streetwise Reports was not paid by the author to publish or syndicate this article.
2) This article does not constitute investment advice. Each reader is encouraged to consult with his or her individual financial professional and any action a reader takes as a result of information presented here is his or her own responsibility. By opening this page, each reader accepts and agrees to Streetwise Reports’ terms of use and full legal disclaimer. This article is not a solicitation for investment. Streetwise Reports does not render general or specific investment advice and the information on Streetwise Reports should not be considered a recommendation to buy or sell any security. Streetwise Reports does not endorse or recommend the business, products, services or securities of any company mentioned on Streetwise Reports.
3) From time to time, Streetwise Reports LLC and its directors, officers, employees or members of their families, as well as persons interviewed for articles and interviews on the site, may have a long or short position in securities mentioned. Directors, officers, employees or members of their immediate families are prohibited from making purchases and/or sales of those securities in the open market or otherwise from the time of the interview or the decision to write an article until three business days after the publication of the interview or article. The foregoing prohibition does not apply to articles that in substance only restate previously published company releases.

Charts and graphics provided by the author.

CliveMaund.com Disclosure:
The above represents the opinion and analysis of Mr Maund, based on data available to him, at the time of writing. Mr. Maund’s opinions are his own, and are not a recommendation or an offer to buy or sell securities. Mr. Maund is an independent analyst who receives no compensation of any kind from any groups, individuals or corporations mentioned in his reports. As trading and investing in any financial markets may involve serious risk of loss, Mr. Maund recommends that you consult with a qualified investment advisor, one licensed by appropriate regulatory agencies in your legal jurisdiction and do your own due diligence and research when making any kind of a transaction with financial ramifications. Although a qualified and experienced stock market analyst, Clive Maund is not a Registered Securities Advisor. Therefore Mr. Maund’s opinions on the market and stocks can only be construed as a solicitation to buy and sell securities when they are subject to the prior approval and endorsement of a Registered Securities Advisor operating in accordance with the appropriate regulations in your area of jurisdiction.

COT: Speculators dropped USD bets for 10th week. Crude bets jump up to 32-week high

By CountingPips.comReceive our weekly COT Reports by Email

Here are the latest links to our coverage of the Commitment of Traders data changes.


Currency Speculators cut US Dollar Index bullish bets for 10th straight week

Large currency speculators decreased their net positions in the US Dollar Index futures markets this week, according to the latest Commitment of Traders (COT) data released by the Commodity Futures Trading Commission (CFTC) on Friday. See full article.


WTI Crude Oil Speculators boosted their bullish bets to 32-week high

The large speculator contracts of WTI crude futures totaled a net position of 495,539 contracts, according to the latest data this week. This was a change of 67,504 contracts from the previous weekly total. See full article.


10-Year Note Speculators pulled back on their bearish bets for 3rd time in 5 weeks

Large speculator contracts of the 10-Year Bond futures totaled a net position of -178,921 contracts, according to the latest data this week. This was a change of 42,974 contracts from the previous weekly total. See full article.


Gold Speculators cut back on their bullish net positions this week

Large precious metals speculator contracts of the Gold futures totaled a net position of 270,920 contracts, according to the latest data this week. This was a change of -19,785 contracts from the previous weekly total. See full article.


VIX Speculators pared their bearish bets for a 3rd week after record highs

Large stock market volatility speculator contracts of the VIX futures totaled a net position of -183,028 contracts, according to the latest data this week. This was a change of 16,284 contracts from the previous weekly total. See full article.


Silver Speculators lowered their bullish bets for 2nd week

Large precious metals speculator contracts of the silver futures totaled a net position of 40,742 contracts, according to the latest data this week. This was a change of -9,485 contracts from the previous weekly total. See full article.


Copper Speculators sharply dropped their bearish bets to 31-week low

Metals speculator contracts of the copper futures totaled a net position of -17,148 contracts, according to the latest data this week. This was a change of 20,559 contracts from the previous weekly total. See full article.


Article By CountingPips.comReceive our weekly COT Reports by Email

*COT Report: The COT data, released weekly to the public each Friday, is updated through the most recent Tuesday (data is 3 days old) and shows a quick view of how large speculators or non-commercials (for-profit traders) were positioned in the futures markets.

The CFTC categorizes trader positions according to commercial hedgers (traders who use futures contracts for hedging as part of the business), non-commercials (large traders who speculate to realize trading profits) and nonreportable traders (usually small traders/speculators).

Find CFTC criteria here: (http://www.cftc.gov/MarketReports/CommitmentsofTraders/ExplanatoryNotes/index.htm).

Currency Speculators cut US Dollar Index bullish bets for 10th straight week

December 14th – By CountingPips.comReceive our weekly COT Reports by Email

US Dollar Index Speculator Positions

Large currency speculators once again decreased their net positions in the US Dollar Index futures markets this week, according to the latest Commitment of Traders (COT) data released by the Commodity Futures Trading Commission (CFTC) on Friday.

The non-commercial futures contracts of US Dollar Index futures, traded by large speculators and hedge funds, totaled a net position of 22,261 contracts in the data reported through Tuesday December 10th. This was a weekly lowering of -1,616 contracts from the previous week which had a total of 23,877 net contracts.

This week’s net position was the result of the gross bullish position (longs) lowering by -428 contracts (to a weekly total of 30,754 contracts) compared to the gross bearish position (shorts) which saw a rise by 1,188 contracts on the week (to a total of 8,493 contracts).

Speculators continued to pare their bullish positions in the US Dollar Index for a tenth straight week and by a total of -20,767 contracts in that period. The current standing of bullish positions is now at the lowest level in seventy-three weeks, dating back to July of 2018. Despite the recent declines, the USD Index position has now remained in bullish territory for eighty-three consecutive weeks starting in May of 2018.


Individual Currencies Data this week:

In the individual major currencies data, the currencies that saw improving speculator positions this week were the euro (1,406 weekly change in contracts), British pound sterling (7,411 contracts), Japanese yen (4,141 contracts), Swiss franc (1,422 contracts), New Zealand dollar (1,652 contracts) and the Mexican peso (514 contracts).

The currencies whose speculative bets declined this week were the US dollar index (-1,616 weekly change in contracts), Canadian dollar (-730 contracts) and the Australian dollar (-375 contracts).

See the table and more currency charts below.


Chart: Current Strength of Each Currency compared to their 3-Year Range


Table of Large Speculator Levels & Weekly Changes:

CurrencyNet Speculator PositionSpecs Weekly Change
USD Index22,261-1,616
EuroFx-67,6431,406
GBP-22,6397,411
JPY-43,6824,141
CHF-20,8651,422
CAD20,741-730
AUD-36,808-375
NZD-25,3401,652
MXN130,641514


This latest COT data is through Tuesday and shows a quick view of how large speculators or non-commercials (for-profit traders) were positioned in the futures markets. All currency positions are in direct relation to the US dollar where, for example, a bet for the euro is a bet that the euro will rise versus the dollar while a bet against the euro will be a bet that the dollar will gain versus the euro.


Weekly Charts: Large Trader Weekly Positions vs Price

EuroFX:

The Euro large speculator standing this week was a net position of -67,643 contracts in the data reported through Tuesday. This was a weekly increase of 1,406 contracts from the previous week which had a total of -69,049 net contracts.


British Pound Sterling:

The large British pound sterling speculator level recorded a net position of -22,639 contracts in the data reported this week. This was a weekly boost of 7,411 contracts from the previous week which had a total of -30,050 net contracts.


Japanese Yen:

Large Japanese yen speculators totaled a net position of -43,682 contracts in this week’s data. This was a weekly boost of 4,141 contracts from the previous week which had a total of -47,823 net contracts.


Swiss Franc:

The Swiss franc speculator standing this week was a net position of -20,865 contracts in the data through Tuesday. This was a weekly increase of 1,422 contracts from the previous week which had a total of -22,287 net contracts.


Canadian Dollar:

Canadian dollar speculators resulted in a net position of 20,741 contracts this week. This was a decline of -730 contracts from the previous week which had a total of 21,471 net contracts.


Australian Dollar:

The large speculator positions in Australian dollar futures was a net position of -36,808 contracts this week in the data ending Tuesday. This was a weekly reduction of -375 contracts from the previous week which had a total of -36,433 net contracts.


New Zealand Dollar:

The New Zealand dollar speculative standing totaled a net position of -25,340 contracts this week in the latest COT data. This was a weekly advance of 1,652 contracts from the previous week which had a total of -26,992 net contracts.


Mexican Peso:

Mexican peso speculators was a net position of 130,641 contracts this week. This was a weekly advance of 514 contracts from the previous week which had a total of 130,127 net contracts.


Article By CountingPips.comReceive our weekly COT Reports by Email

*COT Report: The COT data, released weekly to the public each Friday, is updated through the most recent Tuesday (data is 3 days old) and shows a quick view of how large speculators or non-commercials (for-profit traders) were positioned in the futures markets.

The CFTC categorizes trader positions according to commercial hedgers (traders who use futures contracts for hedging as part of the business), non-commercials (large traders who speculate to realize trading profits) and nonreportable traders (usually small traders/speculators).

Find CFTC criteria here: (http://www.cftc.gov/MarketReports/CommitmentsofTraders/ExplanatoryNotes/index.htm).

WTI Crude Oil Speculators boosted their bullish bets to 32-week high

December 14th – By CountingPips.comReceive our weekly COT Reports by Email

WTI Crude Oil Non-Commercial Speculator Positions:

Large energy speculators sharply lifted their bullish net positions in the WTI Crude Oil futures markets this week, according to the latest Commitment of Traders (COT) data released by the Commodity Futures Trading Commission (CFTC) on Friday.

The non-commercial futures contracts of WTI Crude Oil futures, traded by large speculators and hedge funds, totaled a net position of 495,539 contracts in the data reported through Tuesday December 10th. This was a weekly jump of 67,504 net contracts from the previous week which had a total of 428,035 net contracts.

The week’s net position was the result of the gross bullish position (longs) advancing by 46,096 contracts (to a weekly total of 577,216 contracts) while the gross bearish position (shorts) declined by -21,408 contracts for the week (to a total of 81,677 contracts).

Crude oil speculators sharply raised their bullish positions this week and have pushed their bets higher in eight out of the past nine weeks. This week’s jump in bullish net positions marks the highest one-week increase since late in 2016 and puts the current standing at the highest bullish level in the past thirty-two weeks.

WTI Crude Oil Commercial Positions:

The commercial traders position, hedgers or traders engaged in buying and selling for business purposes, totaled a net position of -501,989 contracts on the week. This was a weekly loss of -64,279 contracts from the total net of -437,710 contracts reported the previous week.

WTI Crude Oil Futures:

Over the same weekly reporting time-frame, from Tuesday to Tuesday, the WTI Crude Oil Futures (Front Month) closed at approximately $59.24 which was a gain of $3.14 from the previous close of $56.10, according to unofficial market data.

*COT Report: The COT data, released weekly to the public each Friday, is updated through the most recent Tuesday (data is 3 days old) and shows a quick view of how large speculators or non-commercials (for-profit traders) as well as the commercial traders (hedgers & traders for business purposes) were positioned in the futures markets.

The CFTC categorizes trader positions according to commercial hedgers (traders who use futures contracts for hedging as part of the business), non-commercials (large traders who speculate to realize trading profits) and nonreportable traders (usually small traders/speculators).

Find CFTC criteria here: (http://www.cftc.gov/MarketReports/CommitmentsofTraders/ExplanatoryNotes/index.htm).

Article By CountingPips.comReceive our weekly COT Reports by Email

10-Year Note Speculators pulled back on their bearish bets for 3rd time in 5 weeks

December 14th – By CountingPips.comReceive our weekly COT Reports by Email

10-Year Note Non-Commercial Speculator Positions:

Large bond speculators pared their bearish net positions in the 10-Year Note futures markets this week, according to the latest Commitment of Traders (COT) data released by the Commodity Futures Trading Commission (CFTC) on Friday.

The non-commercial futures contracts of 10-Year Note futures, traded by large speculators and hedge funds, totaled a net position of -178,921 contracts in the data reported through Tuesday December 10th. This was a weekly change of 42,974 net contracts from the previous week which had a total of -221,895 net contracts.

The week’s net position was the result of the gross bullish position (longs) dropping by -52,998 contracts (to a weekly total of 649,320 contracts) while the gross bearish position (shorts) declined by -95,972 contracts for the week (to a total of 828,241 contracts).

Large 10-year speculators cut back on their bearish bets for the third time in the past five weeks. The decline in bearish positions brings the overall bearish level back under the -200,000 net contract standing for the fourth time in the past five weeks. Overall, the 10-year position has now been in bearish territory for one-hundred and four straight weeks.

10-Year Note Commercial Positions:

The commercial traders position, hedgers or traders engaged in buying and selling for business purposes, totaled a net position of 217,135 contracts on the week. This was a weekly drop of -24,784 contracts from the total net of 241,919 contracts reported the previous week.

10-Year Note Futures:

Over the same weekly reporting time-frame, from Tuesday to Tuesday, the 10-Year Note Futures (Front Month) closed at approximately $128.92 which was a drop of $-1.10 from the previous close of $130.03, according to unofficial market data.

*COT Report: The COT data, released weekly to the public each Friday, is updated through the most recent Tuesday (data is 3 days old) and shows a quick view of how large speculators or non-commercials (for-profit traders) as well as the commercial traders (hedgers & traders for business purposes) were positioned in the futures markets.

The CFTC categorizes trader positions according to commercial hedgers (traders who use futures contracts for hedging as part of the business), non-commercials (large traders who speculate to realize trading profits) and nonreportable traders (usually small traders/speculators).

Find CFTC criteria here: (http://www.cftc.gov/MarketReports/CommitmentsofTraders/ExplanatoryNotes/index.htm).

Article By CountingPips.comReceive our weekly COT Reports by Email

GOLD & SILVER PRICE UPDATE: And What Most Precious Metals Analysts Are Missing

By Money Metals News Service

The gold and silver prices continue to consolidate since reaching new five-year highs in the summer. Gold is nearly $100 lower from its high of $1,566 on September 4th, while silver is down more than $3 from its $19.75 peak on the very same day. Thus, gold is down 6% while silver is off by more than 15% from the peak summer prices.

However, some precious metals analysts continue to harp on the “Price Hammering” or “Manipulated” knock-down of the metals when they didn’t complain when both gold and silver increased 23% and 38% respectively from their lows in just three months. I bring this up again because the time spent fixated on the “supposed” precious metals manipulation will only amount to increased “FRUSTRATION.” Rather, I believe it’s better to focus on understanding the underlying “ROOT” fundamentals of the market and the impact on the future value of gold and silver.

For example, I no longer spend much time at all, looking at the Political Circus in Washington, DC. It’s a complete waste of time. Americans are either brainwashed by propaganda from the LEFT or the RIGHT into believing their “SCHMUCK” leader is better than the other. So, trying to debate Americans who are proud proponents of the LEFT or RIGHT is similar to wasting time on precious metals manipulation.

With all the articles claiming Gold and Silver Manipulation, why hasn’t anyone brought up the fact that gold and silver are now trading above their total primary cost of production (+$200 for gold & +$1-2 for silver)?? It would be one thing if gold were trading at $750 and silver at $10. Then, the “Manipulation” mantra would carry more weight and make sense. However, these two precious metals are still trading above their average cost of production, even after consolidating lower over the past three months.

So, the frustration experienced by many individuals in the precious metals community is that they believe the gold and silver prices should be up much higher than they are currently. While I agree that it would be nice for the precious metals prices to be higher, especially considering the tremendous Fed and central bank market intervention, the underlying bullish fundamentals haven’t kicked in yet.


The Money Metals News Service provides market news and crisp commentary for investors following the precious metals markets.

Gold Speculators cut back on their bullish net positions this week

December 14th – By CountingPips.comReceive our weekly COT Reports by Email

Gold Non-Commercial Speculator Positions:

Large precious metals speculators cut back on their bullish net positions in the Gold futures markets this week, according to the latest Commitment of Traders (COT) data released by the Commodity Futures Trading Commission (CFTC) on Friday.

The non-commercial futures contracts of Gold futures, traded by large speculators and hedge funds, totaled a net position of 270,920 contracts in the data reported through Tuesday December 10th. This was a weekly fall of -19,785 net contracts from the previous week which had a total of 290,705 net contracts.

The week’s net position was the result of the gross bullish position (longs) declining by -17,356 contracts (to a weekly total of 329,169 contracts) while the gross bearish position (shorts) rose by 2,429 contracts for the week (to a total of 58,249 contracts).

Gold bullish bets dropped for the third time in the past five weeks this week. The decline this week marked the largest shortfall in the past eight weeks. Despite the recent pullbacks, the gold position has remained in a strong bullish position as the speculative position has been above the +250,000 net contract level for the past twenty-one weeks and above the +200,000 net contract level for the past twenty-six weeks.

Gold Commercial Positions:

The commercial traders position, hedgers or traders engaged in buying and selling for business purposes, totaled a net position of -302,283 contracts on the week. This was a weekly increase of 20,504 contracts from the total net of -322,787 contracts reported the previous week.

Gold Futures:

Over the same weekly reporting time-frame, from Tuesday to Tuesday, the Gold Futures (Front Month) closed at approximately $1468.10 which was a drop of $-16.30 from the previous close of $1484.40, according to unofficial market data.

*COT Report: The COT data, released weekly to the public each Friday, is updated through the most recent Tuesday (data is 3 days old) and shows a quick view of how large speculators or non-commercials (for-profit traders) as well as the commercial traders (hedgers & traders for business purposes) were positioned in the futures markets.

The CFTC categorizes trader positions according to commercial hedgers (traders who use futures contracts for hedging as part of the business), non-commercials (large traders who speculate to realize trading profits) and nonreportable traders (usually small traders/speculators).

Find CFTC criteria here: (http://www.cftc.gov/MarketReports/CommitmentsofTraders/ExplanatoryNotes/index.htm).

Article By CountingPips.comReceive our weekly COT Reports by Email

VIX Speculators pared their bearish bets for a 3rd week after record highs

December 14th – By CountingPips.comReceive our weekly COT Reports by Email

VIX Non-Commercial Speculator Positions:

Large volatility speculators cut back on their bearish net positions in the VIX futures markets this week, according to the latest Commitment of Traders (COT) data released by the Commodity Futures Trading Commission (CFTC) on Friday.

The non-commercial futures contracts of VIX futures, traded by large speculators and hedge funds, totaled a net position of -183,028 contracts in the data reported through Tuesday December 10th. This was a weekly change of 16,284 net contracts from the previous week which had a total of -199,312 net contracts.

The week’s net position was the result of the gross bullish position (longs) sliding by -9,424 contracts (to a weekly total of 65,785 contracts) while the gross bearish position (shorts) fell by -25,708 contracts for the week (to a total of 248,813 contracts).

VIX Speculators reduced their bearish bets for a third consecutive week and by a total of 35,334 contracts over that three-week period. The recent declines follow a strong streak of higher and higher bearish positions that culminated in an all-time record high bearish position on November 19th with a total of -218,362 contracts. The VIX bearish position has now been over the -100,000 net contract level for thirteen straight weeks.

VIX Commercial Positions:

The commercial traders position, hedgers or traders engaged in buying and selling for business purposes, totaled a net position of 195,076 contracts on the week. This was a weekly decline of -13,731 contracts from the total net of 208,807 contracts reported the previous week.

VIX Futures:

Over the same weekly reporting time-frame, from Tuesday to Tuesday, the VIX Futures (Front Month) closed at approximately $16.87 which was an advance of $0.65 from the previous close of $16.22, according to unofficial market data.

*COT Report: The COT data, released weekly to the public each Friday, is updated through the most recent Tuesday (data is 3 days old) and shows a quick view of how large speculators or non-commercials (for-profit traders) as well as the commercial traders (hedgers & traders for business purposes) were positioned in the futures markets.

The CFTC categorizes trader positions according to commercial hedgers (traders who use futures contracts for hedging as part of the business), non-commercials (large traders who speculate to realize trading profits) and nonreportable traders (usually small traders/speculators).

Find CFTC criteria here: (http://www.cftc.gov/MarketReports/CommitmentsofTraders/ExplanatoryNotes/index.htm).

Article By CountingPips.comReceive our weekly COT Reports by Email

Silver Speculators lowered their bullish bets for 2nd week

December 14th – By CountingPips.comReceive our weekly COT Reports by Email

Silver Non-Commercial Speculator Positions:

Large precious metals speculators cut back on their bullish net positions in the Silver futures markets this week, according to the latest Commitment of Traders (COT) data released by the Commodity Futures Trading Commission (CFTC) on Friday.

The non-commercial futures contracts of Silver futures, traded by large speculators and hedge funds, totaled a net position of 40,742 contracts in the data reported through Tuesday December 10th. This was a weekly decline of -9,485 net contracts from the previous week which had a total of 50,227 net contracts.

The week’s net position was the result of the gross bullish position (longs) tumbling by -3,624 contracts (to a weekly total of 85,617 contracts) while the gross bearish position (shorts) gained by 5,861 contracts for the week (to a total of 44,875 contracts).

Silver speculators decreased their bullish bets for a second straight week and by a total of -11,768 contracts over the two-week period. Silver bets are now at the lowest level in the past four weeks but remain strongly in a bullish position. Overall, silver positions have been in bullish territory for twenty-seven straight weeks, dating back to June.

Silver Commercial Positions:

The commercial traders position, hedgers or traders engaged in buying and selling for business purposes, totaled a net position of -63,147 contracts on the week. This was a weekly change of 11,152 contracts from the total net of -74,299 contracts reported the previous week.

Silver Futures:

Over the same weekly reporting time-frame, from Tuesday to Tuesday, the Silver Futures (Front Month) closed at approximately $1670.20 which was a loss of $-54.60 from the previous close of $1724.80, according to unofficial market data.

*COT Report: The COT data, released weekly to the public each Friday, is updated through the most recent Tuesday (data is 3 days old) and shows a quick view of how large speculators or non-commercials (for-profit traders) as well as the commercial traders (hedgers & traders for business purposes) were positioned in the futures markets.

The CFTC categorizes trader positions according to commercial hedgers (traders who use futures contracts for hedging as part of the business), non-commercials (large traders who speculate to realize trading profits) and nonreportable traders (usually small traders/speculators).

Find CFTC criteria here: (http://www.cftc.gov/MarketReports/CommitmentsofTraders/ExplanatoryNotes/index.htm).

Article By CountingPips.comReceive our weekly COT Reports by Email

Copper Speculators sharply dropped their bearish bets to 31-week low

December 14th – By CountingPips.comReceive our weekly COT Reports by Email

Copper Non-Commercial Speculator Positions:

Large precious metals speculators strongly cut back on their bearish net positions in the Copper futures markets this week, according to the latest Commitment of Traders (COT) data released by the Commodity Futures Trading Commission (CFTC) on Friday.

The non-commercial futures contracts of Copper futures, traded by large speculators and hedge funds, totaled a net position of -17,148 contracts in the data reported through Tuesday December 10th. This was a weekly change of 20,559 net contracts from the previous week which had a total of -37,707 net contracts.

The week’s net position was the result of the gross bullish position (longs) jumping by 15,006 contracts (to a weekly total of 79,231 contracts) while the gross bearish position (shorts) fell by -5,553 contracts for the week (to a total of 96,379 contracts).

Copper speculators sharply reduced their bearish bets this week by the largest one-week amount since February. This decrease in bearish contracts brings the overall speculative position (-17148 contracts) to the least bearish standing in thirty-one weeks, dating back to May of this year.

Copper Commercial Positions:

The commercial traders position, hedgers or traders engaged in buying and selling for business purposes, totaled a net position of 16,102 contracts on the week. This was a weekly loss of -19,526 contracts from the total net of 35,628 contracts reported the previous week.

Copper Futures:

Over the same weekly reporting time-frame, from Tuesday to Tuesday, the Copper Futures (Front Month) closed at approximately $276.55 which was a boost of $14.25 from the previous close of $262.30, according to unofficial market data.

*COT Report: The COT data, released weekly to the public each Friday, is updated through the most recent Tuesday (data is 3 days old) and shows a quick view of how large speculators or non-commercials (for-profit traders) as well as the commercial traders (hedgers & traders for business purposes) were positioned in the futures markets.

The CFTC categorizes trader positions according to commercial hedgers (traders who use futures contracts for hedging as part of the business), non-commercials (large traders who speculate to realize trading profits) and nonreportable traders (usually small traders/speculators).

Find CFTC criteria here: (http://www.cftc.gov/MarketReports/CommitmentsofTraders/ExplanatoryNotes/index.htm).

Article By CountingPips.comReceive our weekly COT Reports by Email