DAX30 CFD to reach new All-Time Highs for Christmas?

By Admiral Markets

Economic Event December 16, 2019

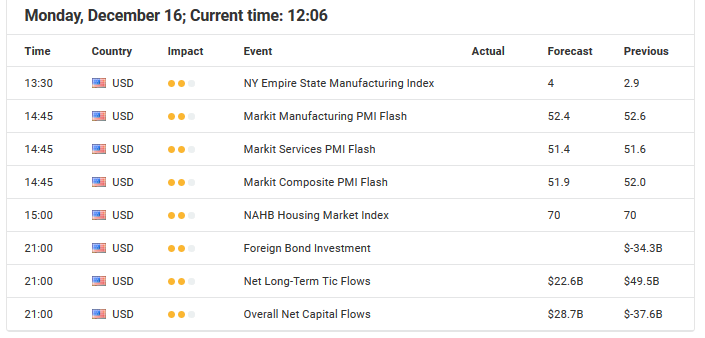
Source: Economic Events December 16, 2019 – Admiral Markets’ Forex Calendar

After last Thursday’s developments in the US-Chinese trade deal, the UK’s general election, and the Fed’s liquidity announcement, the outlook for the DAX30 CFD is very bright as we start the trading week.

The main driver for the bullish action, and the ensuing break above 13,180/200 points resulting in new yearly highs, was certainly the “deal” between the US and China where both sides are said to have agreed on a reduction on existing tariffs, and a delay in those planned to go into effect on December 15.

In addition to this, there was the landslide victory of UK prime minister Johnson’s Tories in the General election which made a near-term Brexit deal likely and diminished uncertainties among market participants, as well as the Fed’s announcement that it will flood markets with $500 Billion in liquidity to avoid a year-end repo crisis (and will thus extend the Fed balance sheet to new record highs by mid-January).

That said, we project a bullish DAX30 CFD for the yearly close, with a high likelihood of new all-time highs and thus a push to and above 13,600 points in the coming days.

A short-term correction finds a potential Long trigger in the region around 13,280/300 points and a littler deeper around 13,180/200 points, with the mode staying bullish on an Hourly time-frame above 13,080/100 points:

DAX30 CFD - Hourly Chart

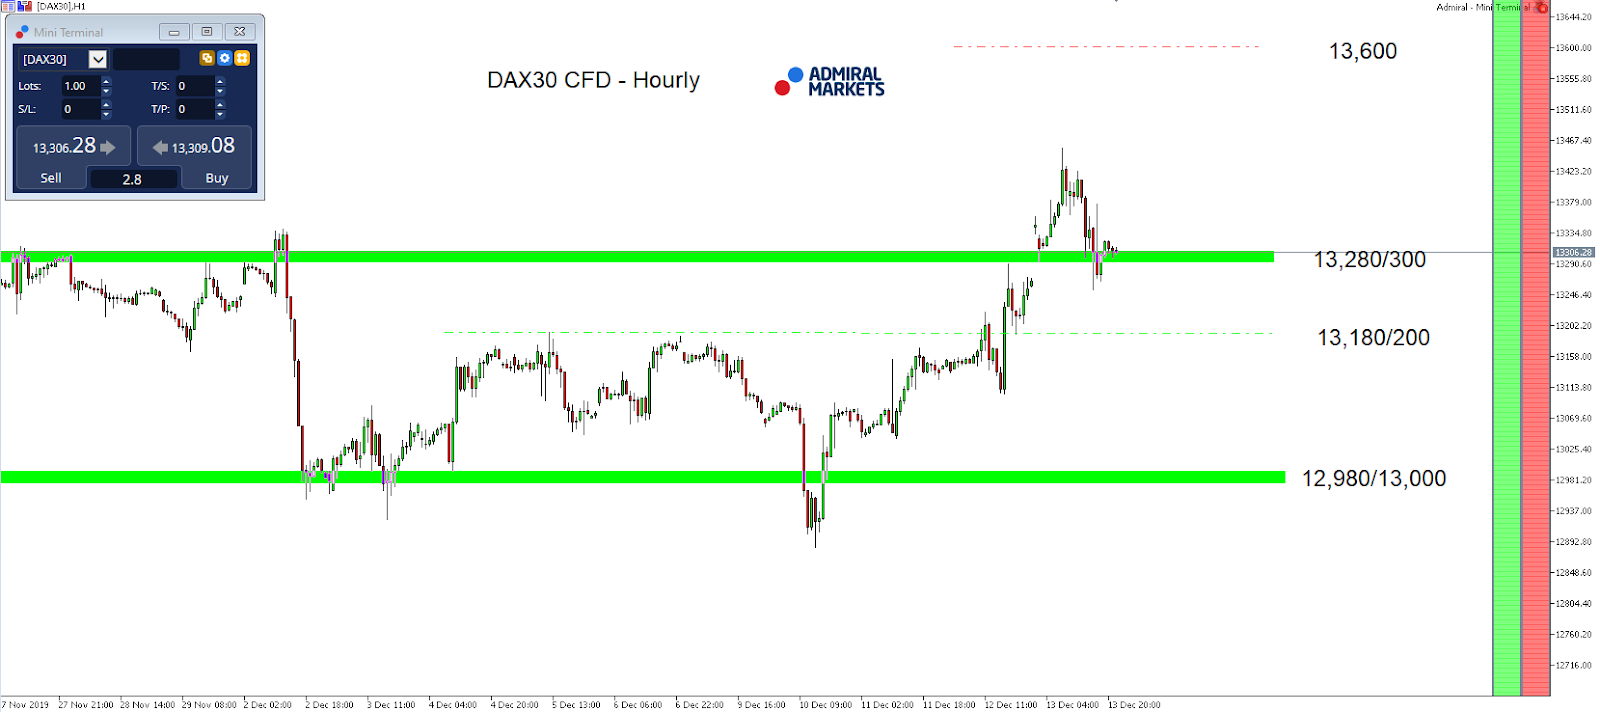
Source: Admiral Markets MT5 with MT5-SE Add-on DAX30 CFD Hourly chart (between November 27, 2018, to December 13, 2019). Accessed: December 13, 2019, at 10:00pm GMT

DAX30 CFD - Daily Chart

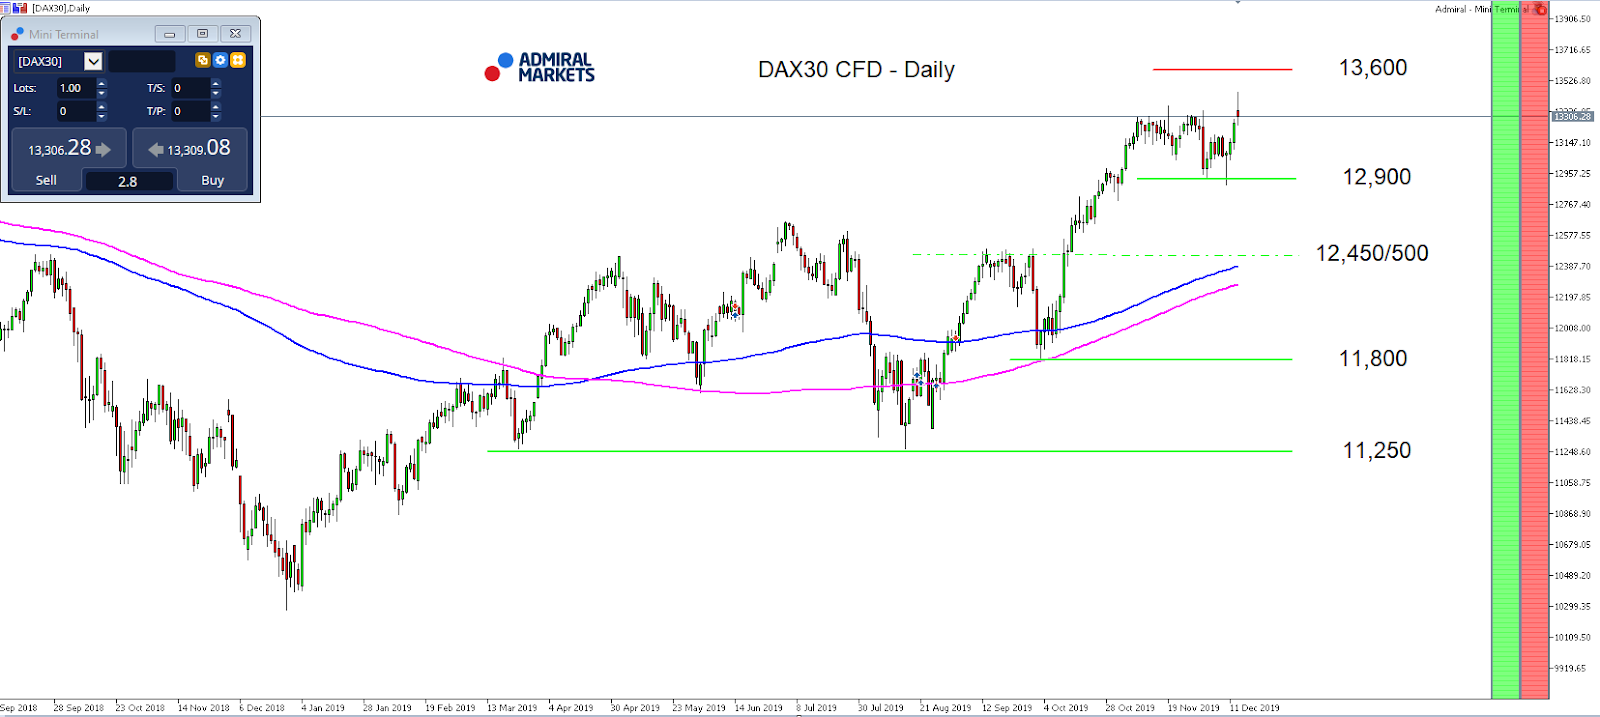
Source: Admiral Markets MT5 with MT5-SE Add-on DAX30 CFD Daily chart (between September 5, 2018, to December 13, 2019). Accessed: December 13, 2019, at 10:00pm GMT – Please note: Past performance is not a reliable indicator of future results, or future performance.

In 2014, the value of the DAX30 CFD increased by 2.65%, in 2015, it increased by 9.56%, in 2016 it increased by 6.87%, in 2017 it increased by 12.51%, in 2018 it fell by 18.26%, meaning that after five years, it was up by 10.5%.

Discover the world’s #1 multi-asset platform

Admiral Markets offers professional traders the ability to trade with a custom, upgraded version of MetaTrader 5, allowing you to experience trading at a significantly higher, more rewarding level. Experience benefits such as the addition of the Market Heat Map, so you can compare various currency pairs to see which ones might be lucrative investments, access real-time trading data, and so much more. Click the banner below to start your FREE download of MT5 Supreme Edition!

Download MetaTrader 5 and begin trading today!

Disclaimer: The given data provides additional information regarding all analysis, estimates, prognosis, forecasts or other similar assessments or information (hereinafter “Analysis”) published on the website of Admiral Markets. Before making any investment decisions please pay close attention to the following:

  1. This is a marketing communication. The analysis is published for informative purposes only and are in no way to be construed as investment advice or recommendation. It has not been prepared in accordance with legal requirements designed to promote the independence of investment research, and that it is not subject to any prohibition on dealing ahead of the dissemination of investment research.
  2. Any investment decision is made by each client alone whereas Admiral Markets shall not be responsible for any loss or damage arising from any such decision, whether or not based on the Analysis.
  3. Each of the Analysis is prepared by an independent analyst (Jens Klatt, Professional Trader and Analyst, hereinafter “Author”) based on the Author’s personal estimations.
  4. To ensure that the interests of the clients would be protected and objectivity of the Analysis would not be damaged Admiral Markets has established relevant internal procedures for prevention and management of conflicts of interest.
  5. Whilst every reasonable effort is taken to ensure that all sources of the Analysis are reliable and that all information is presented, as much as possible, in an understandable, timely, precise and complete manner, Admiral Markets does not guarantee the accuracy or completeness of any information contained within the Analysis. The presented figures refer that refer to any past performance is not a reliable indicator of future results.
  6. The contents of the Analysis should not be construed as an express or implied promise, guarantee or implication by Admiral Markets that the client shall profit from the strategies therein or that losses in connection therewith may or shall be limited.
  7. Any kind of previous or modeled performance of financial instruments indicated within the Publication should not be construed as an express or implied promise, guarantee or implication by Admiral Markets for any future performance. The value of the financial instrument may both increase and decrease and the preservation of the asset value is not guaranteed.
  8. The projections included in the Analysis may be subject to additional fees, taxes or other charges, depending on the subject of the Publication. The price list applicable to the services provided by Admiral Markets is publicly available from the website of Admiral Markets.
  9. Leveraged products (including contracts for difference) are speculative in nature and may result in losses or profit. Before you start trading, you should make sure that you understand all the risks.

By Admiral Markets


RoboMarkets Receives Best Trading Execution Award at Professional Trader Awards 2019 in London

December, 16th – Limassol, Cyprus – RoboMarkets, a European company and a prominent provider of investment services on global financial markets, is pleased to announce the reception of the Best Trading Execution award at the prestigious Professional Trader Awards 2019. Winners in different nominations were decided by the poll conducted among professional traders. The award ceremony took place on December 19th, 2019 in the Four Seasons hotel in London.

Professional Trader Awards is presented to the brokers that have exclusive offers for maintaining professional trading accounts. Awards in each of 14 nominations were given out to the companies that achieved outstanding results in the fields of technologies and innovations, trading conditions and order execution quality, development of loyalty programs and customer support services.

The open voting started on November 1st, 2019, right after the award nominees were announced. For three weeks, the organizing committee of the event had been closely working with a professional trading community via media partners and third-party trade representatives, and involving in voting individual traders who operate on professional accounts. All of them were offered to express their opinions and vote for the companies that demonstrated the best results in each of the categories. Thereby, the professional trading community selected all winners of “Professional Trader Awards 2019”.

“Since the moment RoboMarkets was established in 2012, the Company’s activities have been focused on providing its clients with services of the highest quality. It is safe to say that RoboMarkets still gives the highest priority to this principle, which appears relevant up to the present days. We’re very pleased that experts in the industry expressed such high opinions about our efforts in this direction. It means that products and technological solutions offered by RoboMarkets meet all existing standards and allow clients to pursue their investment goals with with the best trading execution.” – says Anton Ivanov, RoboMarkets marketing officer.

About RoboMarkets

RoboMarkets is an investment company with the CySEC license No. 191/13. RoboMarkets offers investment services in many European countries by providing traders, who work on financial market, with access to its proprietary trading platforms. More detailed information about the Company’s products and activities can be found on the official website at www.robomarkets.com.


EURUSD: Euro consolidates after Friday’s fall

By Alpari.com

By the end of last week, the major currencies were up at the close of trading. The greatest growth against the US dollar was displayed by the British pound (+ 1.50%). The Swiss franc rose by 0.64%, the Canadian dollar by 0.62%, the euro by 0.53%, the Australian dollar by 0.50%, the New Zealand dollar by 0.42% – only the Japanese yen fell (-0.69%).

eurusd1

On Friday, GBP was the growth leader, AUD was the outsider.

eurusd2

At the close of Friday’s trading, the EURUSD pair ended up down nine points. After the price rallied to 1.1199, the price returned to 1.1112 (-87 points). Bulls lost all profits.

US President Donald Trump and Chinese officials said on Friday that they had agreed on the “first phase” of the trade deal. The two sides reached an agreement according to which Washington will suspend the introduction of tariffs on Chinese imports scheduled for Sunday, and Beijing, in turn, will intensify its purchase of American agricultural products. The trade agreement will be signed in early January in Washington.

The Conservative victory in the UK general election has already faded into the background, as Boris Johnson still needs to complete the deal to seal the UK’s withdrawal from the EU. It is believed that discussions regarding Brexit will be held in parliament and the country will formally leave the EU next year.

Today’s events (GMT+3):

  • 11:30 – 12:30 UK, France, Germany, Eurozone: Markit Manufacturing PMI (Dec), Markit PMI Composite (Dec), Markit Services PMI (Dec).
  • 16:30 Canada: Canadian Portfolio Investment in Foreign Securities (Oct).
  • 16:30 USA: NY Empire State Manufacturing Index (Dec).
  • 17:45 USA: Markit Manufacturing PMI (Dec), Markit Services PMI (Dec), Markit PMI Composite (Dec).
  • 20:00 UK: Bank Stress Test Results, Financial Stability Report.

161219

Current situation:

Friday’s expectations were fully justified. The price recovered to 1.1186, from which it slipped back fown to the 1.1112 level. Bears were almost able to block any overnight growth, which led to a daylight candle with a long upper shadow after closing.

In Asian trading, the euro followed the example of GBP, and rose against the dollar. There is still a market demand for risky assets after the first part of the trade deal between the US and China was negotiated, as well as the Conservative Party victory in the UK general election.

At the time of writing, the euro is worth 1.1141. The price reached the balance line and the resistance zone, which acted as support on Friday. Today we are inclined to see a flat correction between levels 1,1100-1,1145. According to the forecast, we can expect depreciation to 1.1102, and in the US session recovery to 1.1132. After the fall, growth to 1.1145 will come on Tuesday. If the price adheres to the forecast, then as far as the euro is concerned, we can start to consider the market’s readiness to move to 1.1050.

By Alpari.com

After clarity on trade and Brexit, here’s what to look for across the week ahead

By Hussein Sayed, Chief Market Strategist (Gulf & MENA), ForexTime

After many months of confusion and uncertainty, markets finally received a dose of clarity on two fronts. One on trade and the other on Brexit.

Washington and Beijing announced on Friday an agreement of an interim trade deal to partially reduce their trade conflict. According to this deal, China will purchase up to $200 billion in additional goods and services over the next two years on top of the amount it bought in 2017. The purchased products will include at least $40 billion of US agricultural goods. China will also refrain from competitive devaluations of the Yuan and tighten regulations on US intellectual property and forced technology transfer. In return, the US will cut tariffs on $120 billion of Chinese imports introduced in September to 7.5% from 15% and ditch planned tariffs on $160 billion of Chinese consumer products.

In the UK, Boris Johnson returns to power with a big majority, paving the way for the nation to leave the EU by the end of January. The hard part now begins for Mr. Johnson as he will try to negotiate a new trade agreement with the EU and have it ratified by end of 2020 before the transition period ends.

With two of the most imminent global risks resolved, markets have breathed a sigh of relief, sending US equities to record highs while the Pound has rallied more than three big figures after Thursday’s election results were announced.

Despite the achievements over the last week, the drama may not be completely over and there’s still news flow to keep traders busy.

Trump impeachment may have little impact on financial markets

President Trump is set to be impeached this week by the Democrat-led House with charges of abusing his power and obstructing Congress. However, Republicans are not likely to convict him in a Senate trial. Given this fact, markets are unlikely to be moved much by the impeachment unless other facts emerge. However, we could see some noise in US equities and fixed income markets, but this is not expected to be majorly market moving.

Will the Bank of England turn hawkish?

The Bank of England is expected to keep policy unchanged when it meets on Thursday. Traders who pushed sterling to 1.35 against the dollar on Friday would like to hear hawkish comments to further encourage the bullish trend.

Given that we have more clarity on the Brexit process, the BoE will put more focus on the economic outlook. ‘Getting Brexit done’ by early 2020 doesn’t necessarily mean improving economic conditions. We still have the transition period and a trade deal to be finalised. Until then, growth may remain weak and that’s likely to keep the BoE on the dovish side. Given that most of the good news has already been priced into the Pound, a dovish signal from the BoE will likely drive selling pressure.  We currently see 1.35 as a short-term top with further sterling appreciation likely to require an improvement in the UK macro outlook.

The Bank of Japan is also due to meet on Thursday, but no changes are expected on policy or forward guidance.

Economic data releases and Fed speakers

Given that the two imminent risks have been resolved, economic data are likely to become the main driver for currency traders. Monday brings the latest set of PMI data from the Eurozone, UK, and the US. The data may not reflect the optimism related to the US-China phase-one deal or the Conservative victory. Tuesday sees the release of UK labour market data and on Wednesday, we’ll have the final CPI reading from the Eurozone and an inflation reading from the UK, along with the German IFO business climate survey.  The last day of the working week brings the final reading on US third-quarter GDP growth.

Traders may also take some hints from Fed speakers Eric Rosengren and John Williams after the Federal Reserve kept interest rates unchanged last week and forecast no changes in policy for the year ahead.

Disclaimer: The content in this article comprises personal opinions and should not be construed as containing personal and/or other investment advice and/or an offer of and/or solicitation for any transactions in financial instruments and/or a guarantee and/or prediction of future performance. ForexTime (FXTM), its affiliates, agents, directors, officers or employees do not guarantee the accuracy, validity, timeliness or completeness, of any information or data made available and assume no liability as to any loss arising from any investment based on the same.


Forex-Time-LogoArticle by ForexTime

ForexTime Ltd (FXTM) is an award winning international online forex broker regulated by CySEC 185/12 www.forextime.com

This week in monetary policy: Croatia, Hungary, Morocco, Thailand, Czech Rep., Albania, Japan, Indonesia, Taiwan, Sweden, Norway, UK, Mexico, China, Mongolia, Colombia, Jamaica and Paraguay

By CentralBankNews.info

    This week – December 15 through December 21 – central banks from 18 countries or jurisdictions are scheduled to decide on monetary policy: Croatia, Hungary, Morocco, Thailand, Czech Republic, Albania, Japan, Indonesia, Taiwan, Sweden, Norway, United Kingdom, Mexico, China, Mongolia, Colombia, Jamaica and Paraguay.
    Following table includes the name of the country, the date of the next policy decision, the current policy rate, the result of the last policy decision, the change in the policy rate year to date, and the rate one year ago.
    The table is updated when the latest decisions are announced and can always accessed by clicking on This Week.
WEEK 51
DEC 15 – DEC 21, 2019:
CROATIA16-Dec2.50%002.50%         FM
HUNGARY17-Dec0.90%000.90%         EM
MOROCCO17-Dec2.25%002.25%         FM
THAILAND18-Dec1.25%-25-501.75%         EM
CZECH REPUBLIC18-Dec2.00%0251.75%         EM
ALBANIA18-Dec1.00%001.00%
JAPAN19-Dec-0.10%00-0.10%         DM
INDONESIA19-Dec5.00%0-1006.00%         EM
TAIWAN19-Dec1.375%001.375%         EM
SWEDEN19-Dec-0.25%00-0.25%         DM
NORWAY19-Dec1.50%0750.75%         DM
UNITED KINGDOM19-Dec0.75%000.75%         DM
MEXICO19-Dec7.50%-25-758.25%         EM
CHINA 20-Dec4.15%-5-204.35%         EM
MONGOLIA20-Dec11.00%0011.00%
COLOMBIA20-Dec4.25%004.25%         EM
JAMAICA20-Dec0.50%0-1251.75%
PARAGUAY20-Dec4.00%0-1255.25%


US stocks notch back to back records after deal news

By IFCMarkets

Dollar weakening halted

US stocks eked out fresh records on Friday after announcement of a phase one trade deal. The S&P 500 inched up 0.01% to new record 3168.80, gaining 0.7% for the week. Dow Jones industrial added 0.01% to 280135.38. The Nasdaq rose 0.2% to 8734.88. The dollar weakening reversed despite weaker than expected retail sales data showing sales rose just 0.2% on month in November. The live dollar index data show the ICE US Dollar index, a measure of the dollar’s strength against a basket of six rival currencies, rose 0.5% to 97.18 but is lower currently. Futures on US stock indices point to sharply higher openings today.

Washington will keep 25% tariffs on approximately $250 billion of Chinese imports, and cut in half the 15% tariffs on approximately $120 billion of Chinese implemented on September 1. The tariffs planned to be imposed on more than $150 billion in annual consumer goods on December 15 were removed. China will increase US agricultural purchases by $32 billion from previous levels over a two-year period to $40 billion annually, with an aim toward $50 billion.

FTSE 100 led European indexes gains as Conservative won elections

European stock markets ended solidly higher on Friday after US-China trade deal news. Both the GBP/USD and EUR/USD turned lower on Friday with both pairs gaining currently. The Stoxx Europe 600 Index gained 1.1% with travel and leisure shares leading advancers. The DAX 30 added 0.5% Friday to 13282.72. France’s CAC 40 advanced 0.6% and UK’s FTSE 100 rose 1.1% to 7353.44 as Prime Minister Boris Johnson’s Conservative Party won a decisive majority in the country’s general election.

GB100 testing resistance    12/16/2019 Market Overview IFC Markets chart

Australia’s All Ordinaries Index leads Asian Indexes gains

Asian stock indices are mixed today. Nikkei ended 0.3% lower at 23952.35 despite yen’s resumed slide against the dollar. China’s markets are mixed as Beijing said Sunday it would postpone punitive tariffs against US-made autos and other goods following the trade agreement: the Shanghai Composite Index is 0.6% higher while Hong Kong’s Hang Seng Index is down 0.5%. Australia’s All Ordinaries Index rallied 1.6% despite Australian dollar’s resumed climb against the greenback.

Brent futures prices are pulling back today. Prices hit 3-month high on Friday: Brent for February settlement gained 1.6% to $65.22 a barrel Friday. Saudi Aramco shares gained for a third consecutive day on Sunday, rising 1.63%. Aramco stock valuation hit a $2 Trillion Thursday. Saudi Arabia’s giant state-owned oil company listed 1.5% of its shares on Riyadh’s Tadawul exchange on December 11 in the world’s largest initial public offering (IPO). Additional demand, especially from “passive” investors, is expected this week, as Aramco’s shares will join the Tadawul index and global benchmarks such as MSCI.

Gold down

Gold prices are retreating today. Prices edged higher on Friday despite news China and the US reached a phase one trade deal. February gold gained 0.6% to $1481.20 an ounce Friday.

Market Analysis provided by IFCMarkets

Note:
This overview has an informative and tutorial character and is published for free. All the data, included in the overview, are received from public sources, recognized as more or less reliable. Moreover, there is no guarantee that the indicated information is full and precise. Overviews are not updated. The whole information in each overview, including opinion, indicators, charts and anything else, is provided only for familiarization purposes and is not financial advice or а recommendation. The whole text and its any part, as well as the charts cannot be considered as an offer to make a deal with any asset. IFC Markets and its employees under any circumstances are not liable for any action taken by someone else during or after reading the overview.

Defense Metals Offers Cheapest Call on Rare Earths and Brilliant Drill Holes

By The Gold Report

Source: Bob Moriarty for Streetwise Reports   12/12/2019

Bob Moriarty of 321gold looks at the LREO explorer’s drill results at its Canadian project.

There is no “right” price for anything, only what the market guesses something should be worth today based on the actions of a willing buyer and a willing seller. That said, my experience is that if you buy cheap and sell dear, you can do quite well. In reality the facts surrounding any investment are not nearly as important as the actions of investors based on their perceptions.

No one understands rare earths. First of all, they aren’t rare and like 99.999% of ordinary people, I couldn’t name two or three of them if my life depended on it. We use them, we need them, China pretty much controls the market on them. That’s it, that’s all I know and I know more than most.

Defense Metals Corp. (DEFN:TSX.V; DFMTF:OTC; 35D:FSEQB) just delivered the last of the 13 drill holes from the 2019 drill program consisting of about 2,000 meters of drilling. Like the majority of the rest of the holes in the program, the results were outstanding. Clearly no one understood them, the stock didn’t do anything.

But the 58 meters of 4.01% LREO is worth $484 USD in the ground. That’s about the same as 10 g/t gold over 58 meters. Any company drilling in Canada with those numbers would have a spurt of buying and probably double. But no one understands REOs so the stock price snores.

If you ignore the facts surrounding the drill hole there is another way of determining if it is cheap or if it is expensive is to look at the June 2019 43-101 that showed 11.37 million tonnes at an average grade of 1.96%. One percent LREOs is worth about $121 USD. That’s an in the ground value. The only purpose is to show value and to compare drill holes to something we do understand, like the price of gold.

If you accept $121 being the value of 1% LREOs and you do the math, you will realize their old 43-101 showed a gross metal value in the ground of just short of $2.7 billion USD. The entire market cap of DEFN today, after brilliant drill results, is less than 1/10th of 1% of that. I’d call that pretty cheap.

Defense Metals is a permanent call on the value of REOs. I don’t see any way it could get much cheaper. We are in Tax Loss Silly Season and if investors ever wake up to what DEFN has already, the sky is the limit.

I am an investor in DEFN. They are advertisers and naturally that makes me biased. Do your own due diligence.

Defense Metals Corp
DEFN-V $0.115 (Dec 12, 2019)
DFMTF – OTCQB 30.2 million shares
Defense Metals website.

Bob Moriarty founded 321gold.com, with his late wife, Barbara Moriarty, more than 16 years ago. They later added 321energy.com to cover oil, natural gas, gasoline, coal, solar, wind and nuclear energy. Both sites feature articles, editorial opinions, pricing figures and updates on current events affecting both sectors. Previously, Moriarty was a Marine F-4B and O-1 pilot with more than 832 missions in Vietnam. He holds 14 international aviation records.

Sign up for our FREE newsletter at: www.streetwisereports.com/get-news

Disclosure:
1) Bob Moriarty: I, or members of my immediate household or family, own shares of the following companies mentioned in this article: Defense Metals. Defense Metals is an advertiser on 321 Gold. I determined which companies would be included in this article based on my research and understanding of the sector.
2) The following companies mentioned are billboard sponsors of Streetwise Reports: Defense Metals. Click here for important disclosures about sponsor fees.
3) Statements and opinions expressed are the opinions of the author and not of Streetwise Reports or its officers. The author is wholly responsible for the validity of the statements. The author was not paid by Streetwise Reports for this article. Streetwise Reports was not paid by the author to publish or syndicate this article. The information provided above is for informational purposes only and is not a recommendation to buy or sell any security. Streetwise Reports requires contributing authors to disclose any shareholdings in, or economic relationships with, companies that they write about. Streetwise Reports relies upon the authors to accurately provide this information and Streetwise Reports has no means of verifying its accuracy.
4) The article does not constitute investment advice. Each reader is encouraged to consult with his or her individual financial professional and any action a reader takes as a result of information presented here is his or her own responsibility. By opening this page, each reader accepts and agrees to Streetwise Reports’ terms of use and full legal disclaimer. This article is not a solicitation for investment. Streetwise Reports does not render general or specific investment advice and the information on Streetwise Reports should not be considered a recommendation to buy or sell any security. Streetwise Reports does not endorse or recommend the business, products, services or securities of any company mentioned on Streetwise Reports.
5) From time to time, Streetwise Reports LLC and its directors, officers, employees or members of their families, as well as persons interviewed for articles and interviews on the site, may have a long or short position in securities mentioned. Directors, officers, employees or members of their immediate families are prohibited from making purchases and/or sales of those securities in the open market or otherwise from the time of the interview or the decision to write an article until three business days after the publication of the interview or article. The foregoing prohibition does not apply to articles that in substance only restate previously published company releases. As of the date of this interview, officers and/or employees of Streetwise Reports LLC (including members of their household) own securities of Defense Metals, a company mentioned in this article.

( Companies Mentioned: DEFN:TSX.V; DFMTF:OTC; 35D:FSEQB,
)

Silver Remains in ‘Corrective Downtrend’

By The Gold Report

Source: Clive Maund for Streetwise Reports   12/12/2019

Technical analyst Clive Maund charts the longer term picture for silver.

Like gold, silver has been in a corrective downtrend following its peak early in September, and it looks like it has further to run before its done, partly of course because we have a downside target for gold in the $1360–$1400 area before it turns up.

On the 6-month month we can see how it has been stumbling lower within a downtrend and it looks like it will break down through the lower boundary of this downtrend to drop to a final downside target probably at support in the $15.30–$15.60 area. It outperformed gold during the summer run up and has underperformed on the subsequent reaction, which is normal, and as we know, silver is weaker than gold during the early stages of a bull market, so this near-term downside target seems reasonable.


The last COT chart suggests that further losses are on the cards for the near term. Commercial short positions are still high and ideally these will need to moderate before another significant uptrend can develop.


Click on chart to pop-up a larger, clearer version.

The 10-year chart, like that for gold, presents a positive picture, While weaker than gold in the recent past of course, this chart shows silver rallying off the second low of a giant Double Bottom on strong volume in the summer, which is bullish, before reacting back. This reaction should present another good opportunity to load up on silver investments before the next major upleg starts.

Clive Maund has been president of www.clivemaund.com, a successful resource sector website, since its inception in 2003. He has 30 years’ experience in technical analysis and has worked for banks, commodity brokers and stockbrokers in the City of London. He holds a Diploma in Technical Analysis from the UK Society of Technical Analysts.

Sign up for our FREE newsletter at: www.streetwisereports.com/get-news

Disclosure:
1) Statements and opinions expressed are the opinions of Clive Maund and not of Streetwise Reports or its officers. Clive Maund is wholly responsible for the validity of the statements. Streetwise Reports was not involved in the content preparation. Clive Maund was not paid by Streetwise Reports LLC for this article. Streetwise Reports was not paid by the author to publish or syndicate this article.
2) This article does not constitute investment advice. Each reader is encouraged to consult with his or her individual financial professional and any action a reader takes as a result of information presented here is his or her own responsibility. By opening this page, each reader accepts and agrees to Streetwise Reports’ terms of use and full legal disclaimer. This article is not a solicitation for investment. Streetwise Reports does not render general or specific investment advice and the information on Streetwise Reports should not be considered a recommendation to buy or sell any security. Streetwise Reports does not endorse or recommend the business, products, services or securities of any company mentioned on Streetwise Reports.
3) From time to time, Streetwise Reports LLC and its directors, officers, employees or members of their families, as well as persons interviewed for articles and interviews on the site, may have a long or short position in securities mentioned. Directors, officers, employees or members of their immediate families are prohibited from making purchases and/or sales of those securities in the open market or otherwise from the time of the interview or the decision to write an article until three business days after the publication of the interview or article. The foregoing prohibition does not apply to articles that in substance only restate previously published company releases.

Charts and graphics provided by the author.

CliveMaund.com Disclosure:
The above represents the opinion and analysis of Mr Maund, based on data available to him, at the time of writing. Mr. Maund’s opinions are his own, and are not a recommendation or an offer to buy or sell securities. Mr. Maund is an independent analyst who receives no compensation of any kind from any groups, individuals or corporations mentioned in his reports. As trading and investing in any financial markets may involve serious risk of loss, Mr. Maund recommends that you consult with a qualified investment advisor, one licensed by appropriate regulatory agencies in your legal jurisdiction and do your own due diligence and research when making any kind of a transaction with financial ramifications. Although a qualified and experienced stock market analyst, Clive Maund is not a Registered Securities Advisor. Therefore Mr. Maund’s opinions on the market and stocks can only be construed as a solicitation to buy and sell securities when they are subject to the prior approval and endorsement of a Registered Securities Advisor operating in accordance with the appropriate regulations in your area of jurisdiction.

Assertio Therapeutics’ Shares Jump 50% on Sale of Shingles Pain Drug to Alvogen

By The Life Science Report

Source: Streetwise Reports   12/12/2019

Assertio Therapeutics’ shares rose 50% today after the firm reported that it has agreed to sell all rights to its Gralise drug used in the treatment of pain from shingles to Alvogen for $127.5 million. The transaction is expected to close in January 2020.

Shares of pharmaceutical company Assertio Therapeutics Inc. (ASRT:NASDAQ), which is focused in the areas of neurology, orphan and specialty medicines, today announced that “it has entered into an agreement with Alvogen, a global privately held pharmaceutical company, under which Alvogen will acquire and assume all responsibilities associated with the product Gralise® (gabapentin). The agreement is expected to close in early January 2020, subject to regulatory approval.”

The firm explained that Gralise is a prescription medicine used to treat postherpetic neuralgia (PHN) pain after shingles. PHN pain can be excruciating and often persists long after shingles scales heal and other symptoms have subsided.

“Under the terms of the agreement, Alvogen will pay Assertio a total value of $127.5 million. This includes $75 million in cash upon closing and the balance payable in the form of a royalty on the first $70 million in Gralise net sales.” The firms indicated that the majority of the royalties are expected to be paid during the first calendar year. Assertio advised that following the close of the transaction it will provide a complete update on the financial impact of the Gralise sale on the company.

Arthur Higgins, president and CEO of Assertio, commented, “This transaction continues the transformation of Assertio, allows us to focus on our growth products, CAMBIA® and Zipsor®, strengthens our balance sheet, and increases our flexibility for future business development opportunities.”

Assertio Therapeutics is headquartered in Lake Forest, Ill., and is focused on advancing patient care in the core areas of neurology, orphan and specialty medicines. The company stated that “it currently markets three FDA-approved products and continues to identify, license and develop new products that offer enhanced options for patients that may be underserved by existing therapies.”

Alvogen describes its business as “a global, privately owned pharmaceutical company focused on developing, manufacturing and selling generic, brand, over-the-counter medicines (OTC) and biosimilar products for patients around the world. The company has commercial operations in 35 countries with 2,800 employees and operates four manufacturing and development hubs in the U.S., Romania, Korea and Taiwan.” Alvogen’s product portfolio also includes a broad range of leading molecules for the treatment of conditions in the areas of oncology, cardiology, respiratory, neurology and gastroenterology.

Assertio Therapeutics began the day with a market capitalization of approximately $63.4 million with about 80.68 million shares outstanding along with a short interest of around 19%. ASRT shares opened more than 30% higher today at $1.03 (+$0.2448, +31.18%) over yesterday’s $0.78 closing price. The stock has traded today between $0.98 to $1.24 per share and is currently trading at $1.20 (+$0.41, +52.83%).

Sign up for our FREE newsletter at: www.streetwisereports.com/get-news

Disclosure:
1) Stephen Hytha compiled this article for Streetwise Reports LLC and provides services to Streetwise Reports as an independent contractor. He or members of his household own securities of the following companies mentioned in the article: None. He or members of his household are paid by the following companies mentioned in this article: None.
2) The following companies mentioned in this article are billboard sponsors of Streetwise Reports: None. Click here for important disclosures about sponsor fees.
3) Comments and opinions expressed are those of the specific experts and not of Streetwise Reports or its officers. The information provided above is for informational purposes only and is not a recommendation to buy or sell any security.
4) The article does not constitute investment advice. Each reader is encouraged to consult with his or her individual financial professional and any action a reader takes as a result of information presented here is his or her own responsibility. By opening this page, each reader accepts and agrees to Streetwise Reports’ terms of use and full legal disclaimer. This article is not a solicitation for investment. Streetwise Reports does not render general or specific investment advice and the information on Streetwise Reports should not be considered a recommendation to buy or sell any security. Streetwise Reports does not endorse or recommend the business, products, services or securities of any company mentioned on Streetwise Reports.
5) From time to time, Streetwise Reports LLC and its directors, officers, employees or members of their families, as well as persons interviewed for articles and interviews on the site, may have a long or short position in securities mentioned. Directors, officers, employees or members of their immediate families are prohibited from making purchases and/or sales of those securities in the open market or otherwise from the time of the interview or the decision to write an article until three business days after the publication of the interview or article. The foregoing prohibition does not apply to articles that in substance only restate previously published company releases.
6) This article does not constitute medical advice. Officers, employees and contributors to Streetwise Reports are not licensed medical professionals. Readers should always contact their healthcare professionals for medical advice.

( Companies Mentioned: ASRT:NASDAQ,
)

STACK Agreement ‘Positive’ for Area Operator

The Energy Report

Source: Streetwise Reports   12/12/2019

The deal details are relayed in a ROTH Capital Partners report.

In a Dec. 10 research note, ROTH Capital Partners analyst John White purported that a recent development in the industry is positive for Chaparral Energy Inc. (CHAP:NYSE) as its primary areas of operation are the STACK and MERGE plays in Oklahoma.

The development is an agreement between Devon Energy and Dow to co-develop part of Devon’s STACK acreage, with Dow committing about $100 million to drilling over the next four years. The two companies will start year by developing two drill units in Canadian County, where Chaparral “has 23,000 net acres with an average 66% interest” and “98% held by production,” White explained.

ROTH has a Buy rating and a $9 target price on Chaparral. The company currently trading at around $0.93 per share.

Sign up for our FREE newsletter at: www.streetwisereports.com/get-news

Disclosure:
1) Doresa Banning compiled this article for Streetwise Reports LLC and provides services to Streetwise Reports as an independent contractor. She or members of her household own securities of the following companies mentioned in the article: None. She or members of her household are paid by the following companies mentioned in this article: None.
2) The following companies mentioned in this article are billboard sponsors of Streetwise Reports: None. Click here for important disclosures about sponsor fees.
3) Comments and opinions expressed are those of the specific experts and not of Streetwise Reports or its officers. The information provided above is for informational purposes only and is not a recommendation to buy or sell any security.
4) The article does not constitute investment advice. Each reader is encouraged to consult with his or her individual financial professional and any action a reader takes as a result of information presented here is his or her own responsibility. By opening this page, each reader accepts and agrees to Streetwise Reports’ terms of use and full legal disclaimer. This article is not a solicitation for investment. Streetwise Reports does not render general or specific investment advice and the information on Streetwise Reports should not be considered a recommendation to buy or sell any security. Streetwise Reports does not endorse or recommend the business, products, services or securities of any company mentioned on Streetwise Reports.
5) From time to time, Streetwise Reports LLC and its directors, officers, employees or members of their families, as well as persons interviewed for articles and interviews on the site, may have a long or short position in securities mentioned. Directors, officers, employees or members of their immediate families are prohibited from making purchases and/or sales of those securities in the open market or otherwise from the time of the interview or the decision to write an article until three business days after the publication of the interview or article. The foregoing prohibition does not apply to articles that in substance only restate previously published company releases.

Disclosures from ROTH Capital Partners, Chaparral Energy Inc., Flash Note, December 10, 2019

Regulation Analyst Certification (“Reg AC”): The research analyst primarily responsible for the content of this report certifies the following under Reg AC: I hereby certify that all views expressed in this report accurately reflect my personal views about the subject company or companies and its or their securities. I also certify that no part of my compensation was, is or will be, directly or indirectly, related to the specific recommendations or views expressed in this report.

ROTH makes a market in shares of Chaparral Energy, Inc. and as such, buys and sells from customers on a principal basis

Shares of Chaparral Energy, Inc. may be subject to the Securities and Exchange Commission’s Penny Stock Rules, which
may set forth sales practice requirements for certain low-priced securities.

ROTH Capital Partners, LLC expects to receive or intends to seek compensation for investment banking or other business relationships with the covered companies mentioned in this report in the next three months.

( Companies Mentioned: CHAP:NYSE,
)