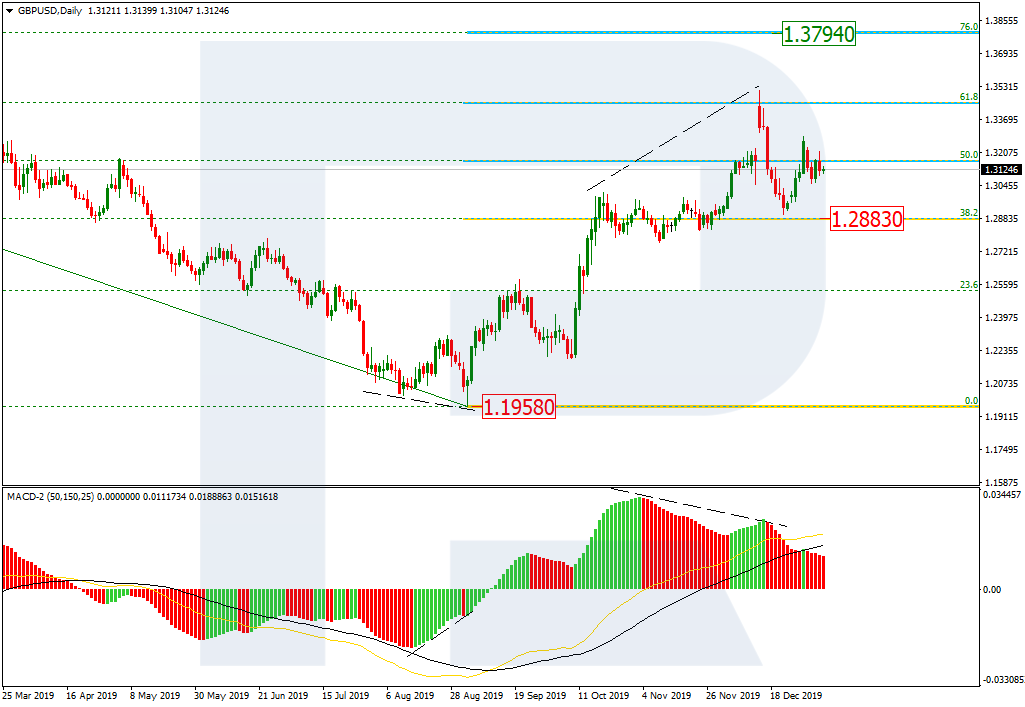
As we can see in the daily chart, there was a divergence on MACD, which made the pair reverse downwards after reaching 61.8% fibo. GBPUSD got very close to the support at 38.2% fibo (1.2883), but couldn’t test it. The current growth may be considered as a correction. However, taking into account a divergence on MACD, we may assume that the next descending impulse may break the support. Still, we shouldn’t exclude an opposite scenario: the instrument may start another rising wave towards 76.0% fibo at 1.3794.
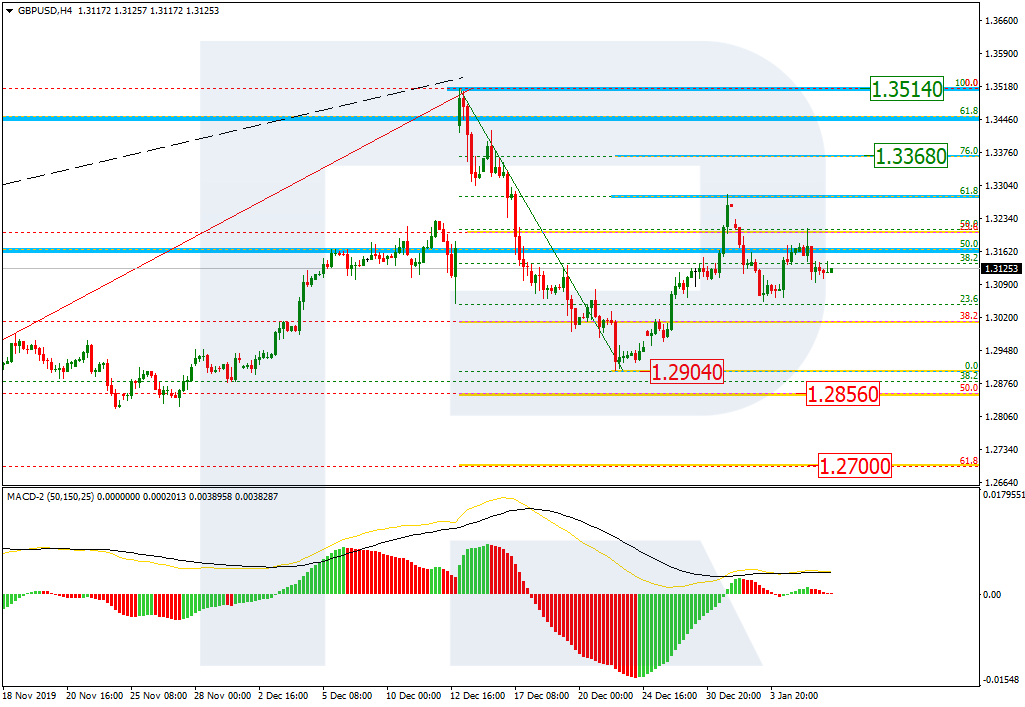
The H4 chart shows that the descending wave has corrected the previous uptrend by 38.2% fibo; the current growth may be considered as a correction, which has already reached 61.8% fibo and may continue towards 76.0% fibo at 1.3368 and the high at 1.3514. However, right now the price is falling to break the low at 1.2904. if it succeeds, the instrument may continue its mid-term decline towards 50.0% and 61.8% fibo at 1.2856 and 1.2700 respectively.
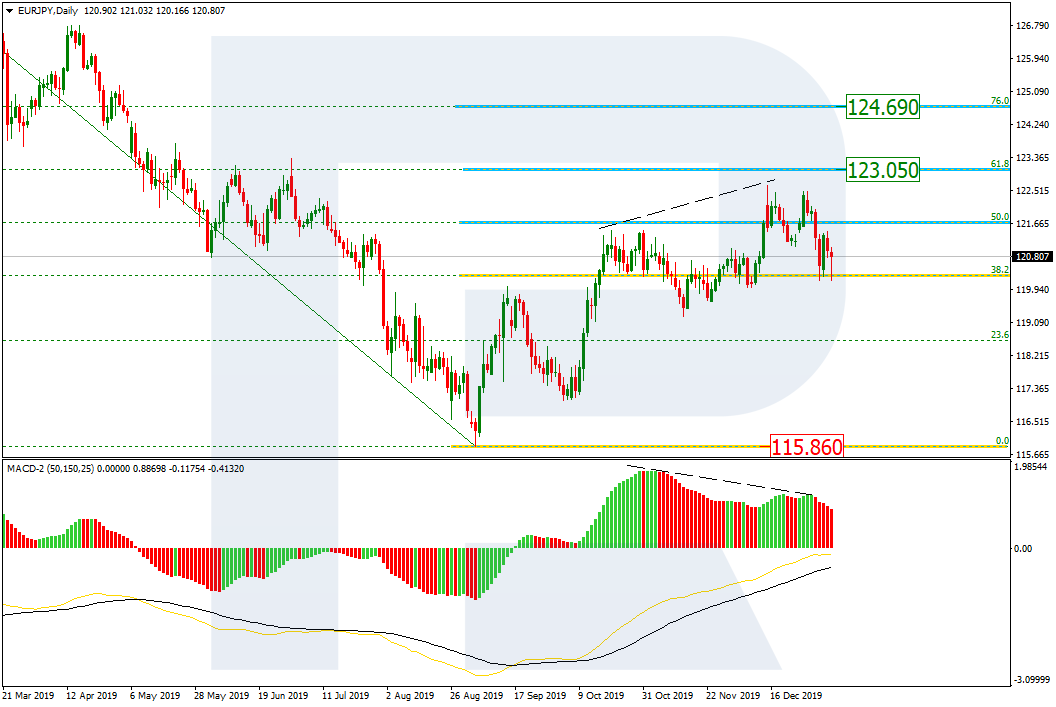
EURJPY, “Euro vs. Japanese Yen”
In the daily chart, there was a divergence on MACD, which made the pair reverse downwards after reaching 50.0% fibo. Right now, EURJPY is testing the mid-term local support. If the price breaks 38.2 fibo and fixes below it, the instrument will continue falling towards the low at 115.86. An alternative scenario implies that the price may rebound from the support and resume trading upwards to reach 61.8% and 76.0% fibo at 123.05 and 124.69 respectively.
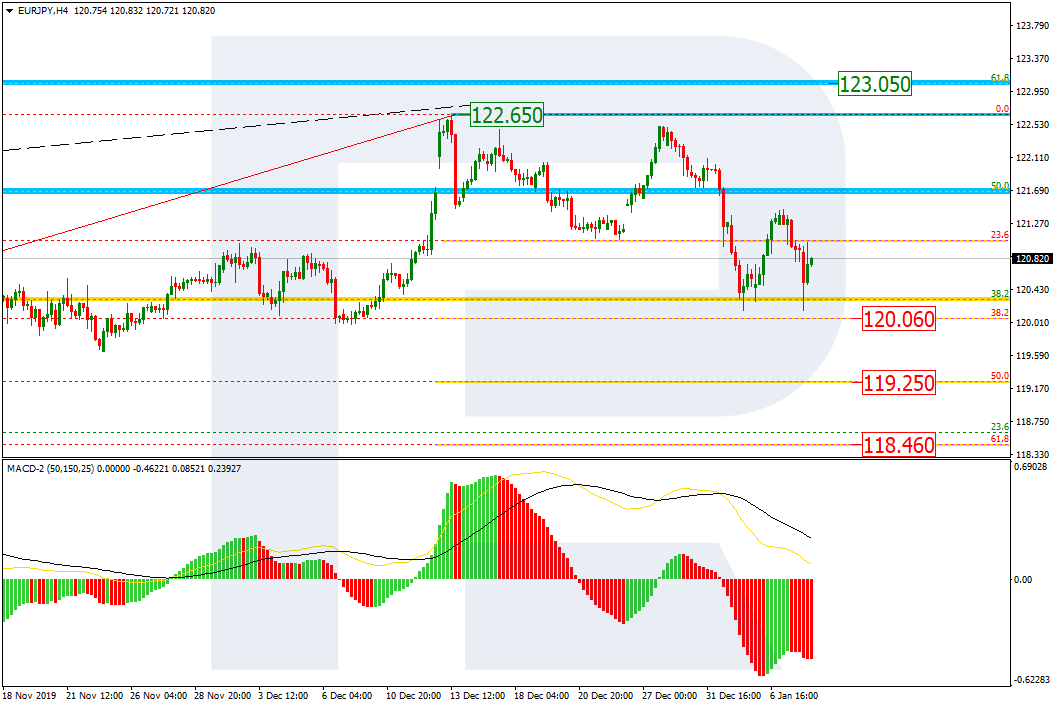
The H4 chart shows more detailed structure of the current descending correction. The pair is getting close to 38.2% fibo at 120.06. The next downside targets may be 50.0% and 61.8% fibo at 119.25 and 118.46 respectively. The resistance is the high at 122.65.
Attention! Forecasts presented in this section only reflect the author’s private opinion and should not be considered as guidance for trading. RoboForex LP bears no responsibility for trading results based on trading recommendations described in these analytical reviews.
The US dollar strengthened against a basket of major currencies. Yesterday, the dollar index (#DX) closed in the green zone (+0.37%). The conflict between the US and Iran is in the focus of attention. It should be recalled that last week, US President Donald Trump ordered the airstrike in Baghdad. As a result, Iranian General Qasem Soleimani was killed, that caused tensions between the countries. On Monday, US Secretary of Defense Mark Esper said the United States had not planned to withdraw troops from Iraq. On Wednesday, Iran carried a series of missile strikes at two US air bases in Iraq. After the attack, Iran vowed revenge and stated that it was considering 13 different ways to create a “historical nightmare” for the United States. These events support the demand for safe-haven currencies.
Optimistic economic data from the US were published yesterday. ISM non-manufacturing PMI counted to 55.0 in December, while experts expected 54.5. Today we expect a report on ADP nonfarm employment change. In December, the Canadian Ivey PMI slowed down from 60.0 to 51.9.
The “black gold” prices are rising after fall the day before. Currently, futures for the WTI crude oil are testing the $62.85 mark per barrel. At 17:30 (GMT+2:00), US crude oil inventories will be published.
Market Indicators
Yesterday, there was the bearish sentiment in the US stock market: #SPY (-0.28%), #DIA (-0.43%), #QQQ (-0.01%).
The 10-year US government bonds yield has declined. At the moment, the indicator is at the level of 1.79-1.80%.
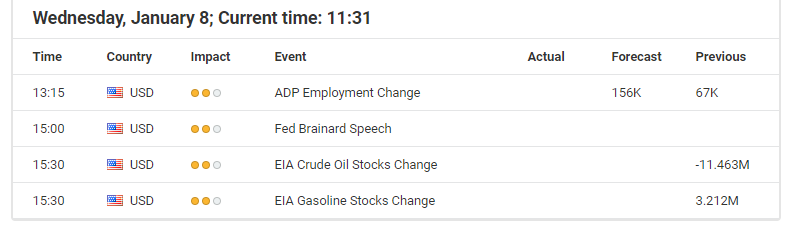
The Economic News Feed for 08.01.2020:
– ADP nonfarm employment change at 15:15 (GMT+2:00).
The EUR/USD currency pair is dominated by bearish sentiment. During yesterday’s trading, the drop in quotes exceeded 50 points. The trading instrument is currently consolidating. The local support and resistance levels are 1.11350 and 1.11650, respectively. We do not exclude a further decline in the EUR/USD currency pair. In December, the ISM U.S. Purchasing Managers Index accelerated from 53.9 to 55.0. Financial market participants continue to monitor developments in the Middle East. We recommend opening positions from key levels.
At 15:15 (GMT+2:00) the US will publish a report on the number of employees in the non-agricultural sector by ADP.
The price has fixed below 100 MA, which signals the strength of sellers.
The MACD histogram is in the negative zone and continues to decline, which sends a strong signal to sell EUR/USD.
The Stochastic Oscillator is near the oversold zone, the %K line has crossed the %D line. There are no signals at the moment.
Trading recommendations
Support levels: 1.11350, 1.11100
Resistance levels: 1.11650, 1.12000, 1.12350
If the price consolidates below 1.11350, expect a further drop to 1.11000-1.10800.
Alternatively the quotes could grow to a round level of 1.12000.
The GBP/USD currency pair
Technical indicators of the currency pair:
Prev Open: 1.31683
Open: 1.31194
% chg. over the last day: -0.42
Day’s range: 1.31044 – 1.31471
52 wk range: 1.1959 – 1.3516
An ambiguous technical pattern has developed on the GBP/USD currency pair. The trading instrument is in lateral movement. There is no defined trend. The pound is testing local support and resistance levels 1.31000 and 1.31600, respectively. Expect up-to-date information on Brexit. Open positions from key levels.
Today, the news background on the UK economy is quite calm.
Indicators do not give accurate signals: the price has crossed 50 MA and 100 MA.
The MACD histogram is in the negative zone but above the signal line, which gives a weak signal to sell GBP/USD.
The Stochastic Oscillator is in the neutral zone, the %K line has crossed the %D line. There are no signals at the moment.
Trading recommendations
Support levels: 1.31000, 1.30550, 1.30000
Resistance levels: 1.31600, 1.32250
If the price consolidates below the round level of 1.31000, expect the quotes to fall toward 1.30600-1.30400.
Alternatively, the quotes could grow toward 1.32000-1.32300.
The USD/CAD currency pair
Technical indicators of the currency pair:
Prev Open: 1.29658
Open: 1.29851
% chg. over the last day: +0.25
Day’s range: 1.29802 – 1.30072
52 wk range: 1.2949 – 1.3566
The USD/CAD currency pair continues to consolidate after a long fall. There is no defined trend. The local support and resistance levels are 1.29600 and 1.30000, respectively. In the near future, technical correction of the trading instrument is not ruled out. In December, the Canadian business activity index from Ivey slowed from 60.0 to 51.9. We recommend that you pay attention to the dynamics of prices for oil. Open positions from key levels.
The news background on the Canadian economy is calm.
Indicators do not give accurate signals: the price has crossed 50 MA and 100 MA.
The MACD histogram is near the 0 mark. There are no signals at the moment.
Stochastic Oscillator is in the neutral zone, the %K line is above the %D line, which indicates bullish sentiment.
Trading recommendations
Support levels: 1.29600, 1.29200
Resistance levels: 1.30000, 1.30250, 1.30500
If the price consolidates above the round level of 1.30000, expect a correction toward 1.30300
An alternative could be a decrease in the USD/CAD currency pair to 1.29400-1.29200.
The USD/JPY currency pair
Technical indicators of the currency pair:
Prev Open: 108.327
Open: 108.447
% chg. over the last day: +0.07
Day’s range: 107.651 – 108.513
52 wk range: 104.45 – 113.53
Since the beginning of this week, trading on the USD/JPY currency pair has been very active. The focus is on geopolitical tensions in the Middle East. Demand for “safe haven” currencies remains at a fairly high level. At the moment, the following local support and resistance levels can be distinguished: 108.150 and 108.600, respectively. We recommend that you pay attention to the dynamics of yield on US government bonds. Open positions from key levels.
The news background on the Japanese economy is calm.
Indicators do not give accurate signals: the price has crossed 50 MA and 100 MA.
The MACD histogram has approached the 0 mark. There are no signals at the moment.
The Stochastic Oscillator is near the overbought zone, the %K line has crossed the %D line. There are no signals at the moment.
Trading recommendations
Support levels: 108.150, 107.800
Resistance levels: 108.600, 108.850, 109.000
If the price consolidates below 108.150, expect the quotes to fall toward 107.800-107.600.
Alternatively, the quotes could grow toward 109.000.
Investors should remain “cautious and consistent” as Iran retaliates against the U.S. for killing one of its most revered military generals.
The message from Nigel Green, founder and CEO of deVere Group, comes as global financial markets roil on the news that an Iranian rocket attacked U.S. forces based in Iraq.
Mr Green comments: “Geopolitical tensions are certainly heightening, and this always creates uncertainty – something which markets typically loathe as it becomes more difficult to know where things are headed. In other words, they can’t price uncertainty.
“In many regards, the U.S.-Iran situation has now surpassed the trade war as the biggest risk to financial markets. This has been reflected in the current volatility.”
He continues: “Investors must, of course, monitor the U.S.-Iran situation, what has led to it and where it might play out.
“They need to ensure that their portfolios are properly diversified by geography, industrial sector and asset class in order to manage risk, to navigate the increasing volatility and also to take advantage of potential opportunities when they arise.
“If their portfolio is indeed well-diversified, for the time being at least I would urge investors to remain cautious and consistent. If portfolios are not properly diversified, recent events could serve as a wake-up call to reposition.”
He continues: “In terms of what investors should do against a fast-moving backdrop with many potential and far-reaching consequences, it is not ‘sell in a panic’, or the opposite reaction: ‘buy excessively’.
“It’s almost impossible to forecast what the market is going to do in the immediate future – and it is much too early to say what happens next and how investor sentiment will affect markets.”
He goes on to add: “However, what we do know is that over the longer-term the performance of stock markets is fairly predictable: they go up.
“For this reason, over a longer time horizon, investing in equities is almost universally recognized as one of the best ways people can accumulate wealth.”
The deVere CEO concludes: “It is often said that the key to investment success is to buy low and sell high. The only problem with that theory is that trying to accurately time the weakest point in the cycle is impossible.
“As such, it is best to just feed the money in over time in a measured way in order to take advantage of the long-term trend of stock markets to deliver long-term capital growth.
“History has shown us that panic-selling or panic-buying can be potentially financially damaging for investors.”
About:
deVere Group is one of the world’s largest independent advisors of specialist global financial solutions to international, local mass affluent, and high-net-worth clients. It has a network of more than 70 offices across the world, over 80,000 clients and $12bn under advisement
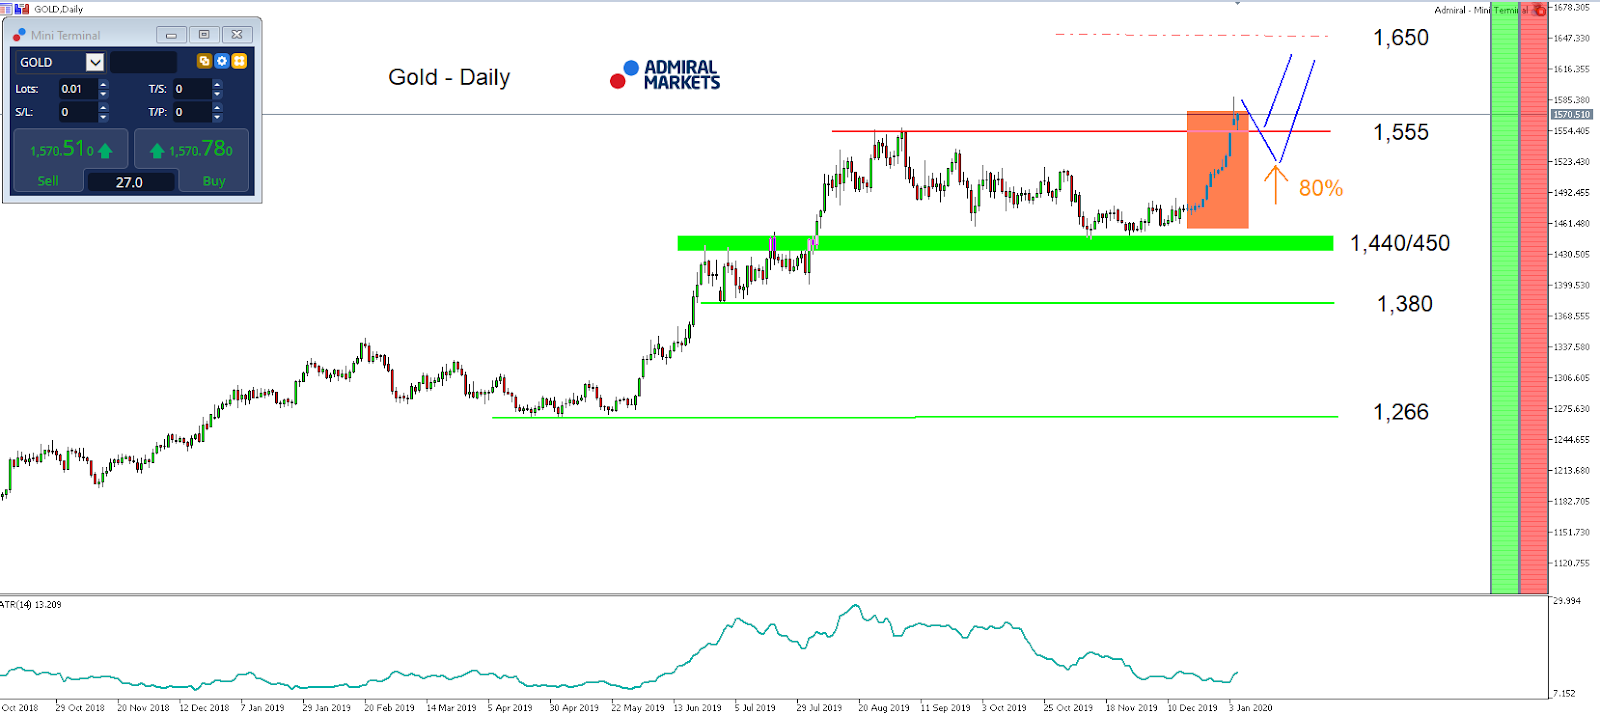
Driven by the recent developments in the Middle East last beginning last Friday and continuing through to today, as fears rise that a war between the US and Iran could be about to start, Gold profited from the resulting risk-off mode.
As 10-year US-Treasury yields drop, Gold took on momentum, driven also by the bullish seasonal window from Mid-December through Mid-January (displayed in orange).
While the mode looks a little extended on the upside, the yield-sensitive precious metal is also known for its trend stability, meaning that we could see a direct push up to the next potential target region of around 1,650/700 USD.
Technically, the break above the 2019 yearly highs around 1,557 USD is a clear bullish sign, with 1,557 USD and below 1,520/525 USD acting as potential long trigger.
On a daily time-frame Gold stays bullish as long as we trade above 1,440/450 USD:
Source: Admiral Markets MT5 with MT5-SE Add-on Gold Daily chart (between October 5, 2018, to January 7, 2020). Accessed: January 7, 2020, at 10:00pm GMT – Please note: Past performance is not a reliable indicator of future results, or future performance.
In 2015, the value of Gold fell by 10.4%, in 2016, it increased by 8.1%, in 2017, it increased by 13.1%, in 2018, it fell by 1.6%, in 2019, it increased by 18.9%, meaning that after five years, it was up by 28%.
Discover the world’s #1 multi-asset platform
Admiral Markets offers professional traders the ability to trade with a custom, upgraded version of MetaTrader 5, allowing you to experience trading at a significantly higher, more rewarding level. Experience benefits such as the addition of the Market Heat Map, so you can compare various currency pairs to see which ones might be lucrative investments, access real-time trading data, and so much more. Click the banner below to start your FREE download of MT5 Supreme Edition!
Disclaimer: The given data provides additional information regarding all analysis, estimates, prognosis, forecasts or other similar assessments or information (hereinafter “Analysis”) published on the website of Admiral Markets. Before making any investment decisions please pay close attention to the following:
This is a marketing communication. The analysis is published for informative purposes only and are in no way to be construed as investment advice or recommendation. It has not been prepared in accordance with legal requirements designed to promote the independence of investment research, and that it is not subject to any prohibition on dealing ahead of the dissemination of investment research.
Any investment decision is made by each client alone whereas Admiral Markets shall not be responsible for any loss or damage arising from any such decision, whether or not based on the Analysis.
Each of the Analysis is prepared by an independent analyst (Jens Klatt, Professional Trader and Analyst, hereinafter “Author”) based on the Author’s personal estimations.
To ensure that the interests of the clients would be protected and objectivity of the Analysis would not be damaged Admiral Markets has established relevant internal procedures for prevention and management of conflicts of interest.
Whilst every reasonable effort is taken to ensure that all sources of the Analysis are reliable and that all information is presented, as much as possible, in an understandable, timely, precise and complete manner, Admiral Markets does not guarantee the accuracy or completeness of any information contained within the Analysis. The presented figures refer that refer to any past performance is not a reliable indicator of future results.
The contents of the Analysis should not be construed as an express or implied promise, guarantee or implication by Admiral Markets that the client shall profit from the strategies therein or that losses in connection therewith may or shall be limited.
Any kind of previous or modeled performance of financial instruments indicated within the Publication should not be construed as an express or implied promise, guarantee or implication by Admiral Markets for any future performance. The value of the financial instrument may both increase and decrease and the preservation of the asset value is not guaranteed.
The projections included in the Analysis may be subject to additional fees, taxes or other charges, depending on the subject of the Publication. The price list applicable to the services provided by Admiral Markets is publicly available from the website of Admiral Markets.
Leveraged products (including contracts for difference) are speculative in nature and may result in losses or profit. Before you start trading, you should make sure that you understand all the risks.
Rising Australian building approvals bullish for AUDUSD
Building approvals in Australia rose 11.8% over month in November, 2019. Will the AUDUSD rise?
The price chart on 1-hour timeframe shows AUDUSD: H1 is in uptrend. The price is rising toward the 200-period moving average MA(200) which is declining. The Stochastic oscillator is about to reach the oversold zone.
A tidal wave of risk aversion engulfed financial markets on Wednesday, after Iran launched retaliatory missile strikes against US forces in Iraq.
Asian shares tumbled during early trade, while Gold punched above $1600 as escalating tensions in the Middle East fueled risk aversion and accelerated the flight to safety. Iran’s retaliation has raised fears of a full-blown conflict with the United States and this negative sentiment is poised to weigh on equity markets this week. There is a lot of uncertainty in the air with markets still in ‘wait and see’ mode until fresh clarity is provided on the US-Iran faceoff.
Markets have stabilised to some degree after the initial burst of volatility with investors taking some reassurance from the absence of US casualties and the measured tone of the official responses. President Trump is expected to make a statement later today in response to the Iranian strikes which should give fresh direction to markets.
Gold turbocharged by risk aversion
Gold exploded higher on Wednesday, punching above $1600 for the first time in almost seven years as geopolitical shocks sent investors flocking to safer segments of the market.
Escalating tensions in the Middle East have hit global risk appetite, boosting buying sentiment towards safe-haven assets. Gold bulls remain in the driving seat with further upside expected as uncertainty supports the flight to safety.
Focusing on the technical picture, the precious metal is heavily bullish on the daily charts as there have been consistent higher highs and higher lows. A solid daily close above $1600 may encourage a move towards $1630. Alternatively, sustained weakness below $1600 could trigger a retracement back towards $1570 and $1555.
Oil sensitive to geopolitics
The explosive moves witnessed in oil prices over the past few days highlight how sensitive the commodity is to geopolitical shocks.
WTI Crude blasted higher during early trading on Wednesday, breaking above $65 after Iran fired missiles at air bases in Iraq housing US troops. Given how this development raises fears of more tensions in the Middle East, Oil prices are poised to remain volatile in the near term with all eyes now on President Trump’s reaction and any signs of US retaliation. It will be interesting to see how far geopolitical shocks support oil prices before investors re-direct their focus back towards US-China trade and global growth.
Regarding the technical picture, WTI Crude pared some of its gains after spiking towards $65.65 during the early parts of Wednesday morning. Bears could re-enter the scene if prices close below $62.00 with $60.50 acting as the first level of support. However, a move above $64.00 could open the door back towards $65.65.
Disclaimer: The content in this article comprises personal opinions and should not be construed as containing personal and/or other investment advice and/or an offer of and/or solicitation for any transactions in financial instruments and/or a guarantee and/or prediction of future performance. ForexTime (FXTM), its affiliates, agents, directors, officers or employees do not guarantee the accuracy, validity, timeliness or completeness, of any information or data made available and assume no liability as to any loss arising from any investment based on the same.
Bob Moriarty of 321gold discusses the highly anticipated drill program at the Pueblo Grande property.
We are in the best time of the year to be invested in resource stocks. That is from late December into perhaps March. Add to that a quite insane U.S. President eager to accelerate the start of World War III for Israel and you have what at least will be an interesting environment until the U.S. either regains its sanity or becomes a pile of ashes.
I was in a war. I didn’t like it. I’m dead set against more American kids dying for Israel. We cannot prevent the bankruptcy of the U.S.: all the stupid and pointless wars of the last two decades have baked bankruptcy into the cake. When you start whacking leading figures in other countries, it is only natural that they start thinking doing the same to you is a great idea. Trump just painted a bull’s eye on the back of every American soldier in the Middle East.
I’ve been doing this for so long that everything is coming full circle. I visited the Dominican Republic to see a gold project immediately next to the massive Pueblo Viejo Gold Mine ten years ago. It was possible to stand on the Pueblo Grande project now owned by Precipitate Gold Corp. (PRG:TSX.V; PREIF:OTCBB) and throw a rock and hit an open pit at Pueblo Viejo.
Pueblo Viejo is jointly owned by Barrick Gold and Newmont/Goldcorp and produces 550,000 to 600,000 ounces of gold a year. It has an interesting history. The mine was the first gold mine in the new world put into production by the Spanish. It is the 5th largest gold mine in the world. Low prices forced the operator Rosario Dominicana into bankruptcy in 1999. It was put back into production by new operators in 2012 as gold prices improved.
An interesting project called the Pueblo Grande property surrounds the Pueblo Viejo Gold Mine on three sides. I visited the project a long time ago. It’s quite common for even the best of projects to go through multiple owners before someone actually moves it to production.
Linear Gold run by Wade Dawe first owned it. I went to see one of his projects in Mexico and wrote it up. Dawe demanded the right to edit the article before I posted it. That demand left a bad taste in my mouth. Then he insisted I totally rewrite it so it was all about him rather than the people doing all the valuable work on the Mexican project.
Nobody pays me to write about egomaniacs so I did something I have only done twice out of five hundred site visits. I let him know I wasn’t going to either rewrite or post the piece and I wouldn’t be charging him for my expenses. I’ve followed his career since; he seems to be one of those guys who look at mining company as if they are baseball trading cards. He hasn’t accomplished much, as least not for shareholders in the last ten years.
When I was looking at Linear, the project that I really wanted to see was the property surrounding the Pueblo Viejo mine because of nearly five hundred years of recorded history of mining there.
Linear traded the project to another company named Everton. Ten years ago I got my chance to see Pueblo Grande on a site visit with Everton. Barrick was knee deep into rehabilitation at Pueblo Viejo with plans to be back in production in 2012. On the Everton visit we were allowed to visit Barrick’s mine. It was impressive and remains one of the key gold mines in the world. It also is a major factor in the economy of the Dominican Republic because of the taxes they pay and employment they provide.
Everton got caught out at the very top of the market in 2011 with no cash on hand and declined by 99.5% from $2.25 in 2011 to a low of $0.005 in 2015. The stock was halted a couple of years ago. They still did, however, own the Pueblo Grande project. A year ago exactly Everton did a deal with Precipitate Gold (PRG-V) and sold their three remaining DR projects to Precipitate for 7 million shares, $25,000 in cash and a tiny 1-2% NSR.
The Pueblo Grande project is the main focus out of three different properties for Precipitate Gold. Data from over 29,500 meters in 220 drill holes has been compiled into a data set. While Everton owned the project they had results of 23.4 meters of 4.76 g/t Au, 10.6 meters of 2.96 g/t Au with 101.9 g/t Ag as well as 27.0 meters of 2.46 g/t gold and 26.7 g/t Ag. The project surrounds Pueblo Viejo on the west, north and east. It holds 9,863 square Ha.
As of now PRG has a market cap of about $23 million CAD. The share price has more than doubled in the last six weeks in anticipation of good results coming from the drill program. The five million warrants from the November 2019 private placement are in the money and would provide an additional $1 million for exploration. So for now the company can count on about $2 million for exploration and a couple of kicks at the can.
My close friend Quinton Hennigh is a director and an advisor to the company. Anyone who follows 321gold knows exactly how highly I regard Quinton. His projects mostly get it right and he hits homers out of the park on a regular basis.
There is more to the story but the company does an excellent job of communication in their presentation. I highly encourage any interested investor to go to see the presentation.
Precipitate Gold is an advertiser. I have participated in the last private placement and I eagerly look forward to their upcoming drill program. Do your own due diligence.
Bob Moriarty founded 321gold.com, with his late wife, Barbara Moriarty, more than 16 years ago. They later added 321energy.com to cover oil, natural gas, gasoline, coal, solar, wind and nuclear energy. Both sites feature articles, editorial opinions, pricing figures and updates on current events affecting both sectors. Previously, Moriarty was a Marine F-4B and O-1 pilot with more than 832 missions in Vietnam. He holds 14 international aviation records.
Disclosure: 1) Bob Moriarty: I, or members of my immediate household or family, own shares of the following companies mentioned in this article: Precipitate Gold. Precipitate Gold is an advertiser on 321gold. I determined which companies would be included in this article based on my research and understanding of the sector. 2) The following companies mentioned are billboard sponsors of Streetwise Reports: None. Click here for important disclosures about sponsor fees. 3) Statements and opinions expressed are the opinions of the author and not of Streetwise Reports or its officers. The author is wholly responsible for the validity of the statements. The author was not paid by Streetwise Reports for this article. Streetwise Reports was not paid by the author to publish or syndicate this article. The information provided above is for informational purposes only and is not a recommendation to buy or sell any security. Streetwise Reports requires contributing authors to disclose any shareholdings in, or economic relationships with, companies that they write about. Streetwise Reports relies upon the authors to accurately provide this information and Streetwise Reports has no means of verifying its accuracy. 4) The article does not constitute investment advice. Each reader is encouraged to consult with his or her individual financial professional and any action a reader takes as a result of information presented here is his or her own responsibility. By opening this page, each reader accepts and agrees to Streetwise Reports’ terms of use and full legal disclaimer. This article is not a solicitation for investment. Streetwise Reports does not render general or specific investment advice and the information on Streetwise Reports should not be considered a recommendation to buy or sell any security. Streetwise Reports does not endorse or recommend the business, products, services or securities of any company mentioned on Streetwise Reports. 5) From time to time, Streetwise Reports LLC and its directors, officers, employees or members of their families, as well as persons interviewed for articles and interviews on the site, may have a long or short position in securities mentioned. Directors, officers, employees or members of their immediate families are prohibited from making purchases and/or sales of those securities in the open market or otherwise from the time of the interview or the decision to write an article until three business days after the publication of the interview or article. The foregoing prohibition does not apply to articles that in substance only restate previously published company releases. As of the date of this article, officers and/or employees of Streetwise Reports LLC (including members of their household) own securities of Newmont Goldcorp, a company mentioned in this article.
aTyr Pharma’s shares traded 45% higher today after the firm reported that it had entered into a collaboration agreement with Kyorin Pharmaceutical for development and commercialization of its ATYR1923 drug in Japan.
This morning, biotherapeutics company aTyr Pharma Inc. (LIFE:NASDAQ), which is focused on development of innovative medicines based on novel immunological pathways, announced that “it has entered into a collaboration and license agreement with Kyorin Pharmaceutical Co. Ltd., a wholly owned subsidiary of Kyorin Holdings Inc. (4569:JP), for the development and commercialization of aTyr’s lead clinical candidate, ATYR1923, for interstitial lung diseases (ILDs) in Japan.”
The firm stated that the partnering agreement has a potential value exceeding $175 million if certain milestones are achieved. Under the terms of the agreement, aTyr will receive $8 million upfront, and is eligible to receive up to an additional $167 million subject to completion of outlined developments including regulatory and sales goals along with tiered royalties from net sales in Japan. Per the agreement, Kyorin will receive the exclusive right to develop and commercialize ATYR1923 in Japan for ILDs and will be responsible for funding all research, development, regulatory, marketing and commercialization activities in Japan.
Dr. Sanjay Shukla, president and CEO of aTyr, commented, “We are very pleased to enter into this collaboration with Kyorin, a leading respiratory focused pharmaceutical company in Japan, to advance ATYR1923 in an important market…As in the U.S., ILDs represent an area of significant unmet medical need in Japan, and Kyorin’s development and commercial capabilities will enhance our ability to improve the lives of patients with these serious conditions. We believe this collaboration further validates ATYR1923 and potentially accelerates development in other ILDs.”
Kyorin Holdings’ President and CEO Yutaka Ogihara added, “We are excited to enter into this agreement with aTyr and bring this new, potentially first-in-class drug to Japanese ILD patients.”
The company indicated that it is developing ATYR1923 as a potential therapeutic for patients with interstitial lung diseases. The firm also advised that it is currently enrolling a proof-of-concept Phase 1b/2a trial evaluating ATYR1923 in patients with pulmonary sarcoidosis.
aTyr Pharma is headquartered in San Diego, Calif., and states that it is a “biotherapeutics company engaged in the discovery and development of innovative medicines based on novel immunological pathways, and that its research and development efforts are concentrated on a newly discovered area of biology, the extracellular functionality and signaling pathways of tRNA synthetases.”
Based in Tokyo, Japan, Kyorin Holdings is a holding company that manages the Kyorin Group including Kyorin Pharmaceutical. Kyorin Pharma states that it uses a franchise customer strategy where its marketing efforts are focused on respiratory, otolaryngology and urology. The group manufactures and distributes prescription medicines and diagnostic drugs and in addition also manufactures and markets medical tools and equipment.
aTyr Pharma started off the day with a market capitalization of about $16.6 million with approximately 3.89 million shares outstanding. LIFE shares opened 70% higher today at $7.25 (+$2.99, +70.19%) over Friday’s $4.26 closing price. The stock has traded today between $5.97 and $7.62 per share on very high relative volume and is presently trading at $6.25 (+$1.99, +46.71%).
Disclosure: 1) Stephen Hytha compiled this article for Streetwise Reports LLC and provides services to Streetwise Reports as an independent contractor. He or members of his household own securities of the following companies mentioned in the article: None. He or members of his household are paid by the following companies mentioned in this article: None. 2) The following companies mentioned in this article are billboard sponsors of Streetwise Reports: None. Click here for important disclosures about sponsor fees. 3) Comments and opinions expressed are those of the specific experts and not of Streetwise Reports or its officers. The information provided above is for informational purposes only and is not a recommendation to buy or sell any security. 4) The article does not constitute investment advice. Each reader is encouraged to consult with his or her individual financial professional and any action a reader takes as a result of information presented here is his or her own responsibility. By opening this page, each reader accepts and agrees to Streetwise Reports’ terms of use and full legal disclaimer. This article is not a solicitation for investment. Streetwise Reports does not render general or specific investment advice and the information on Streetwise Reports should not be considered a recommendation to buy or sell any security. Streetwise Reports does not endorse or recommend the business, products, services or securities of any company mentioned on Streetwise Reports. 5) From time to time, Streetwise Reports LLC and its directors, officers, employees or members of their families, as well as persons interviewed for articles and interviews on the site, may have a long or short position in securities mentioned. Directors, officers, employees or members of their immediate families are prohibited from making purchases and/or sales of those securities in the open market or otherwise from the time of the interview or the decision to write an article until three business days after the publication of the interview or article. The foregoing prohibition does not apply to articles that in substance only restate previously published company releases. 6) This article does not constitute medical advice. Officers, employees and contributors to Streetwise Reports are not licensed medical professionals. Readers should always contact their healthcare professionals for medical advice.
Technical analyst Clive Maund discusses the effects of geopolitics on the price of gold.
In this update I am not going to repeat the points made in the last fairly comprehensive update, instead we are going to focus on the importance of the resistance level just above where the price is now, and impact of the killing of the Iranian general and its potential implications for the gold price.
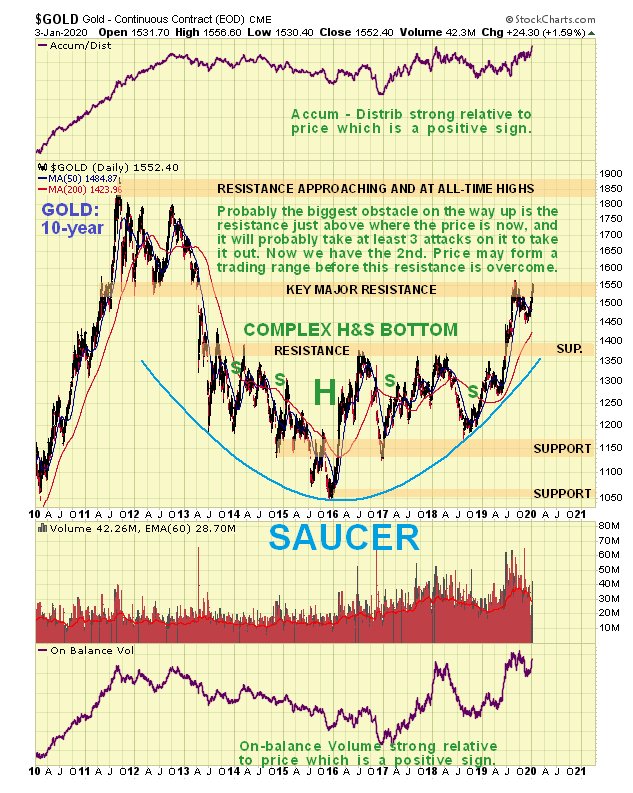
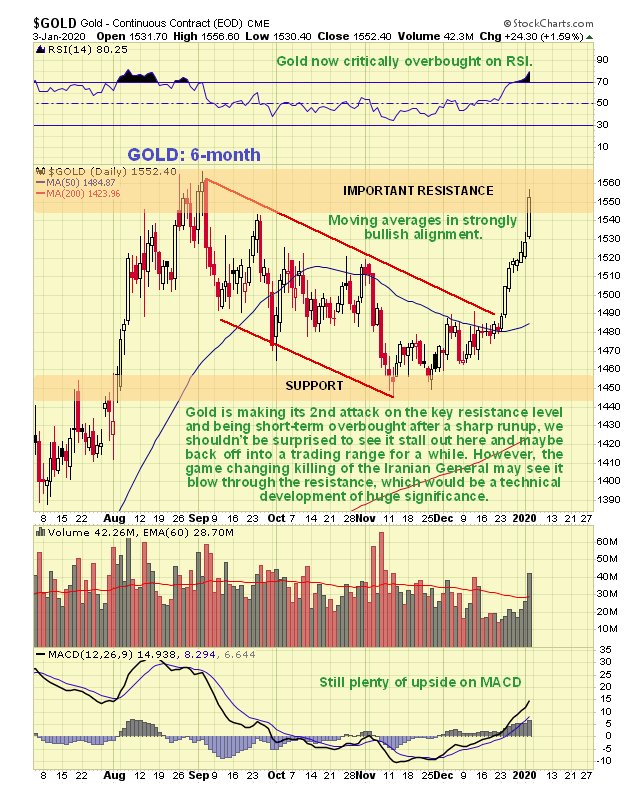
On the latest 10-year chart we can see that gold is making a second attack on the key major resistance level in the $1530-$1560 zone, which is hardly surprising considering what happened last week.
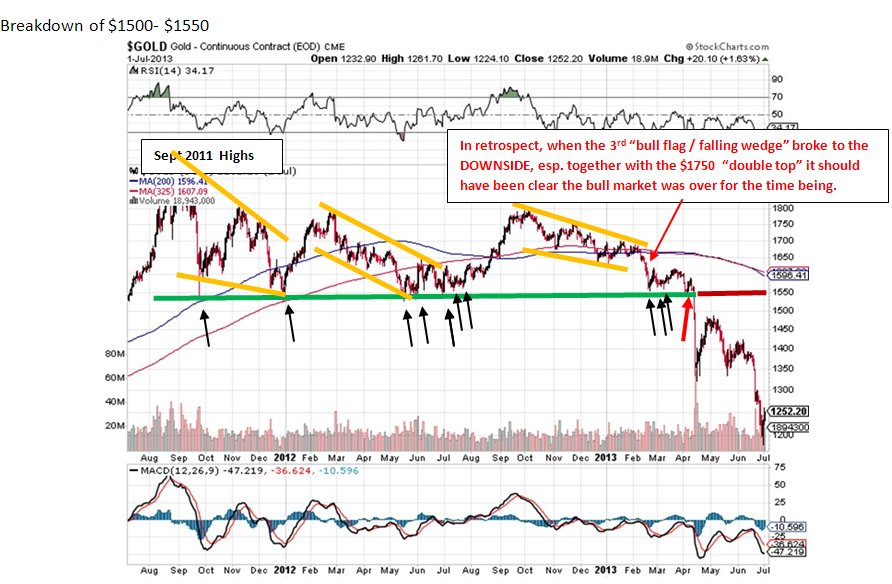
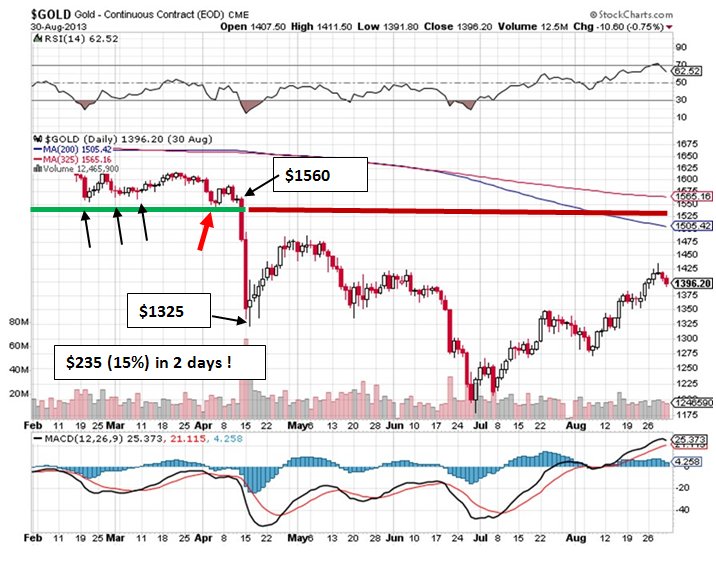
The reason that this resistance level is of such major importance is made abundantly clear by the following chart made by a subscriber and kindly forwarded to me, which I reproduce with his permission. As we can see gold made no less than five significant lows at this level between 2011 and 2013, before it finally crashed this support and plunged 15% in 2 days, so it is clearly of huge significance and is the biggest hurdle by far on the way up. Therefore, even given the latest mayhem in the Mideast, we should not be surprised if it now stalls out here and possibly backs off for a while to form a trading range, which is also made likely by its now being critically overbought on its RSI indicator and by the latest COTs, which we will look at lower down the page, coming in with really extreme readings again. This makes sense given that we now at a time of maximum tension.
From a subscriberhighlighting gold’s key support at the $1530-$1560 level, which is now of course strong resistance.
Detail showing the plunge that was triggered the failure of this support.
On the 6-month chart we can see how, after breaking out of the corrective downtrend in force from early September, gold has risen steeply, without one down day so far to become critically overbought on its RSI indicator as it drives into the zone of strong resistance with volume becoming heavy on Friday. This of course increases the chances of its reacting back the moment tension over the Mideast situation eases, even if only slightly.
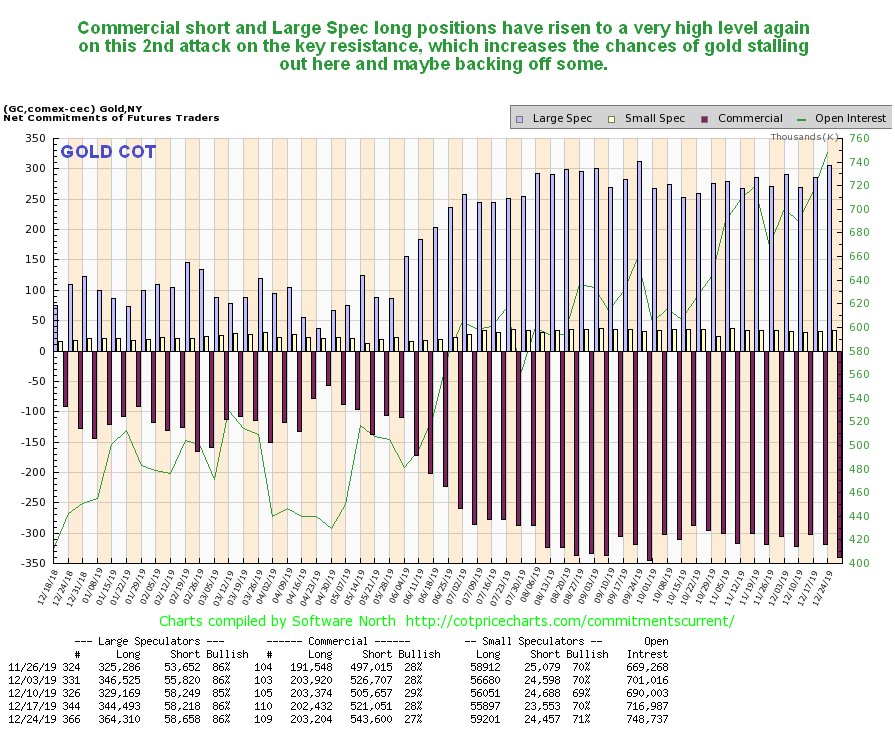
As for the COTs, they are showing extreme readings once more (chart is for 24th December), which suggest that, especially if tension over the Iran situation eases short term, gold will probably back off some into a consolidation pattern that will enable it to charge up sufficiently to take out the key resistance in due course.
Click on chart to pop-up a larger, clearer version.
Now we come to the possible impact of the U.S. killing of the top Iranian general. In order to figure out the real motivation for this act, we simply have to ask the usual question, “Who stands to gain?” The first interest group that stands to gain is the U.S. military, which receives about $700 billion of taxpayers’ money every year, and probably about $500 billion of this is in excess of what it needs to defend the homeland. So in order to justify this bloated budget it creates enemies and conflicts around the world. The next interest group is Israel, which controls the U.S. and uses the U.S. military as a sledgehammer to achieve its objectives, which include dominance of the Mideast. Iran is the big prize. Finally the Republicans and Trump himself stand to gain at the polls later this year as the population will predictably “rally round the flag” as a result of conflict with Iran. Knowing all this, we can quickly deduce that the killing of the Iranian general was an act of extreme provocation designed to trigger some kind of counterattack by Iran that can then be used as an excuse to launch a bombing campaign against it. Even if Iran exercises maximum restraint and does nothing beyond making empty threats to assuage its angry populace, it may still fall victim to an onslaught after a calculated false flag attack that is blamed on it. So whatever it does, it loses; it’s been put in a classic “zugzwang” situation.
It is clear that the killing of the Iranian general is the prelude to a military strike against Iran, which will probably take the form of an extensive and intensive bombing campaign that both Israel and the U.S. have been looking forward to for years, because a ground invasion is out of the question due to the geography and logistics. The goal as usual will be to destroy its military capability and wreck its infrastructure with the eventual aim of installing a puppet government and opening up the country to Western exploitation, and the wild card in all this will be whether Russia and China will do anything to prevent it, or just stand and watch. It is thought that they don’t have the nerve to intervene. In any event, if such a campaign is launched, we can expect the world to be gripped by an acute sense of crisis and gold will spike. Iran may have the ability to disrupt the flow of oil out of the Persian Gulf, albeit temporarily, which would trigger an oil price spike and a stock market crash.
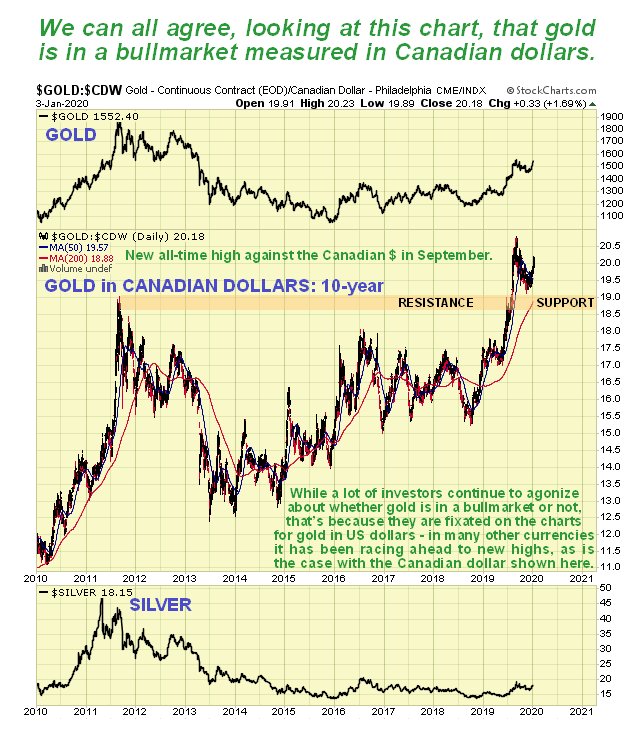
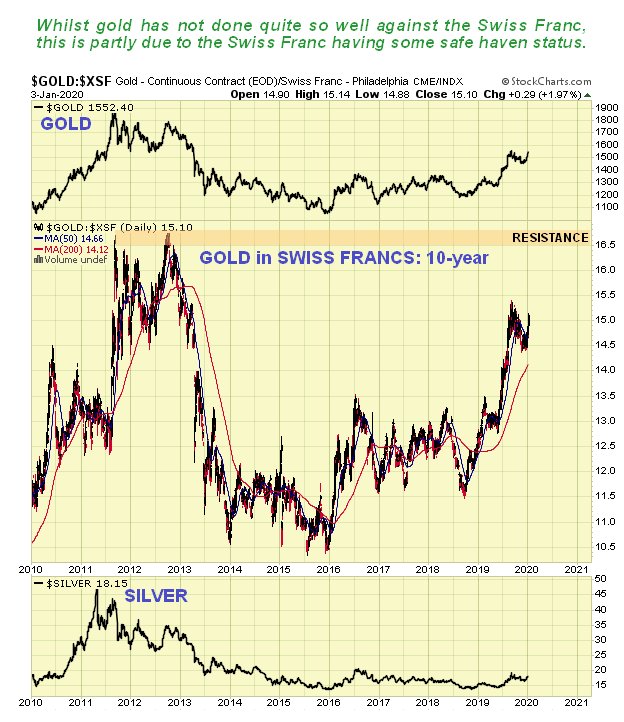
Last week’s updates concluded with a look at the highly bullish charts for gold measured against the Australian dollar and the Japanese yen, and this week we will look at gold against the Canadian dollar and the Swiss franc.
While many investors are still agonizing about whether gold is in a bull market or not, that is because they are fixated on the charts for gold in U.S. dollars. When you look at gold in other currencies you realize that it is already very much in a bull market, and recently made new highs against many currencies, like the Canadian dollar shown below.
Even against the Swiss franc, which amongst currencies enjoys some safe haven status, gold is performing better than it is against the dollar.
And we should remember that the dollar may not remain as “king of the hill” forever, especially as a number of major powers in the Asia especially are preparing to ditch it.
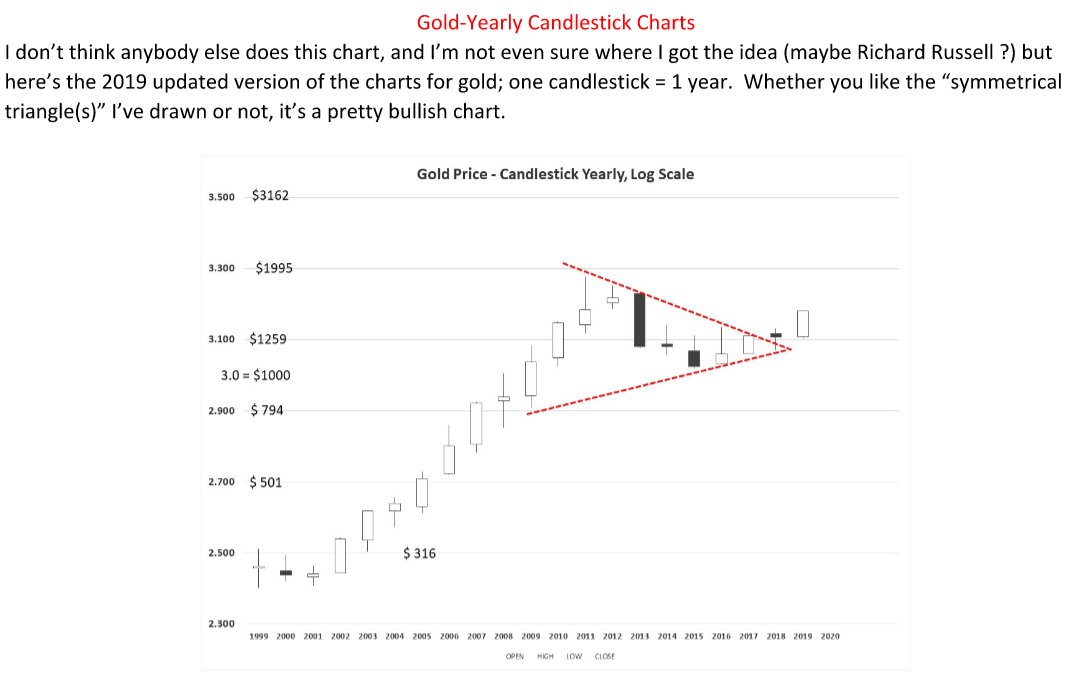
Finally, we are going to take a quick look at an unusual chart for gold submitted by the same subscriber as some of the charts above. It is unusual because it is a yearly candlestick chart, meaning that each candle on it is for an entire year. Its supreme advantage is that it keeps things simple. The Triangle shown on it is his interpretation, not mine. It certainly looks positive here with a big white candle for 2019, with the arithmetic version shown looking even more bullish. This type of chart also has a potential advantage for the writer, as if only this chart were used, I would only have to write these updates once a year.
Click on charts to pop-up larger, clearer versions.
Article originally published on CliveMaund.com on Sunday, January 5, 2020.
Clive Maund has been president of www.clivemaund.com, a successful resource sector website, since its inception in 2003. He has 30 years’ experience in technical analysis and has worked for banks, commodity brokers and stockbrokers in the City of London. He holds a Diploma in Technical Analysis from the UK Society of Technical Analysts.
Disclosure: 1) Statements and opinions expressed are the opinions of Clive Maund and not of Streetwise Reports or its officers. Clive Maund is wholly responsible for the validity of the statements. Streetwise Reports was not involved in the content preparation. Clive Maund was not paid by Streetwise Reports LLC for this article. Streetwise Reports was not paid by the author to publish or syndicate this article. 2) This article does not constitute investment advice. Each reader is encouraged to consult with his or her individual financial professional and any action a reader takes as a result of information presented here is his or her own responsibility. By opening this page, each reader accepts and agrees to Streetwise Reports’ terms of use and full legal disclaimer. This article is not a solicitation for investment. Streetwise Reports does not render general or specific investment advice and the information on Streetwise Reports should not be considered a recommendation to buy or sell any security. Streetwise Reports does not endorse or recommend the business, products, services or securities of any company mentioned on Streetwise Reports. 3) From time to time, Streetwise Reports LLC and its directors, officers, employees or members of their families, as well as persons interviewed for articles and interviews on the site, may have a long or short position in securities mentioned. Directors, officers, employees or members of their immediate families are prohibited from making purchases and/or sales of those securities in the open market or otherwise from the time of the interview or the decision to write an article until three business days after the publication of the interview or article. The foregoing prohibition does not apply to articles that in substance only restate previously published company releases.
Charts and graphics provided by the author.
CliveMaund.com Disclosure: The above represents the opinion and analysis of Mr Maund, based on data available to him, at the time of writing. Mr. Maund’s opinions are his own, and are not a recommendation or an offer to buy or sell securities. Mr. Maund is an independent analyst who receives no compensation of any kind from any groups, individuals or corporations mentioned in his reports. As trading and investing in any financial markets may involve serious risk of loss, Mr. Maund recommends that you consult with a qualified investment advisor, one licensed by appropriate regulatory agencies in your legal jurisdiction and do your own due diligence and research when making any kind of a transaction with financial ramifications. Although a qualified and experienced stock market analyst, Clive Maund is not a Registered Securities Advisor. Therefore Mr. Maund’s opinions on the market and stocks can only be construed as a solicitation to buy and sell securities when they are subject to the prior approval and endorsement of a Registered Securities Advisor operating in accordance with the appropriate regulations in your area of jurisdiction.