Silver Update: Likely to Back Off Short Term

By The Gold Report – Source: Clive Maund for Streetwise Reports   01/06/2020

Technical analyst Clive Maund discusses recent movements in the price of silver.

Unlike gold, which has forged ahead, there has been very little change in silver since the last update. This is not surprising because gold is stronger than silver during the earliest stages of a new bull market, while silver performs the strongest during the late stages of a bull market as investors “throw caution to the wind.”

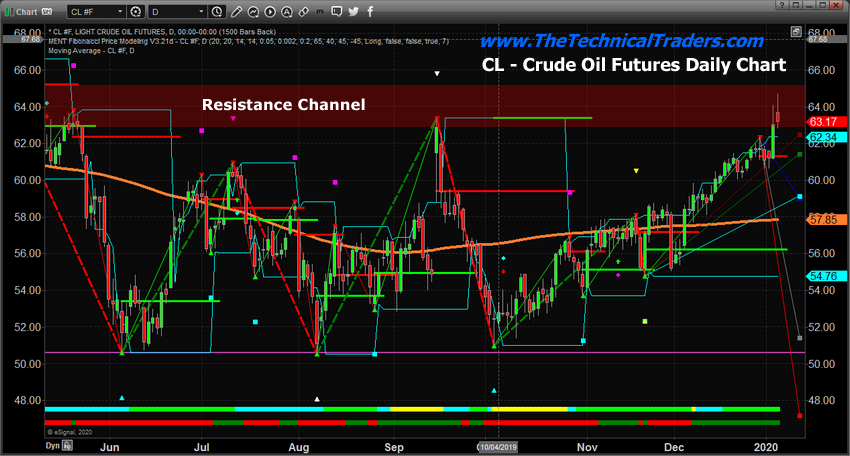
On the 6-month chart we can see that, although it has risen incrementally over the past week, silver has started to splutter beneath the resistance level shown, with a somewhat bearish (short-term) candle appearing on Friday.


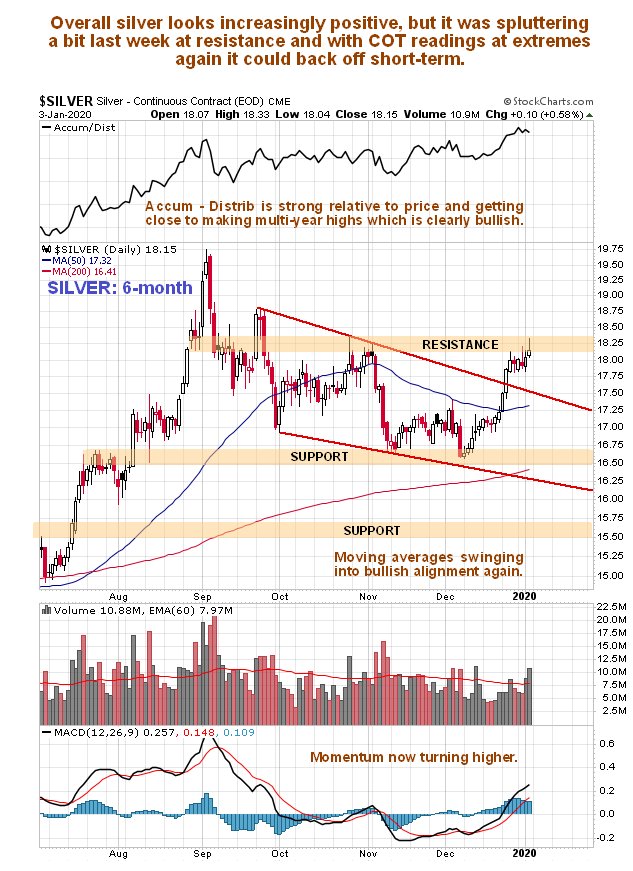
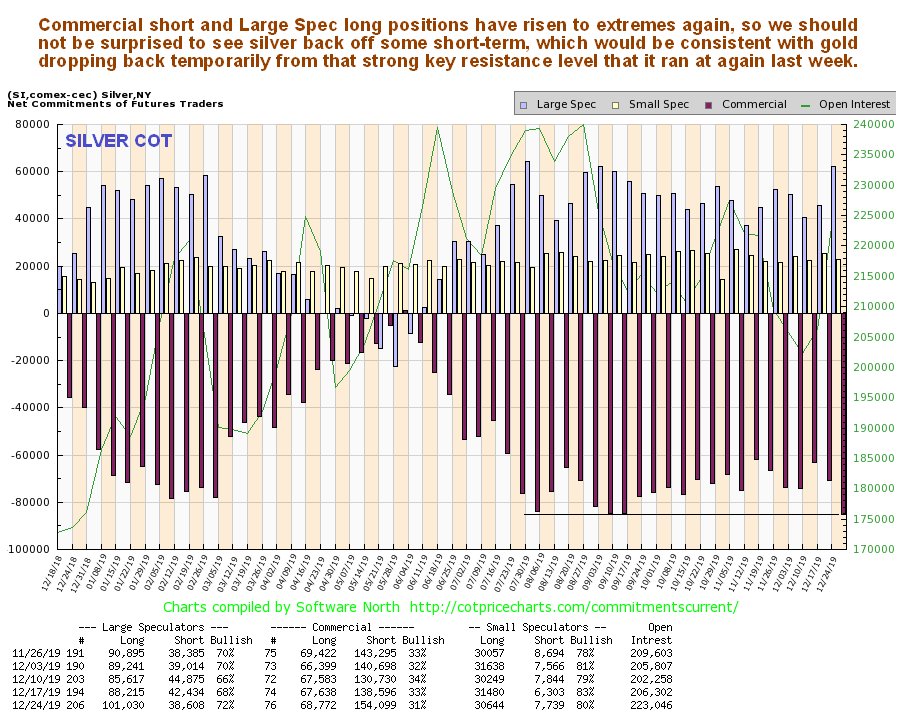
And given that the latest COT shows positions rising to extremes again by early last week, it seems likely that silver will back off some short term, which would be logical if the tension associated with the killing of the Iranian general eases somewhat. If it does it can, of course, be expected to coincide with gold dropping back from its key resistance level temporarily.

Click on chart to pop-up a larger, clearer version.

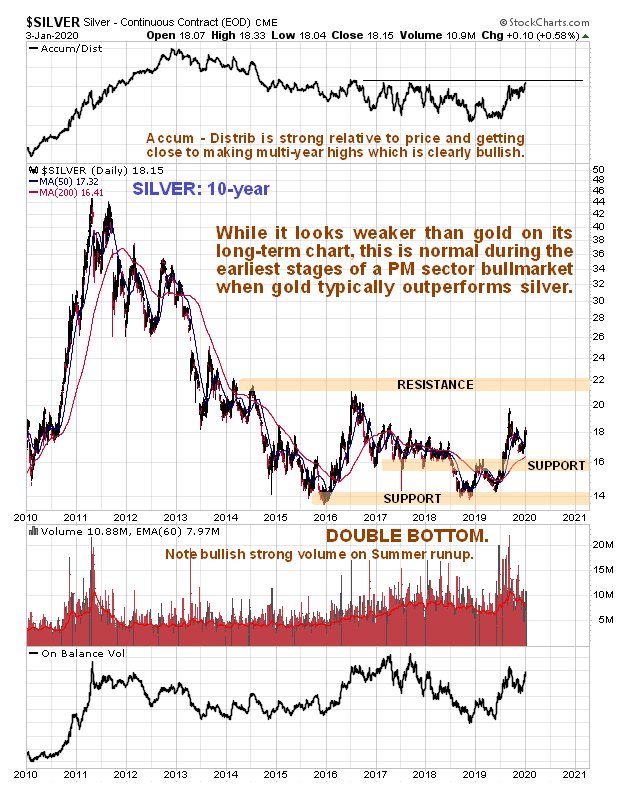
Overall though, silver’s charts continue to look positive, with the 10-year showing it starting to climb away from the second low of a giant Double Bottom, and this is especially the case because gold has already made a clear breakout from its giant multi-year base pattern. Thus, any near-term dip will be viewed as an opportunity to build positions across the sector further. Don’t forget the extraordinarily bullish long-term HUI index over gold and silver over gold charts that were included in the last update.

This article was originally published on CliveMaund.com on Sunday, January 05, 2020.

Clive Maund has been president of www.clivemaund.com, a successful resource sector website, since its inception in 2003. He has 30 years’ experience in technical analysis and has worked for banks, commodity brokers and stockbrokers in the City of London. He holds a Diploma in Technical Analysis from the UK Society of Technical Analysts.

Sign up for our FREE newsletter at: www.streetwisereports.com/get-news

Disclosure:
1) Statements and opinions expressed are the opinions of Clive Maund and not of Streetwise Reports or its officers. Clive Maund is wholly responsible for the validity of the statements. Streetwise Reports was not involved in the content preparation. Clive Maund was not paid by Streetwise Reports LLC for this article. Streetwise Reports was not paid by the author to publish or syndicate this article.
2) This article does not constitute investment advice. Each reader is encouraged to consult with his or her individual financial professional and any action a reader takes as a result of information presented here is his or her own responsibility. By opening this page, each reader accepts and agrees to Streetwise Reports’ terms of use and full legal disclaimer. This article is not a solicitation for investment. Streetwise Reports does not render general or specific investment advice and the information on Streetwise Reports should not be considered a recommendation to buy or sell any security. Streetwise Reports does not endorse or recommend the business, products, services or securities of any company mentioned on Streetwise Reports.
3) From time to time, Streetwise Reports LLC and its directors, officers, employees or members of their families, as well as persons interviewed for articles and interviews on the site, may have a long or short position in securities mentioned. Directors, officers, employees or members of their immediate families are prohibited from making purchases and/or sales of those securities in the open market or otherwise from the time of the interview or the decision to write an article until three business days after the publication of the interview or article. The foregoing prohibition does not apply to articles that in substance only restate previously published company releases.

Charts and graphics provided by the author.

CliveMaund.com Disclosure:
The above represents the opinion and analysis of Mr Maund, based on data available to him, at the time of writing. Mr. Maund’s opinions are his own, and are not a recommendation or an offer to buy or sell securities. Mr. Maund is an independent analyst who receives no compensation of any kind from any groups, individuals or corporations mentioned in his reports. As trading and investing in any financial markets may involve serious risk of loss, Mr. Maund recommends that you consult with a qualified investment advisor, one licensed by appropriate regulatory agencies in your legal jurisdiction and do your own due diligence and research when making any kind of a transaction with financial ramifications. Although a qualified and experienced stock market analyst, Clive Maund is not a Registered Securities Advisor. Therefore Mr. Maund’s opinions on the market and stocks can only be construed as a solicitation to buy and sell securities when they are subject to the prior approval and endorsement of a Registered Securities Advisor operating in accordance with the appropriate regulations in your area of jurisdiction.

‘We Must Get a Winner One Day’

By Money Metals News Service

For months, there have been signs of big changes in the gold and silver markets, including indications of exceptional tightness. For example:

— The resolution of most Comex gold and silver futures contracts through the mysterious emergency “exchange for physicals” mechanism.

— The extraordinary increase in open interest in Comex gold and silver futures contracts.

— The Comex’s strange and urgent increase in the out-of-system collateral permitted to be used by the major bullion banks that short gold.

— Increased acquisition of gold by central banks that are not afraid to reveal their admiration for an asset that central banks were generally unloading just a few years ago.

— The reversal of the usual gold flow from London to Switzerland, a flow now going from Switzerland to London, where the shorts largely reside and from where they would need to cover.

— Assertions by Swiss gold fund manager Egon von Greyerz and London metals trader Andrew Maguire that Swiss banks have already imposed “bail-ins” on depositors seeking to withdraw both gold and cash – in effect a gold and cash confiscation.

— The New York Fed’s recent sudden injection of tens of billions of dollars into the financial system through the big New York banks, some of which are bullion dealers, and the dubious explanations given for this.

— The refusal of the Federal Reserve, Treasury Department, and Commodity Futures Trading Commission to answer or even acknowledge a few basic critical questions about the gold market not just for GATA but also for a member of Congress.

— The inability of the usual smashes in the futures market to push gold and silver prices down much for long.

For some musing on these developments from two weeks ago, see this article recently published by Money Metals Exchange.

If the recent developments really signify extreme strain on the physical gold market, and if, as there is still every reason to believe, the ratio of paper claims to real metal ranges from 90 or 100 to 1 – that is, 90 or 100 claims for every ounce – an international crisis like the current one might induce enough physical buying at precisely the wrong moment for the price suppressors, causing delivery defaults and exposing the fraud of the paper gold system.

Besides, if supplies are really tight, it would not take an international crisis to explode the system. Any substantial demand for physical delivery might explode it. Indeed, many governments long have known about the fraud of the system and could have pulled the plug on it any time in the last 10 years or more just by taking enough delivery. The Russians and Chinese long have talked openly about the Western central bank policy of gold price suppression.

With the United States having recently weaponized the dollar to an unprecedented extent, is it so farfetched to imagine adversaries of the United States counterattacking by weaponizing gold, the former world reserve currency?

This is exactly what the U.S. government has feared as long ago as 1974, when U.S. Secretary of State Henry Kissinger was warned about the possibility by his deputy, Thomas O. Enders, in a meeting in Kissinger’s office. The remarkable transcript of this meeting was discovered in 2013 by gold researcher Jan Nieuwenhuis, then writing under his pen name, Koos Jansen, and was analyzed by GATA here.

The transcript remains on the internet site of the State Department’s historian, a wonderful if studiously overlooked explanation of the U.S. policy of gold price suppression:

Gold, Enders told Kissinger, is the international “reserve-creating instrument” and whoever has the most gold can change its price periodically and thereby enrich himself and alter all the world’s financial valuations in his favor. Gold, Enders explained, is the great threat to the dollar and U.S. control of the world financial system and as such it must be pushed out of the system.

In any case, the previous U.S.-instigated gold price-control system, the London Gold Pool, failed in 1968 for geopolitical reasons and the current gold price control system will fail eventually too. As was said by the leader of the doomsday cult first portrayed by some British comedians including Peter Cook and Dudley Moore back in the 1960s: “We must get a winner one day.”

Tomorrow would be as good as any!


The Money Metals News Service provides market news and crisp commentary for investors following the precious metals markets.

Gold Just Broke Through A Key Level

By Money Metals News Service

For the first time in more than six years, gold broke through a key level. Gold surged on Friday due to the geopolitical tensions stemming from the Middle East after the U.S. took out Iran’s top military leader. During early trading in the early Asian markets, the gold price continued even higher, reaching $1,579.

This morning, gold is trading at the $1,575 level. It will be interesting to see if gold closes at the end of the day near its high or a low. The key resistance level is $1,550, which gold surpassed by $25. Here is gold’s monthly chart below (each candlestick represents one month of trading).

Gold Price (January 3, 2020) - Gold Broke Through $1,550 Level

If you look at the “Larger View” insert, I have superimposed the candlestick breaking through the Key level. Unfortunately, Stockcharts.com does not provide a live chart for the metals or commodities. We have to wait until the close of trading to see the new candlestick price level. I find this quite odd because they recently added “Live” Crypto Trading charts for Bitcoin and several others.

Regardless, the Gold price finally broke through this level, and for it to remain in a bullish trend in the monthly chart below, it will have to close above the $1,550 (actually $1,560) level by the end of January. If we look at the next chart, the gold price surpassed the high of $1,566 in September:

Gold Price (January 3, 2020) - Gold Reached a High of $1,577

According to Kitco.com, as of 9:43 am EST, the gold price reached a high of $1,577 and is currently trading at $1,573. And, if we look at the weekly gold chart, we can clearly see gold breaking through the $1,550 level:

Gold Price (January 3, 2020) - Gold Broke Through $1,550 Level (Weekly Chart)

Here we can see the three Key Levels for gold. As I mentioned in previous articles and youtube videos, after the big run-up in the summer, I thought gold would retest its breakout level of $1,360 before moving higher. While it’s not a guarantee that gold would retest this $1,360 level before moving higher, traders typically expect it to happen.

Furthermore, the latest Gold COT Report shows the Commercial Net Short position at the highs from last summer:

Gold COT Report

This is a very strange situation for gold. Due to the Fed continued Repo Market intervention and the $60 billion a month in U.S. Treasury purchases, it seems that gold just won’t selloff or correct down to that $1,360 breakout level. However, with the Commercial net short position at a high, logic suggests that gold will likely correct lower before resuming its trend higher in 2020.

Moreover, at some point, the bloated U.S. stock market will need to experience a correction lower, even if it continues higher due to the massive Fed and Central Bank liquidity. Thus, the gold and silver price may correct lower with the broader markets once a correction takes place.

But, again… this is only short-term trading possibilities. The situation for the U.S. Financial and economic system is heading for a BRICK WALL. Only 1% or less of investors have diversified some of their assets into gold (and silver).


The Money Metals News Service provides market news and crisp commentary for investors following the precious metals markets.

Crude Oil Reverses Lower Again After US Missile Attack

By TheTechnicalTraders.com

Normally, after tensions between Iran/Iraq and the US flare-up, Oil and Gold rally quite extensively but reversed sharply lower by the end of the session.

Yes, Gold is 1% higher today and was up over $35 overnight, but Crude Oil has actually moved lower today which is a fairly strong indication that disruptions in oil supply from the Middle East are not as concerning as they were 10+ years ago. Traders and investors don’t believe this isolated targeted missile attack will result in any extended aggression between the US and Iran.

When past conflicts in the Middle East happened, Oil would typically rally and Gold would spike higher as well.  Consider this a reflex action to uncertain oil supply issues and concerns that global market uncertainty could crash the markets.  Gold seems like an easy expectation related to this type of uncertainty as it continues to act as a hedge against many risks like missiles/war, financial uncertainties etc…

In my pre-market video report to subscribers today (Monday, Jan 6th) I pointed out how the price of crude oil was testing a critical resistance area form the last time there were missiles fired. Today’s reversal is not a huge surprise and in fact, it looks like an exhaustion top.

Oil, on the other hand, has experienced one of the longer price declines in recent history, from the peak price near $147 near July 2008 to levels currently near $63.  But we saw a low price for oil below $30 (near February 2016).

Crude Oil Daily Chart

I believe a technical resistance channel may be pushing Oil prices lower today as the price has continued to rotate lower after moving into this extended Resistance Channel.  It may be that global traders don’t believe this conflict with Iran will result in any type of massive oil supply disruption or risk for the global markets right away.  The Resistance Channel, between $63 and $65.50, has continued to act as a price ceiling over the past 7+ months.

Crude Oil Weekly Chart

Our proprietary Fibonacci Price Modeling system is highlighting similar levels near $64 and $50.  This price modeling system maps and tracks price rotation using a proprietary adaptive Fibonacci price theory model.  These levels, highlighted on this chart, represent immediate price target levels for any upside move (CYAN, already reached) and any downside move (BLUE, suggesting a move back towards $50 may be in the works).

If Oil is not capable of breaking above this Resistance Channel, then Fibonacci Price Theory would suggest price must turn lower and attempt to establish a new LOW PRICE level that is below recent low price levels.

If this Resistance Channel continues to act as a solid price ceiling, Crude Oil may turn lower over the first few quarters of 2020 and attempt to target levels near or below $50 fairly soon.  Skilled traders should prepare for this type of move and identify opportunities for profits in the near future.

In fact, I also gave subscribers a head up that GDXJ and TLT were going to gap higher and likely be under pressure all session. Also, I showed how the SP500 was going to gap lower deep into oversold territory and likely rally strongly just like last Friday, all of these things happened perfectly today.

Pre-market GDXJ, SPY, TLT warning of price gaps into extreme territories beyond the small colored lines: Red (overbought level), and Green (oversold level)

Pre-Market Chart Analysis

End Of Day Market Movements

My point is my team and I have a good pulse on the major markets and can profit during times when most others can’t which is why you should join my Wealth Trading Newsletter for index, metals, and energy trade alerts. Visit our website to learn how you can see what this research is telling us.

I am going to give away and ship out silver and gold rounds to anyone who buys a 1-year, or 2-year subscription to my Wealth Trading Newsletter. You can upgrade to this longer-term subscription or if you are new, join one of these two plans listed below, and you will receive:

1oz Silver Round FREE 1-Year Subscription 
1/2 Gram Gold Bar FREE 2-Year Subscription

SUBSCRIBE TO MY TRADE ALERTS AND 
GET YOUR FREE BULLION!
Free Shipping!

Chris Vermeulen

TheTechnicalTraders.com

Market mood calms as Middle East concerns fade

By Lukman Otunuga, Research Analyst, ForexTime

  • Asian stocks rebound as investors reassess US-Iran faceoff
  • Oil surrenders gains as markets await Iran’s response
  • US ISM non-manufacturing data in focus
  • Gold retreats from six-year high

Asian shares jumped on Tuesday morning as investors re-evaluated the risk of a full-blown conflict between the United States and Iran.

A sense of optimism over the global economy coupled with US-China trade deal hopes is lifting the market mood while shaking off geopolitical concerns. However, the US-Iran faceoff will remain a geopolitical risk that presents unwelcome levels of uncertainty to financial markets. Heightened tensions in the Middle East are poised to fuel negative sentiment, ultimately denting appetite for riskier assets. Market players are likely to adopt a ‘wait and see’ approach until more clarity and direction is offered on this development.

Is the Oil rally built on shaky foundations?

Oil prices fell more than 1% on Tuesday as investors reconsidered the likelihood of Middle East supply disruptions amid the US-Iran faceoff.

WTI Crude and Brent have both gained over 3% year-to-date as the US-Iran tensions sparked fears over negative supply shocks in the markets. Given how the Middle East is home to major oil-producing countries, the threat of supply disruptions has offered a boost to oil in the near term.

However, geopolitical tensions may not be enough to keep oil prices elevated in the medium to longer term. Continued oil upside faces multiple obstacles in the form of rising US Shale production and weak oil demand growth in the face of renewed US-China trade tensions. Although geopolitical shocks could offer a short-term boost, developments revolving around US-China trade talks and global growth remain the primary drivers influencing Oil’s outlook.

Dollar steady ahead of ISM data

All eyes will be on the pending US ISM non-manufacturing data for December which is forecasted to print at 54.5.

A report that meets or exceeds expectations should boost optimism over the US economy, consequently supporting the Dollar. Technical traders will continue to closely observe how the Dollar Index trades around the 96.50 regions. A rebound towards 97.00 could be on the cards if 96.50 proves to be a reliable support level.

Commodity spotlight – Gold

Gold pared some of its gains after hitting a six-year high on Monday, although its finding support at the $1560 psychological level for the time being.

Tensions in the Middle East are likely to stimulate risk aversion, consequently boosting investor’s appetite for Gold. Although prices have strong bullish momentum, further upside will depend on how prices react around $1555. The precious metal should trend higher towards $1600 as long as $1555 proves to be reliable support. Alternatively, a breakdown below this level may open the door towards $1535.

Disclaimer: The content in this article comprises personal opinions and should not be construed as containing personal and/or other investment advice and/or an offer of and/or solicitation for any transactions in financial instruments and/or a guarantee and/or prediction of future performance. ForexTime (FXTM), its affiliates, agents, directors, officers or employees do not guarantee the accuracy, validity, timeliness or completeness, of any information or data made available and assume no liability as to any loss arising from any investment based on the same.


Forex-Time-LogoArticle by ForexTime

ForexTime Ltd (FXTM) is an award winning international online forex broker regulated by CySEC 185/12 www.forextime.com

EURSEK Analysis: Preparing for publication of economic data in Sweden

By IFCMarkets

Preparing for the publication of economic data in Sweden

In this review, we would like to draw your attention to the Euro/Swedish Krona currency pair. Will the EURSEK rise?

Such a movement means the strengthening of the euro and weakening of the Swedish krona. At the end of September last year, the Swedish Central Bank (Riksbank) raised the rate from -0.25% to 0%. After that, the exchange rate of the krona noticeably strengthened against the euro. Now, the Riksbank rate coincides with the ECB rate. Meanwhile, the EU economic indicators look a little better, which may cause an upward correction of the EURSEK. Inflation in Sweden is 1.8%, while in the Eurozone it is only 1.3%. The trade balance of Sweden has fluctuated around zero since 2014 and is often negative in monthly terms. The Eurozone trade balance is continuously positive. A number of significant macroeconomic data will be released in Sweden this and next week which may affect the Riksbank’s decision on the rate at its next meeting on February 12. The most important indicator may be inflation in Sweden for December, which will be published on January 15.

EURSEK

On the daily timeframe, the EURSEK: D1 bounced off the support line of the neutral channel and is trying to move towards its upper boundary. A number of technical analysis indicators formed buy signals. The further price increase is possible in case of negative economic indicators in Sweden.

  • The Parabolic indicator gives a bullish signal.
  • The Bollinger bands have narrowed, which indicates low volatility. Both Bollinger bands are titled upward.
  • The RSI indicator is above 50. It has formed a positive divergence.
  • The MACD indicator gives a bullish signal.

The bullish momentum may develop in case EURSEK exceeds its last high at 10.55. This level may serve as an entry point. The initial stop loss may be placed below the Parabolic signal and the three fractal lows at 10.4. After opening the pending order, we shall move the stop to the next fractal low following the Bollinger and Parabolic signals. Thus, we are changing the potential profit/loss to the breakeven point. More risk-averse traders may switch to the 4-hour chart after the trade and place there a stop loss moving it in the direction of the trade. If the price meets the stop level (10.4) without reaching the order (10.55), we recommend cancelling the position: the market sustains internal changes that were not taken into account.

Summary of technical analysis

PositionBuy
Buy stopAbove 10.55
Stop lossBelow 10.4

Market Analysis provided by IFCMarkets

Stocks rebound amid unresolved Middle East tensions

By IFCMarkets

Dollar strengthening resumes

US stock market recovered part of previous session losses on Monday amid unresolved concerns about possible Iranian retaliation after US airstrike killed top Iranian commander in Iraq. The S&P 500 advanced 0.4% to 3246.28. Dow Jones industrial added 0.2% to 28703.38 . The Nasdaq rose 0.6% to 9071.46. The dollar strengthening reversed despite Markit report US Composite PMI was revised higher to 52.7 from a preliminary of 52.2 in December of 2019. The live dollar index data show the ICE US Dollar index, a measure of the dollar’s strength against a basket of six rival currencies, lost 0.3% to 96.62 but is higher currently. Futures on stock indexes point to higher openings today.

European indexes retreated despite positive data

European stocks retreat continued on Monday despite Markit report euro-zone business activity expanded in December. Both the EUR/USD and GBP/USD reversed their declines yesterday with dynamics reversed currently for both pairs. The Stoxx Europe 600 index lost 0.5% led by travel and auto shares. The DAX 30 fell 0.7% to 13126.99. France’s CAC 40 slid 0.5% while UK’s FTSE 100 retreated 0.6% to 7575.34 despite report UK services PMI inched up to the 50 mark which separates growth from contraction.

DE30 rebounding inside channel 01/07/2020 Market Overview IFC Markets chart

Nikkei leads Asian Indexes recovery

Asian stock indices are mostly higher today. Nikkei rebounded 1.6% to 23575.72 as yen slowed its slide against the dollar. Markets in China are recovering: the Shanghai Composite Index is up 0.7% while Hong Kong’s Hang Seng Index is 0.6% higher. Australia’s All Ordinaries Index extended gains 1.4% as Australian dollar reversed its climb against the greenback.

Saudi Aramco shares fall as Brent falls

Brent futures prices are edging lower today. Prices ended higher yesterday: February Brent crude closed 0.5% higher at $68.91 a barrel on Monday. Saudi Aramco ‘s shares continue trading on the country’s Tadawul exchange. Shares fell 1.7% on Sunday, followed by 1.2% decline on Monday against the background of heightened tensions between the US and Iran. After Aramco became the first company to hit a $2 trillion valuation on December 12, its market value has fallen by $200 billion since its mid-December peak. Shares are currently at 34.35 riyals, 7.3% higher than its offering price of 32 riyals ($8.53).

Gold up despite higher Dollar

Gold prices are edging higher today. Gold prices ended at near seven month high on Monday: February gold added 1.1% on Monday.

Market Analysis provided by IFCMarkets

Note:
This overview has an informative and tutorial character and is published for free. All the data, included in the overview, are received from public sources, recognized as more or less reliable. Moreover, there is no guarantee that the indicated information is full and precise. Overviews are not updated. The whole information in each overview, including opinion, indicators, charts and anything else, is provided only for familiarization purposes and is not financial advice or а recommendation. The whole text and its any part, as well as the charts cannot be considered as an offer to make a deal with any asset. IFC Markets and its employees under any circumstances are not liable for any action taken by someone else during or after reading the overview.

Is the Oil rally built on weak foundations?

By Lukman Otunuga, Research Analyst, ForexTime – The story defining Oil’s explosive appreciation over the past two days revolves around escalating tensions in the Middle East.

WTI Crude and Brent have both gained over 4% since last Friday as the US-Iran faceoff sparked fears over negative supply shocks in the markets. Given how the Middle East is home to major oil-producing countries that supply roughly 25% of the world’s oil, the path of least resistance for Oil points north.

However, geopolitical tensions may not be enough to sustain oil prices in the medium to longer term. The upside is poised to face multiple obstacles in the form of rising US Shale production and weak oil demand growth in the face of renewed US-China trade tensions. Although geopolitical shocks could offer a short-term boost, developments revolving around US-China trade and global growth remain primary driver’s influencing Oil’s outlook.

In regards to the technical picture, WTI Crude is heavily bullish on the daily charts. A daily close above $63 could encourage a close above $63.80 and $64.50. If $63 proves to be an unreliable support level, WTI Crude could decline back towards $62 and $61.40.

Pound rams into 1.3150

The Pound rebounded from its new year hangover, appreciating against every G10 currency amid expectations over the Bank of England leaving interest rates unchanged.

A softer dollar contributed to the Pound’s upside, with the GBPUSD punching above 1.3150 on Monday. Although the Sterling could push higher in the near term, longer-term gains are likely to be capped by fears of a hard Brexit. Technical traders will continue to closely observe how prices react around 1.3150. Sustained weakness below this level should open a path back towards 1.3060 and 1.3000, respectively.

Time for the Yen to claim the throne?

The Yen has depreciated against almost every G10 currency despite geopolitical tensions fueling risk aversion across the board.

Regardless, appetite for the Yen could improve this week if geopolitical risks and trade uncertainty feeds into the risk-off sentiment. Focusing on the technical picture, the USDJPY is under pressure on the daily charts. A solid breakdown below 108.00 should open a path towards 107.50 in the near term.

Commodity spotlight – Gold

Gold appreciated over 3.5% on Monday, smashing through the 2019 high of $1557.11 and hitting levels not seen since 2013 above $1578 thanks to tensions in the Middle East.

The US-Iran faceoff is a geopolitical risk that presents unwelcome levels of uncertainty to the financial markets, with investors rushing to the safety of havens. Although prices are heavily bullish, there could be a retracement back towards $1555 before bulls re-enter the scene. The precious metal should trend higher as long as $1555 proves to be a reliable support.

Disclaimer: The content in this article comprises personal opinions and should not be construed as containing personal and/or other investment advice and/or an offer of and/or solicitation for any transactions in financial instruments and/or a guarantee and/or prediction of future performance. ForexTime (FXTM), its affiliates, agents, directors, officers or employees do not guarantee the accuracy, validity, timeliness or completeness, of any information or data made available and assume no liability as to any loss arising from any investment based on the same.


Forex-Time-LogoArticle by ForexTime

ForexTime Ltd (FXTM) is an award winning international online forex broker regulated by CySEC 185/12 www.forextime.com

Bullion Banks Used Paper Gold and Silver to Restrain Price Advance in 2019

By Money Metals News Service

Gold and silver investors buy metals because they are scarce. Precious metals are by nature difficult to find, and hard to produce. Consequently, above ground stocks are limited and valuable, particularly when priced in unlimited fiat currencies.

The bankers and government officials behind these fiat currency systems don’t like stable monetary benchmarks such as gold putting their inflation schemes on full display. They absolutely hate that gold works as a refuge.

Inflation is a stealth tax. Instead of overtly raising taxes, politicians simply borrow and print the money needed for more government. They just need people not to notice.

Which brings us to the futures markets for gold and silver. They are the solution to the difficult scarcity problem that metals pose for bankers and bureaucrats. The futures markets are the primary tool for managing prices and discouraging people from turning to metals as a hedge against inflation.

Craig Hemke of the TF Metals Report published a recap of futures market activity in 2019. It perfectly captures how their tool works. They replaced real markets for actual gold and silver with a market for paper gold and silver proxies. Then they severed all connection between the proxies and physical metal.

Hemke writes with regard to gold:

For the year, Comex Digital Gold was up 18.75% from $1,280 to $1,520. An 18.75% gain is certainly impressive, and we’ll take every basis point. However, it’s even more impressive when you pause to consider that the total amount of Comex contracts was increased by 74.2% from 451,460 to 786,166. That’s an increase of 33,480,600 digital, pretend ounces all while the total amount of vaulted gold in the Comex depositories was barely changed.

And for silver:

For the year, Comex Digital Gold was up 18.75% from $1,280 to $1,520. An 18.75% gain is certainly impressive, and we’ll take every basis point. However, it’s even more impressive when you pause to consider that the total amount of Comex contracts was increased by 74.2% from 451,460 to 786,166. That’s an increase of 33,480,600 digital, pretend ounces all while the total amount of vaulted gold in the Comex depositories was barely changed.

The bullion banks are selling a lot of paper gold and silver.

Imagine the gold price if demand for more than 33 million ounces were actually directed into the physical bullion markets, where supply is scarce and limited, rather than the futures markets where banks supply contracts for all the buyers who show up.

And barely an ounce of actual metal has to be found, mined, refined and moved into bullion bank vaults.

This mechanism works beautifully for those who prefer to keep a lid on prices. Precious metals and the topic of honest money get almost zero attention.

Almost no one is talking about the trillion-dollar federal deficits. In 2019, the Federal Reserve returned to monetizing hundreds of billions in federal debt. Most people now assume that is normal.

Perhaps most important for the central planners trying to maintain the fiat dollar, there is very little discussion about why gold and silver prices are rising.

Bankers and bureaucrats are trying to herd people into the Federal Reserve Note and other preferred asset classes, including bonds. They don’t want people buying, or even talking about inflation and financial turmoil hedges like precious metals.

These people are not good shepherds, and they don’t have the public’s best interest at heart. As such, it is probably not a good idea to follow the herd.


The Money Metals News Service provides market news and crisp commentary for investors following the precious metals markets.

Gold vs S&P 500 Index Analysis: Political risks in Middle East may cause increase in gold prices

By IFCMarkets

Political risks in the Middle East may cause an increase in gold prices

In this review, we suggest considering the personal composite gold instrument – Gold vs S&P 500 Index. Will the XAUSnP rise? Such a movement is observed when gold prices rise, and the S&P 500 decreases.

Gold is a safe-haven asset. Its prices rise in case of an increase in political risks. Gold prices rose on Friday due to reports of the death of Iranian General Qassem Soleimani in Iraq after the use of an American rocket. Investors fear increasing tensions in the Middle East. The US stock index S&P 500 decreased. In addition to problems in the Middle East, this was contributed by an unexpected decrease in the ISM Manufacturing economic indicator in December.

XAUSnP

On the daily timeframe, the XAUSnP: D1 is correcting up from the lower boundary of the long-term uptrend. It is the lower boundary of a large triangle. A number of technical analysis indicators formed buy signals. The further price increase is possible in case of the aggravation of the situation in the Middle East.

  • The Parabolic indicator gives a bullish signal.
  • The Bollinger bands have widened, which indicates high volatility. The upper Bollinger band is titled upward.
  • The RSI indicator is above 50. It has formed a positive divergence.
  • The MACD indicator gives a bullish signal.

The bullish momentum may develop in case XAUSnP exceeds the превысит 200-day moving average line at 0.484. This level may serve as an entry point. The initial stop loss may be placed below the boundary of the triangle, the fractal low, the lower Bollinger band and the Parabolic signal at 0.456. After opening the pending order, we shall move the stop to the next fractal low following the Bollinger and Parabolic signals. Thus, we are changing the potential profit/loss to the breakeven point. More risk-averse traders may switch to the 4-hour chart after the trade and place there a stop loss moving it in the direction of the trade. If the price meets the stop level (0.456) without reaching the order (0.484), we recommend cancelling the position: the market sustains internal changes that were not taken into account.

Summary of technical analysis

PositionBuy
Buy stopAbove 0.484
Stop lossBelow 0.456

Market Analysis provided by IFCMarkets