Crude prices have moved sharply lower into the back end of the week following the latest report from the Energy Information Administration.
Despite the API reporting a large build in US crude stores, the EIA showed that in the week ending January 3rd, US crude stores were higher by 1.2 million barrels over the week. This takes the total inventory level back up to 431.1 million barrels. The reading was in stark contrast to the expected 3.6 million barrel decrease the market was looking for.
Despite the increase in total inventories, crude stores at the Cushing delivery hub in Oklahoma, the largest site in the US, were lower by over 800k barrels on the week.
Refinery crude runs were also lower over the week by 368k barrels. This marked a 1.5% fall in refinery utilization rates.
Gasoline & Distillate Inventories Higher
Elsewhere, the report showed that US gasoline inventories were also higher last week. They rose by 9.1 million barrels, taking the total inventory level to 251.6 million barrels. This was far higher than the 2.7 million barrel increase the market was looking for.
The report also showed that distillate stockpiles were higher over the week. Distillate inventories, which include diesel and heating oil, were higher by 5.3 million barrels. The result took the total inventory level in distillates up to 139 million barrels. This again was far higher than the 3.9 million barrel increase projected by analysts.
Finally, the report showed that net US crude imports were higher by 1.78 million barrels over the week.
US/Iran Tensions Impacting Crude
Its been a volatile week for crude prices given the initial upside surge seen in response to news of an escalation in tensions between the US and Iran.
Following the US killing of a top Iranian general last week, Iran finally retaliated overnight on Wednesday with missile attacks on two US army bases in Iraq.
The attack fuelled a sudden wave of risk aversion across markets that saw equities cratering lower while safe havens rallied.
Crude was higher too, initially. However, it has since reversed sharply lower from highs above 64. As yet, no US retaliation has been enacted. But, the market is waiting to see how America will respond.
Any further action could see crude prices sharply higher once again.
Technical Perspective
The reversal lower in crude has taken price back under the 63.13 level. Price is quickly approaching the broken bearish trend line where we also have structural support at the 60 level. While above here, further upside remains likely. Back under here, however, will put focus on a move to deeper support at the 57 level.
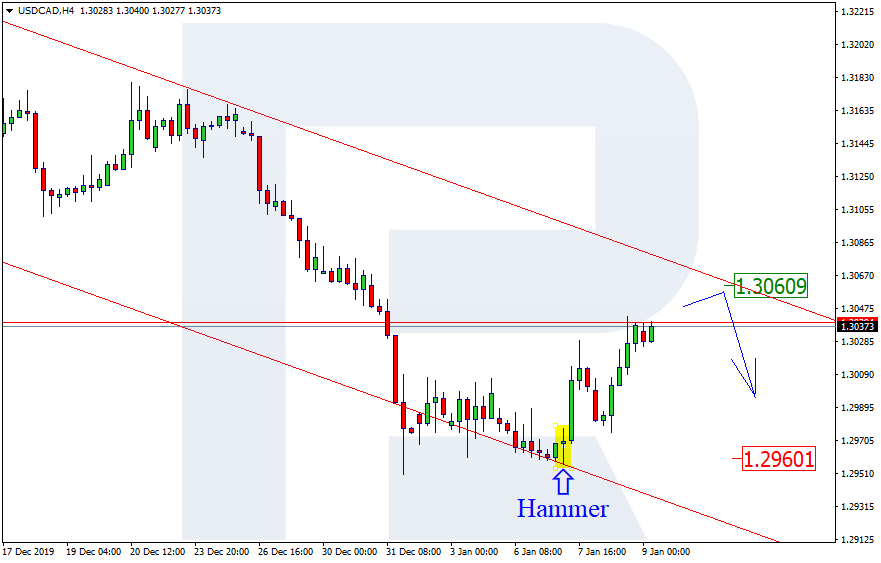
As we can see in the H4 chart, the descending tendency continues. By now, the pair has finished several reversal patterns, including Hammer, near the channel’s downside border. The current situation implies that USDCAD may form a slight ascending correction to reach 1.3060 and then resume falling. However, we shouldn’t ignore an alternative scenario, according to which the instrument may return to 1.3141 without testing the channel’s upside border.
Attention! Forecasts presented in this section only reflect the author’s private opinion and should not be considered as guidance for trading. RoboForex LP bears no responsibility for trading results based on trading recommendations described in these analytical reviews.
The US Dollar has continued its rally over the European morning on Thursday with the USD index trading up to 97.05. Yesterday, the ADP employment reading came in well above expectations at 202k vs 160k expected, fuelling expectations for a strong reading in Friday’s employment report.
EUR Lower on USD Strength
EURUSD has been lower over the session so far in light of the rally in USD. Weakness in Eurozone data readings across the week has weighed on the single currency. Traders now ait on the release of the December ECB meeting minutes due later today. Should the minutes reveal any support for further easing among ECB policymakers, EUR is likely to trade much lower.
GBP Down
GBPUSD trades lower over the day with the rally in USD weighing on the G10 bloc. MPs continue to debate the PM’s Brexit bill in the Commons with a vote due later today. The bill is expected to be passed, given the strong Conservative majority, which should keep GBP supported in the near term. GBPUSD trades 1.3080 last, having broken down to fresh lows.
Risk Rallies
Risk assets have been better supported over the last 24 hours. Following an initial downside reaction in response to news of an Iranian missile strike on a US army base in Iraq, risk sentiment has rallied. Trump’s response to the attack has defused expectations of any US response, leading risk assets higher. The SPX500 trades 3269.18 last.
JPY & Gold Lower
Safe havens have been lower over the European session on Thursday. Both JPY and gold have traded lower against USD given the recovery in risk markets. USDJPY trades 109.37 last, turning back up towards recent highs. XAUUSD is still sitting at the bottom of recent lows at 1547.70 last.
Crude Falls Back
Oil prices have traded lower in the early European session on Thursday. Following a brief move above the 63.13 level, crude is now trading 59.83 last, Yesterday, the EIA reported an unexpected drawdown in US crude stores. The scaling back of US rhetoric towards Iran has also weighed on crude as traders perceive a reduced likelihood of full-scale conflict between the two countries.
Lift-Off For Loonie
USDCAD has been firmly higher over the European session on Thursday with price breaking above the 1.3035 level to trade 1.3052. The decline in crude prices over the last 24 hours has weighed on CAD. Unemployment data tomorrow could help stem the decline if the indicator is seen positively.
Aussie Lower
AUDUSD has been back under pressure today with price turning back down to recent lows, trading .6857 last. The market is expecting an RBA rate cut at the bank’s next meeting in February as a response to the wildfires which have decimated parts of Australia. AUDUSD trades .6858 last.
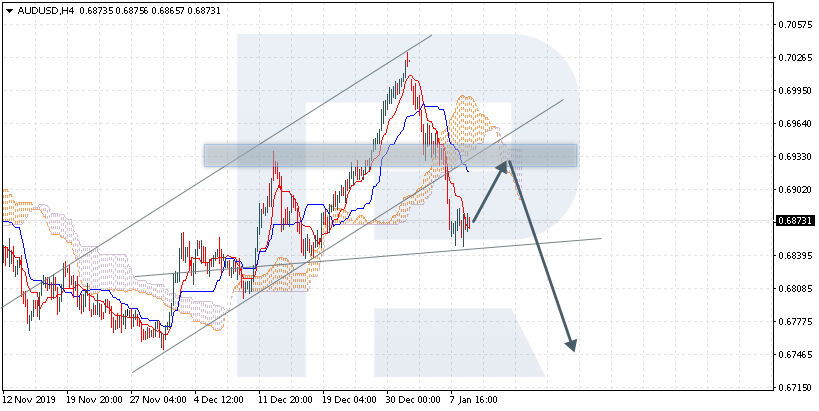
AUDUSD is trading at 0.6873; the instrument is moving below Ichimoku Cloud, thus indicating a descending tendency. The markets could indicate that the price may test the cloud’s downside border at 0.6930 and then resume moving downwards to reach 0.6745. Another signal to confirm further descending movement is the price’s rebounding from the resistance level. However, the scenario that implies further decline may be canceled if the price breaks the cloud’s upside border and fixes above 0.6980. In this case, the pair may continue growing towards 0.7065. After breaking the support area and fixing below 0.6825, the price may continue moving downwards and complete Head & Shoulders reversal pattern.
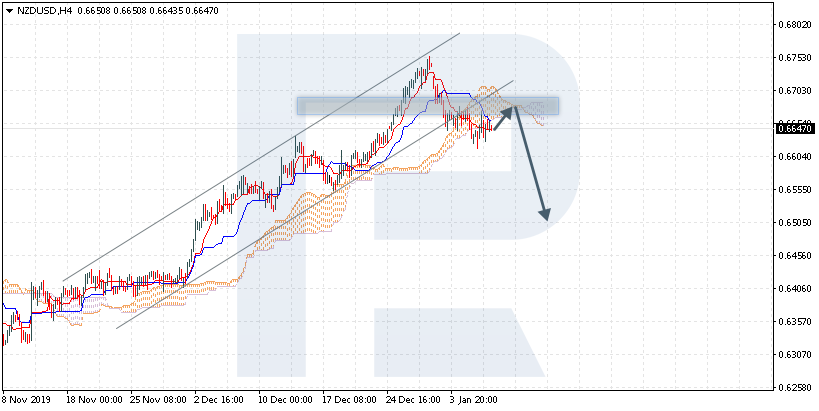
NZDUSD, “New Zealand Dollar vs US Dollar”
NZDUSD is trading at 0.6647; the instrument is moving below Ichimoku Cloud, thus indicating a descending tendency. The markets could indicate that the price may test the cloud’s downside border at 0.6655 and then resume moving downwards to reach 0.6505. Another signal to confirm further descending movement is the price’s rebounding from the rising channel’s downside border. However, the scenario that implies further decline may be canceled if the price breaks the cloud’s upside border and fixes above 0.6735. In this case, the pair may continue growing towards 0.6855.
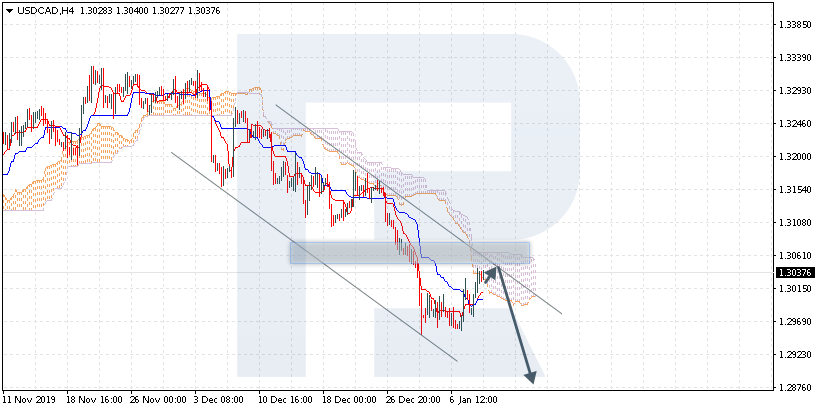
USDCAD, “US Dollar vs Canadian Dollar”
USDCAD is trading at 1.3037; the instrument is moving below Ichimoku Cloud, thus indicating a descending tendency. The markets could indicate that the price may test the cloud’s upside border at 1.3045 and then resume moving downwards to reach 1.2875. Another signal to confirm further descending movement is the price’s rebounding from the resistance level. However, the scenario that implies further decline may be canceled if the price breaks the cloud’s upside border and fixes above 1.3085. In this case, the pair may continue growing towards 1.3175.
Attention! Forecasts presented in this section only reflect the author’s private opinion and should not be considered as guidance for trading. RoboForex LP bears no responsibility for trading results based on trading recommendations described in these analytical reviews.
The US dollar strengthened against a basket of major currencies. The dollar index (#DX) closed yesterday in the green zone (+0.30%). The conflict between the US and Iran is still in the focus of attention. The day before, US President Donald Trump responded to Iranian attacks on US forces in Iraq with sanctions, not military measures. At the same time, he noted that the Americans had not suffered as a result of missile strikes by Iran.
Optimistic economic data from the United States supported the US currency. Thus, ADP nonfarm employment change increased to 202K in December, while experts expected 160K.
The “black gold” prices have fallen. Currently, futures for the WTI crude oil are testing the $59.65 mark per barrel.
Market Indicators
Yesterday, there was the bullish sentiment in the US stock market: #SPY (+0.53%), #DIA (+0.58%), #QQQ (+0.75%).
The 10-year US government bonds yield has been growing. At the moment, the indicator is at the level of 1.87-1.88%.
The Economic News Feed for 09.01.2020:
– Initial jobless claims in the US at 15:30 (GMT+2:00).
We also recommend paying attention to the speech by the Bank of Canada Governor Poloz.
US stock market rebounded on Wednesday as geopolitical tensions eased after President Trump’s measured statement downplaying the results of Iran’s missile attack of two US bases in Iraq. Trump said ‘minimal’ damage was done to US military facilities in Iraq and no US casualties were sustained. The S&P 500 added 0.5% to 3253.05. The Dow Jones industrial average gained 0.6% to 28745.09. Nasdaq rose 0.73% to fresh record 9129.24. The dollar strengthening continued as the Automatic Data Processing Inc. reported US private sector added above expected 202,000 new jobs in December. The live dollar index data show the ICE US Dollar index, a measure of the dollar’s strength against a basket of six rival currencies, rose 0.3% to 97.29 and is higher currently.Futures in stock indexes point to higher openings today.
FTSE 100 led European indexes recovery
European stocks ended higher on Wednesday paring earlier losses. Both GBP/USD and EUR/USD continued sliding with both pairs lower currently. The Stoxx Europe 600 ended up 0.1% led by travel and leisure stocks, supported also by Ifo and KOF institutes reports the euro zone economy growth will be bigger in the fourth quarter of 2019 compared to the previous quarter. Germany’s DAX 30 gained 0.7% to 13320.18 despite a report showing German factory orders fell unexpectedly in November. France’s CAC 40 added 0.3% and UK’s FTSE 100 rose 1.1% to 7574.93.
Nikkei led Asian Indexes gains
Asian stock indices are solidly higher today with easing of tensions around Middle East. Nikkei jumped 2.3% to 23739.87 as yen slide against the dollar continued. Chinese stocks are higher after reports vice premier Liu He will go to Washington to sign the phase one trade deal: the Shanghai Composite Index is up 0.9% and Hong Kong’s Hang Seng Index is 1.7% higher. Australia’s All Ordinaries Index added 0.8% with Australian dollar slide against the greenback intact.
Brent futures prices are extending losses today. Prices plunged on Wednesday as it became evident the Middle East tensions were winding down after President Trump’s speech: March Brent lost 4.2% to $65.44 on Wednesday. And Energy Information Administration reported US crude oil inventories rose by 1.2 million barrels last week. Shares of Saudi Aramco are still above the IPO price of 32 riyals that valued the company at $1.7 trillion. Shares opened at 34 riyals ($9.06) on Wednesday, the lowest since the company first traded publicly on December 11, following Iran’s missile attack on US targets in Iraq. At 34.15 riyals per share price on Wednesday the value of the company was at $1.82 trillion, down from a peak of $2.06 trillion on December 12.
Gold weakening dynamic while Dollar strengthens holds
Gold prices are edging lower after Wednesday’s loss. The price of an ounce of gold for February delivery fell 0.9% to $1,560.20 Wednesday as the dollar strengthening continued.
Note: This overview has an informative and tutorial character and is published for free. All the data, included in the overview, are received from public sources, recognized as more or less reliable. Moreover, there is no guarantee that the indicated information is full and precise. Overviews are not updated. The whole information in each overview, including opinion, indicators, charts and anything else, is provided only for familiarization purposes and is not financial advice or а recommendation. The whole text and its any part, as well as the charts cannot be considered as an offer to make a deal with any asset. IFC Markets and its employees under any circumstances are not liable for any action taken by someone else during or after reading the overview.
By Hussein Sayed, Chief Market Strategist (Gulf & MENA), ForexTime
Safe havens give back gains on reduced geopolitical tensions
Oil erases risk premium, falling 9% from its Wednesday high
Friday’s US jobs report will be under trader spotlights
In less than 24 hours, investors have performed an about-turn from their initial defensive positioning to risk taking and markets rallying. On late Tuesday, Oil prices surged above $71, Gold topped $1,600, safe haven currencies rallied and US 10-year Treasury Bond yields fell to their lowest levels since early November. All these moves were a reaction to the Iranian missile attack on US military sites in Iraq. By the time European markets opened on Wednesday, most of the panic was over and losses in stocks were reversed after President Trump addressed the nation, sending clear signs of de-escalation by downplaying the missile attack.
The US and Iran now seem to have both stepped back from direct confrontation. The nightmare scenario of a full-blown war looks to be over and investors can finally breathe a sigh of relief. Yet even if a conflict has been averted, the road ahead remains bumpy and investors should remain on standby for further possible retaliatory measures. However, fundamentals are quickly returning to the fore after being dominated by geopolitical factors this week.
Oil prices have now plunged 9% from their Wednesday highs, testing their lowest levels since December 16. Most of the geopolitical risk premium has been erased by yesterday’s move and we may still see further downward pressure if inventories build up in the weeks to come. While prices have returned close to their fair value, traders will need to closely monitor the situation in Iraq and whether any activity by proxy militias will lead to supply disruption. Otherwise, prices are likely to remain capped at $70 in the near term.
After the safe haven Yen and Swiss Franc retreated on Wednesday, most major currencies were trading in tight ranges early Thursday. Trader’s focus will shift to Friday’s US non-farm payrolls report for the month of December, after November’s surprisingly strong release showed a gain of 266,000 jobs. While it’s difficult to see a repeat of November’s positive surprise, a headline reading of more than 200,000 will give the Dollar a boost. More important than the headline figure will be wage growth and the average hourly earnings readings. Given that the US unemployment rate stands at 50-year lows, are we finally going to see upward pressure on salaries? That’s likely to be a key figure to watch, not just for December’s release, but for the year ahead.
Disclaimer: The content in this article comprises personal opinions and should not be construed as containing personal and/or other investment advice and/or an offer of and/or solicitation for any transactions in financial instruments and/or a guarantee and/or prediction of future performance. ForexTime (FXTM), its affiliates, agents, directors, officers or employees do not guarantee the accuracy, validity, timeliness or completeness, of any information or data made available and assume no liability as to any loss arising from any investment based on the same.
Shares of Apellis Pharmaceuticals opened 35% higher and established a new 52-week intraday high price today after the company announced positive top-line results from its Phase 3 head-to-head study of Pegcetacoplan (APL-2) versus Eculizumab in patients with Paroxysmal Nocturnal Hemoglobinuria.
Apellis Pharmaceuticals Inc. (APLS:NASDAQ) today announced that it had achieved positive results in the company’s Phase 3 PEGASUS study, which is evaluating pegcetacoplan (APL-2) in adults with paroxysmal nocturnal hemoglobinuria (PNH).
The firm advised in the report that the top-line data show that pegcetacoplan met the study’s primary efficacy endpoint and demonstrated superiority compared to patients who were treated with eculizumab. The company noted that pegcetacoplan also showed promising results in key secondary endpoints specifically meeting non-inferiority on transfusion avoidance and absolute reticulocyte count.
The company’s Chief Medical Officer Federico Grossi, M.D., Ph.D., commented, “Pegcetacoplan is the first and only investigational therapy to demonstrate superiority compared to eculizumab on hemoglobin levels. We are also excited to see that 85% of patients treated with pegcetacoplan were transfusion free…At Apellis, we are focused on developing groundbreaking therapies, and these results show that pegcetacoplan has the potential to transform the lives of people with PNH. We look forward to meeting with regulators in the first half of the year to discuss next steps.”
Peter Hillmen, M.B., Ch.B., Ph.D., professor of experimental hematology at the University of Leeds and an investigator in the PEGASUS study, added, “The majority of patients with PNH currently receiving treatment with eculizumab have continuing anemia…The PEGASUS results show that pegcetacoplanhas the potential to become a new standard of care for patients with PNH.”
In regards to the PEGASUS study, Apellis Pharma’s Co-Founder and CEO Cedric Francois, M.D., Ph.D., remarked, “Going into the study, our most optimistic expectation was to see a 2 g/dL or more change in hemoglobin and a trend on the key secondary endpoints. Needless to say, we are thrilled with these results…These data give us strong confidence in the further development of pegcetacoplan as a targeted C3 inhibitor in geographic atrophy and other serious complement-driven diseases.”
The firm explained in the report that “PNH is a rare, chronic, life-threatening blood disorder associated with abnormally low hemoglobin levels due to the destruction of oxygen-carrying red blood cells (hemolysis) and that persistently low hemoglobin can result in frequent transfusions and debilitating symptoms such as severe fatigue and difficulty breathing (dyspnea).”
The company identifies pegcetacoplan (APL-2) as “an investigational, targeted C3 inhibitor designed to regulate excessive complement activation, which can lead to the onset and progression of many serious diseases.” In addition to the study for use in PNH, the firm stated that it is also studying pegcetacoplan in several other clinical studies in geographic atrophy (GA), and C3 glomerulopathy and indicated that the FDA has granted Fast Track designation for pegcetacoplan in the treatment of both PNH and GA.
Apellis Pharmaceuticals is headquartered in Waltham, Mass., and is a global biopharmaceutical company that is engaged in pioneering targeted C3 therapies. The firm focuses in the areas of hematology, ophthalmology and nephrology.
Apellis Pharmaceuticals has a market capitalization of around $1.9 billion with approximately 63.89 million shares outstanding and a short interest of about 8.3%. APLS shares opened 35% higher today at $40.89 (+$10.70, +35.49%) over yesterday’s $30.19 closing price and reached a new 52-week high price this morning of $42.48. The stock has traded today between $34.61 and $42.48/share and is currently trading at $37.50 (+$7.31, +24.21%).
Disclosure: 1) Stephen Hytha compiled this article for Streetwise Reports LLC and provides services to Streetwise Reports as an independent contractor. He or members of his household own securities of the following companies mentioned in the article: None. He or members of his household are paid by the following companies mentioned in this article: None. 2) The following companies mentioned in this article are billboard sponsors of Streetwise Reports: None. Click here for important disclosures about sponsor fees. 3) Comments and opinions expressed are those of the specific experts and not of Streetwise Reports or its officers. The information provided above is for informational purposes only and is not a recommendation to buy or sell any security. 4) The article does not constitute investment advice. Each reader is encouraged to consult with his or her individual financial professional and any action a reader takes as a result of information presented here is his or her own responsibility. By opening this page, each reader accepts and agrees to Streetwise Reports’ terms of use and full legal disclaimer. This article is not a solicitation for investment. Streetwise Reports does not render general or specific investment advice and the information on Streetwise Reports should not be considered a recommendation to buy or sell any security. Streetwise Reports does not endorse or recommend the business, products, services or securities of any company mentioned on Streetwise Reports. 5) From time to time, Streetwise Reports LLC and its directors, officers, employees or members of their families, as well as persons interviewed for articles and interviews on the site, may have a long or short position in securities mentioned. Directors, officers, employees or members of their immediate families are prohibited from making purchases and/or sales of those securities in the open market or otherwise from the time of the interview or the decision to write an article until three business days after the publication of the interview or article. The foregoing prohibition does not apply to articles that in substance only restate previously published company releases. 6) This article does not constitute medical advice. Officers, employees and contributors to Streetwise Reports are not licensed medical professionals. Readers should always contact their healthcare professionals for medical advice.
Fund manager Adrian Day reviews recent developments with precious metals producers in his portfolio.
Newmont Goldcorp Corp. (NEM:NYSE, $42.83) is in our portfolio because Newmont acquired Goldcorp. Over the past eight months, it has been active with major sales, including 50% of Kalgoorlie in AustraliaBarrick also sold the other 50% just a little beforeand Red Lake (which came with Goldcorp), both sold to Australia companies. It has also sold its stake in Continental Gold. Together, the dispositions have raised $1.48 billion ($800 million from Kalgoorlie), reaching the upper end of its targeted sales.
However, we believe it is likely that Newmont will make several more smaller dispositions, mostly assets acquired in the Goldcorp purchase that don’t fit the company’s hurdle rate or profile.
These sales have dramatically improved the balance sheet, now with $4.4 billion of cash, net debt down to $2.8 billion. Newmont has also initiated a $1 billion share repurchase program.
Costs, though low, are increasing
In its recent “Outlook 2020 and Beyond,” Newmont guided for reduced production (largely because of the sale of producing assets), and with it a reduction in sustaining capital requirements. Costs are estimated to increase, however, though at cash costs of $750/ounce and “All-In Sustaining Costs” of $975, they remain low.
So, an improved balance sheet and low costs, as well as strong political-risk profile, are all positive for Newmont. The modest growth profile as well as the slow integration with Goldcorp (including alleged cost savings) offset that, at least in the near term. The valuation is high, given the lack of growth. But in a strong gold market, Newmont will be a beneficiary, both from index buying and retail investment as a well-known name. We are holding.
Turnaround underway at Yamana
Yamana Gold Inc. (YRI:TSX; AUY:NYSE; YAU:LSE, NY, $3.83) appears to be slowing turning around, though it has seemed that way before. The balance sheet has improved after last year’s sales, with a current $100 million in cash. Debt remains high, however, with debt-to-equity of 44% and a “quick ratio” of just 0.2x. It’s not a great balance sheet, but the company appears to be out of the danger zone.
There are also several opportunities for growth in the year ahead and beyond. Cerro Moro, the major deposit in Argentina, continues to expand, now with drilling on new zones. Jacobina and Malartic both have major expansions underway. And drilling at El Penon suggests that profitable mine can be expanded.
With its current valuations reasonableprice-to-cash flow of 8.5x and less than book (though price-to-free cash flow is less satisfactory 36x)we are holding for now.
The major news, of course, is in Argentina, where its large Lindero gold mine is nearing completion. The company failed to meet its goal of putting ore on the pad in 2019, but that will occur any time now, with ore processing in mid-January. Under new regulations, mining companies have to convert their dollars to pesos and hold them a year before exporting dollars, and the potential for further declines in the peso could significantly affect earnings. Fortuna is looking at its options, though hedging is too expensive.
Fortuna has cash of $72 million. A successful start to operations will see the stock advance nicely, though it may take a couple of quarters for the market to be convinced. Developments in Argentina, outside the company’s control, could hurt (or help) the stock. It has already advanced from the below $3 in November to over $4 as the mine gets closer to completion. With that, the short interest in the stock fell, though it remains high, so a successful ramp-up and the stock rally could be leveraged. The stock remains undervalued against other silver stocks. We are holding for now, but ready to buy on any set back.
Osisko plans caught market offguard
Osisko Gold Royalties Ltd. (OR:TSX; OR:NYSE, NY, $9.64) is not a producer, of course, but we are including it in this report since it is exposed to production, development and exploration at its “incubator” companies more than pure royalty companies. It is a hybrid royalty, and trades deservedly at a lower valuation because of the higher risk. It was severely punished recently for going too far, and buying an entire exploration company, Barkerville, as we discussed recently. It also announced a new initiative, Northern Spirit, a “project development program the next step in the evolution of our accelerator business.” The lack of details also hurt the stock. Osisko also had another black eye; following the bankruptcy of Stornaway, now Lydian, on whose project in Armenia it holds a stream, has sought protection from creditors. The impression, fair or not, is of a company a little too aggressive in spending its money. However, we think the stock is oversold; Osisko will not be building Barkerville’s mine itself, and we hope there will be more details on Northern Spirit and Osisko’s role in it soon. Meanwhile, two of its major units, Osisko Mining and OIII, are continuing to advance their projects, the former more advanced than the latter.
More clarity on its plans, as well as a major success at one of its main investments, will certainly help the stock recover. Selling at 20x free cash flow, and 12x book, Osisko stock is significantly undervalued relative to the pure royalty peers. It is in the midst of a major stock repurchase program, which has been the stock recovery from its post-Bakerville low under $8.50, and has another 13 million plus shares to go. Osisko is a buy at the current level.
In our next report, we will briefly review some of the non-resource companies on our list.
Adrian Day, London-born and a graduate of the London School of Economics, heads the money management firm Adrian Day Asset Management, where he manages discretionary accounts in both global and resource areas. Day is also sub-adviser to the EuroPacific Gold Fund (EPGFX). His latest book is “Investing in Resources: How to Profit from the Outsized Potential and Avoid the Risks.”
Disclosure: 1) Adrian Day: I, or members of my immediate household or family, own shares of the following companies mentioned in this article: Evrim Resources, Midland Exploration and Lara Exploration. I personally am, or members of my immediate household or family are, paid by the following companies mentioned in this article: None. My company has a financial relationship with the following companies mentioned in this article: None. Funds controlled by Adrian Day Asset Management hold shares of the following companies mentioned in this article: Newmont Goldcorp, Yamana Gold, Fortuna Silver, Osisko Gold Royalties, Midland Exploration, Kingsmen Creatives, Lara Exploration, Evrim Resources and Ares Capital. I determined which companies would be included in this article based on my research and understanding of the sector. 2) The following companies mentioned in this article are billboard sponsors of Streetwise Reports: None. Click here for important disclosures about sponsor fees. The information provided above is for informational purposes only and is not a recommendation to buy or sell any security. 3) Statements and opinions expressed are the opinions of the author and not of Streetwise Reports or its officers. The author is wholly responsible for the validity of the statements. The author was not paid by Streetwise Reports for this article. Streetwise Reports was not paid by the author to publish or syndicate this article. Streetwise Reports requires contributing authors to disclose any shareholdings in, or economic relationships with, companies that they write about. Streetwise Reports relies upon the authors to accurately provide this information and Streetwise Reports has no means of verifying its accuracy. 4) This article does not constitute investment advice. Each reader is encouraged to consult with his or her individual financial professional and any action a reader takes as a result of information presented here is his or her own responsibility. By opening this page, each reader accepts and agrees to Streetwise Reports’ terms of use and full legal disclaimer. This article is not a solicitation for investment. Streetwise Reports does not render general or specific investment advice and the information on Streetwise Reports should not be considered a recommendation to buy or sell any security. Streetwise Reports does not endorse or recommend the business, products, services or securities of any company mentioned on Streetwise Reports. 5) From time to time, Streetwise Reports and its directors, officers, employees or members of their families, as well as persons interviewed for articles and interviews on the site, may have a long or short position in securities mentioned. Directors, officers, employees or members of their immediate families are prohibited from making purchases and/or sales of those securities in the open market or otherwise from the time of the interview or the decision to write an article until three business days after the publication of the interview or article. The foregoing prohibition does not apply to articles that in substance only restate previously published company releases. As of the date of this article, officers and/or employees of Streetwise Reports LLC (including members of their household) own securities of Newmont Goldcorp, Osisko Gold, Evrim Resources, Midland Exploration and Lara Exploration, companies mentioned in this article.
Peter Epstein of Epstein Research profiles this explorer and explains why he believes it could be a take-out target.
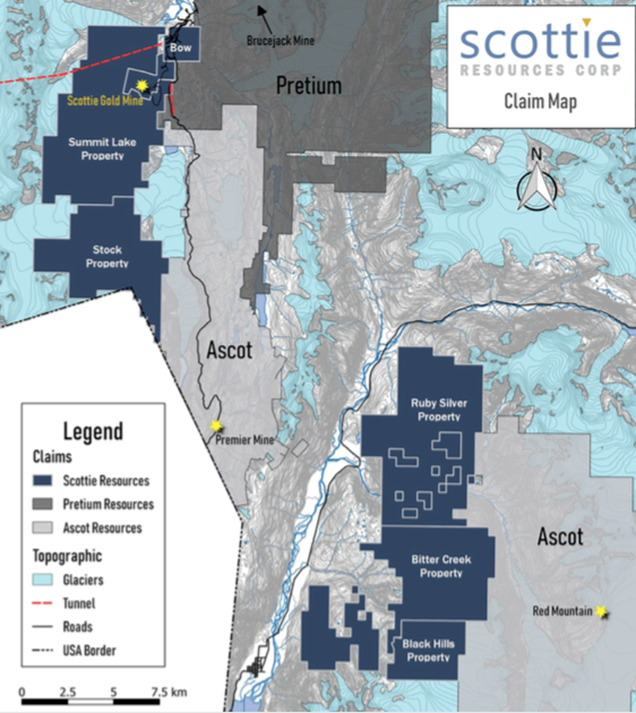
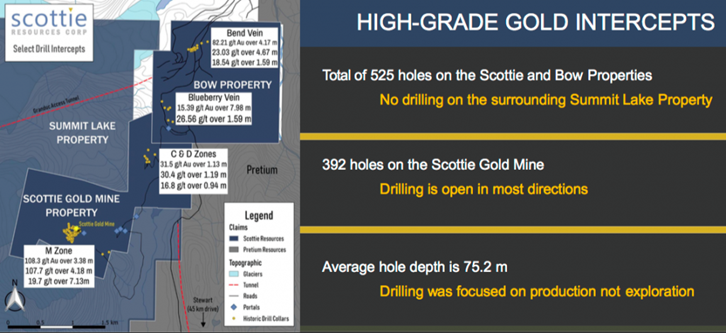
Strong drill results have confirmed and expanded the Bend Vein target on Scottie Resources Corp.’s (SCOT:TSX.V) 100%-controlled Bow property. During September, the company completed 878 meters of diamond drilling, 2 km NE of the 100%-owned past-producing Scottie Gold Mine located in the Golden Triangle (GT) of northwest British Columbia, Canada.
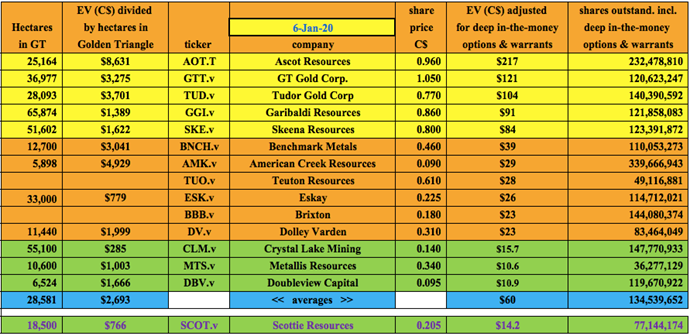
Readers are reminded that Scottie Resources owns or controls 18,500 hectares, all in the GT, across seven properties, contained in two groups of contiguous parcels. Some properties border Ascot Resources (between Ascot’s Premier Mine and Red Mountain projects), others border Pretium Resources’ property south of the world-class, high-grade, operating Brucejack mine. Pretium’s enterprise value (EV) is $3.3 billion.
Very high-grade gold at Bow, Scottie Gold & Summit Lake properties
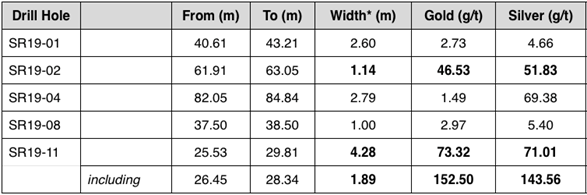
Drill hole SR19-11 hit an interval of 73.3 g/t gold (Au) and 71.0 g/t silver (Ag) (or 74+ g/t Au Eq) over 4.3 m, (true width 80%90%). That blockbuster interval included 1.9 m of 152.5 g/t Au plus 143.6 g/t Ag, equal to 154+ g/t Au Eq. Additional drill results are expected as soon as this week. Importantly, all of the reported intervals to date are near-surface, between 25 and 85 meters in depth. The best intercept in this latest batch is between 25.5 and 30 meters.
According to Scottie’s CEO & president Bradley Rourke,
“These new assays confirm the superb results of previous studies and demonstrate a truly under-explored high-grade gold and silver target. Past drilling on the Bend Vein only probed to a vertical depth of ~55 m. Our drilling this season proves that the mineralized structure extends deeper. We substantially increased the strike length of known mineralization. Drilling in the 2020 season will allow us to further prove the scale of this structurally-controlled, high-grade vein deposit.”
Scottie’s technical team integrated historical and recent (20182019) exploration work into new structural models to better understand the geometry of mineralization. Prior to the company’s 2019 drill program, Bow’s Bend Vein had only 1,525 meters of drilling on it. No exploration-style drilling had been done to test along the Bend fault structure to assess the potential of a bigger system.
Management is thrilled that drilling in 2019 substantiated the very high grades contained in the historically known ore block, and extended the structure both at depth and along strike. The drill campaign (so far) has already shown gold mineralization expanding east an additional 375 meters. 2020 is off to a great start! Over the past year, management has achieved excellent bang for their exploration buck, with more results any day now.
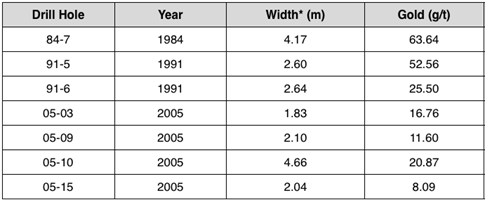
Previous drilling on the Bend Vein returned the following select high-grade assays:
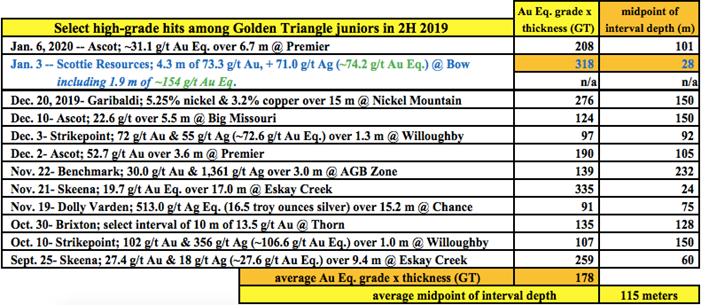
Notice that drill hole SR19-11, mentioned above, had a [grade x thickness] of 318. Compare that to these other [high-grade] intervals in the GT in 2019. Also, the midpoint of each interval’s depth is provided. Scottie’s blockbuster interval was found at 28 meters. The average depth of peer intervals is 115 meters.
<>
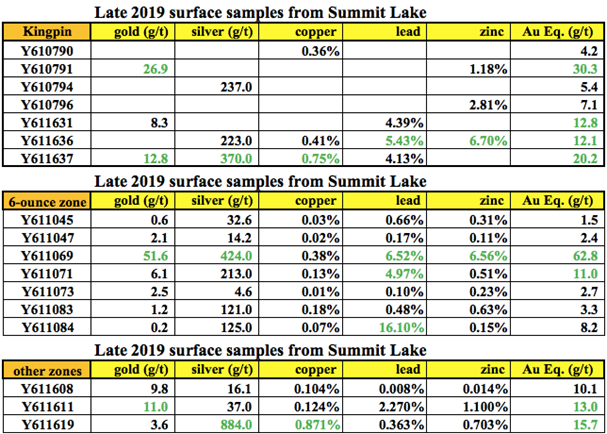
Surface grab samples at Summit Lake look very promising .
CEO Rourke and VP exploration Thomas Mumford, PhD, are ecstatic over the latest drill results, and also recent surface samples from the much larger Summit Lake property.
The above surface (grab) samples were reported three weeks ago. The best eight (in green) range from 11.0 to 62.8 g/t Au Eq, and average 22.2 g/t Au Eq. There are high-grade showings of copper, lead, zinc and silver, (884 g/t = 28.4 troy oz./t Ag). Summit Lake, Bow and the past-producing Scottie Gold mine total 5,672 hectares. As can be seen in the map above, the top half of this three-property contiguous block borders Pretium.
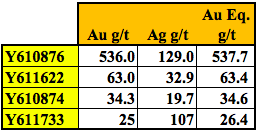
These impressive Summit Lake samples were reported about a month after even more exciting samples were announced on November 14th. The best four samples are listed below. They come from the newly discovered Domino zone on the 100%-owned Scottie Gold mine property.
Referring to the Domino zone, VP of Exploration Dr. Thomas Mumford commented,
“These initial sample results are exciting, their distribution and high-grade nature fit spectacularly well with our working geological model. This mineralized structure will be a high-priority drill target for the 2020 field season. The potential that it may connect to the Scottie Gold Mine mineralizing system make this an exceptional discovery. Sampling of many of these sites was only possible due to significant glacial retreat in recent years. We are eager to get back on the ground to find and delineate additional drill targets.”
We already know for certain that the Scottie Gold mine property hosts high-grade mineralization, from 1981-1985 it produced over 95,000 ounces of gold at a tremendous average grade of 16.2 g/t. That’s a much higher grade than Pretium’s world famous Brucejack mine is currently producing at ~9 g/t.
In addition to high-grade production records, there are some outstanding historical drill results at the Scottie Gold mine project as well. How about 108.3 g/t Au over 3.4 meters, or 107.7 g/t Au over 4.2 meters? Not bad at all! All known mineralization on Bow and Scottie Gold, from a total of 525 drill holes, is found at shallow depths. I find it encouraging that these blockbuster grades were found across 3.4 and 4.2 meters, not merely half-meter, one-hit wonders.
Mining M&A in N. America & the gold price making big moves!
Three big gold deals were announced in 4Q 2019 alone, including Kirkland Lake’s plans to acquire Detour Gold. If Detour is taken out, Pretium would be one of the last single-asset gold companies in Canada. Brucejack, situated less than 50 km from Scottie, is one of North America’s lowest-cost, highest-margin producers.
Pretium is 234x the size of Scottie Resources. If it’s not acquired, it might try to acquire one or more GT juniors like Ascot, GT Gold, Skeena Resources, Tudor Gold or Garibaldi Resources. As an aside, Seabridge Gold is also a potential acquirer. Those companies, with EVs ranging from $84 to $217 million, could in turn look to buy a company like Scottie Resources, with an EV of $14 million.
I don’t mean to overplay a takeout thesis, but, the gold price is now at US$ 1,576/oz, up ~US$ 112/oz since U.S. impeachment proceedings and Iran / North Korea troubles commenced, and up ~US$ 300/oz from the low of 2019. Gold in $USD is the highest it’s been in 80 months. Furthermore, 2019 was reportedly the biggest year for gold mining M&A in North America since 2010.
Neighboring Pretium and Ascot valuations bullish for Scottie
Looking at the map, it’s clear why Pretium might want to acquire Scottie Resources. Or, at least move to control the three properties where Pretium and Scottie share a border. Scottie’s valuation is so low relative to Pretium’s that it might be cheaper to pursue Scottie’s properties than to drill virgin areas on Pretium’s existing footprint.
Perhaps more likelylook at the map againAscot certainly has a compelling reason to care about Scottie, and the company’s digestible EV of $14 million is right in Ascot’s sweet spot. Ascot has multiple projects and properties, but only one with evidence of very high-grade mineralization like that of Scottie’s Bow (new drill results), Scottie Gold mine (past production + historical drill results + new surface samples) and Summit Lake (new grab samples).
Ascot’s EV of $210 million is 15x that of Scottie, and its share price is up 85% in the past two months alone, resulting in Ascot trading at $8,631/ha vs. $766/ha for Scottie. While Ascot’s Red Mountain and Premier projects have substantially more drill holes on them, both have lower gold grades, and high-grade mineralization starting roughly 100 meters deeper than that of Scottie’s near-surface deposits.
Tudor & GT Gold have giant intercepts of sub 1.0 to 1.5 g/t Au Eq as thick as one kilometer or more. Grade x thickness readings for these assays are quite good, but drilling and mining through 1,000+ meters of rock can be costly and time consuming, especially if the projects are far from critical infrastructure.
Garibaldi’s assets in Canada are base metal (especially nickel + copper) heavy. Diversification into high-grade gold and silver could be an attractive option. With an EV of $96 million, it too could comfortably afford to make a run at Scottie. After 2020’s drill results (I believe Scottie is thinking about 5,000 meters of drilling, subject to adequate funding), the company will be well more advanced.
Soon after 2020 drill results, one or more resource estimates likely
Within 1218 months, management should be able to deliver a robust NI 43-101 compliant resource estimate from one or both of the Scottie Gold and Bow properties. In 2H 2021, shareholders might receive a third-party Preliminary Economic Assessments (PEA). In my opinion, Scottie could secure a JV or farm-in partner as soon as next year, upon which time funding requirements would drop dramatically.
Located at the southern end of the GT, Scottie’s properties are an easy drive of about an hour, on paved roads, from Stewart, BC. For the most part, infrastructure in the southern portion of the GT is significantly better than the middle and northern regions.
Conclusion
With gold prices and M&A activity up substantially, all eyes are on the Golden Triangle. However, not all of the GT juniors have had recent drilling success. Not all are focused on shallow, high-to-ultra-high-grade gold deposits. Not all have good infrastructure. Not all own or control 100% of sizable land packages. Not all have enterprise values of $14 million or less.
Scottie Resources (TSX-V: SCOT) is blessed with many positive attributes and has successfully advanced its flagship properties very nicely in 201819 with limited capital expenditures. There have been three major initiatives over the past several months, and three fantastic outcomes.
1] great new drill results on January 3rd at Bow, 2] excellent surface samples on the Scottie Gold mine property and 3] great grab samples at Summit Lake. This is a company to watch closely in 2020. In fact, watch closely the rest of January, as further drill results are imminent.
Peter Epstein is the founder of Epstein Research. His background is in company and financial analysis. He holds an MBA degree in financial analysis from New York University’s Stern School of Business.
Disclosures: The content of this article is for information only. Readers fully understand and agree that nothing contained herein, written by Peter Epstein of Epstein Research [ER], (together, [ER]) about Scottie Resources, including but not limited to, commentary, opinions, views, assumptions, reported facts, calculations, etc. is not to be considered implicit or explicit investment advice. Nothing contained herein is a recommendation or solicitation to buy or sell any security. [ER] is not responsible under any circumstances for investment actions taken by the reader. [ER] has never been, and is not currently, a registered or licensed financial advisor or broker/dealer, investment advisor, stockbroker, trader, money manager, compliance or legal officer, and does not perform market making activities. [ER] is not directly employed by any company, group, organization, party or person. The shares of Scottie Resources are highly speculative, not suitable for all investors. It is assumed and agreed upon by readers that they will consult with their own licensed or registered financial advisors before making any investment decisions.
At the time this article was posted, Peter Epstein owned shares of Scottie Resources and the Company was an advertiser on [ER].
Readers understand and agree that they must conduct their own due diligence above and beyond reading this article. While the author believes he’s diligent in screening out companies that, for any reasons, are unattractive investment opportunities, he cannot guarantee that his efforts will (or have been) successful. [ER] is not responsible for any perceived, or actual, errors including, but not limited to, commentary, opinions, views, assumptions, reported facts, financial calculations, etc., or for the completeness of this interview or future content. [ER] is not expected or required to subsequently follow or cover events & news, or write about any particular company. [ER] is not an expert in any company, industry sector or investment topic.
Streetwise Reports Disclosure: 1) Peter Epstein’s disclosures are listed above. 2) The following companies mentioned in the article are billboard sponsors of Streetwise Reports: Pretium Resources and Seabridge Gold. Click here for important disclosures about sponsor fees. The information provided above is for informational purposes only and is not a recommendation to buy or sell any security. 3) Statements and opinions expressed are the opinions of the author and not of Streetwise Reports or its officers. The author is wholly responsible for the validity of the statements. The author was not paid by Streetwise Reports for this article. Streetwise Reports was not paid by the author to publish or syndicate this article. Streetwise Reports requires contributing authors to disclose any shareholdings in, or economic relationships with, companies that they write about. Streetwise Reports relies upon the authors to accurately provide this information and Streetwise Reports has no means of verifying its accuracy.
4) The article does not constitute investment advice. Each reader is encouraged to consult with his or her individual financial professional and any action a reader takes as a result of information presented here is his or her own responsibility. By opening this page, each reader accepts and agrees to Streetwise Reports’ terms of use and full legal disclaimer. This article is not a solicitation for investment. Streetwise Reports does not render general or specific investment advice and the information on Streetwise Reports should not be considered a recommendation to buy or sell any security. Streetwise Reports does not endorse or recommend the business, products, services or securities of any company mentioned on Streetwise Reports. 5) From time to time, Streetwise Reports LLC and its directors, officers, employees or members of their families, as well as persons interviewed for articles and interviews on the site, may have a long or short position in securities mentioned. Directors, officers, employees or members of their immediate families are prohibited from making purchases and/or sales of those securities in the open market or otherwise from the time of the interview or the decision to write an article until three business days after the publication of the interview or article. The foregoing prohibition does not apply to articles that in substance only restate previously published company releases. As of the date of this article, officers and/or employees of Streetwise Reports LLC (including members of their household) own securities of Pretium Resources, a company mentioned in this article.