Metals Slashed As US/Iran War Fears Fade

By Orbex

Gold

It’s been a volatile week for gold. After breaking out to its highest levels since April 2013, the yellow metal has since reversed sharply. As of writing, it is ending the week back below the 2019 high.

The initial upside in gold was driven by a wave of risk-off trading in reaction to news of escalating tensions between the US and Iran. Following the state funeral of Iranian general Soleimani, who was killed by a US airstrike last week, Iran retaliated for the attack by launching ballistic missiles at two US army bases in Iraq.

As news of the rocket attack broke, equities collapsed. Traders feared the move might push the US and Iran into war. However, Trump downplayed the significance of the attack.

He addressed the nation saying that according to intelligence, Iran was stepping down and as such, the US would not be entering a military conflict with it.

As quickly as gold had rallied, the reversal saw prices cascading lower. Equities traders cheered the news and drove index prices higher. However, given the hostile nature of relations between the two countries, further attacks cannot be ruled out. Therefore, upside risks remain for gold.

Technical Perspective

The rally in gold this week saw price trading up to test the 1608.54 resistance level which saw strong selling. Price has since declined back below the 1554.69 2019 high, putting focus on a move back down to test next support at the 1522.75 level. Bulls will need to see price stay above this level to keep focus on further upside. However, the weekly candle here suggests the risk of a deeper correction lower in the coming sessions.

Silver

Silver prices tracked the moves in gold this week, trading higher initially as safe-haven demand for gold drove buying. However, the subsequent reversal in gold has taken silver prices lower on the week.

As with gold, however, the residual risk of further conflict between the US and Iran poses upside risks for silver in the near term. Should the situation remain, focus will then shift back onto the progress of US/China trade talks. The two sides are due to sign off on the phase one trade deal

Technical Perspective

Silver prices traded up to test the 18.6397 level resistance this week though, as with gold, strong selling kicked in at the level, taking price lower. For now, price is still above the 17.3408 level, keeping focus on further upside in the near term. Should we move back below this level, however, focus will be on a test of the 16.52 level next.

By Orbex


Carney Comments Hit GBP

By Orbex

USD Higher Ahead of NFP

The US dollar has ended the week firmly higher as a string of better data has lifted sentiment. The ISM non-manufacturing reading came in well above expectations, followed by a stronger than expected ADP print which has fuelled expectations of a strong NFP release later today. The USD index trades 97.26 last.

Euro Lower

EURUSD has been lower over the week, weighed on by the recovery in the US dollar. Earlier in the week, the CPI flash reading came in at 1.3% as expected, marking a 0.3% improvement on the prior month.

However, amidst the recent slew of weak data, it failed to provide any support for EURUSD which trades down at 1.1095 as of writing.

GBP Lower on Carney Comments

GBPUSD has been a little weaker over the week despite news that UK parliament has now officially approved the PM’s Withdrawal Agreement Bill, meaning the UK will leave the EU on January 31st.

However, comments from BOE Governor Carney have weighed on GBP. Carney said that an interest rate cut could still be needed as the projected rebound following Brexit was not a certainty and growth is still below potential. GBPUSD trades 1.2970 last.

SPX500 Hits New Highs

Risk assets have ended the week firmly higher as the calming of tensions between the US and Iran as met with a relief rally across the markets. The SPX500 has broken out to new all-time highs as of today, trading 3282.43.

With the US and China due to sign off on the phase one trade deal next week, equities are likely to remain supported.

JPY & Gold Lower

Safe havens have been lower today in light of the rally in equities and in the USD which has seen both JPY and gold trading lower. USDJPY trades 109.63 last, trading back up to test recent highs which now look vulnerable to breaking.

XAUUSD trades 1548.63 last, back below the 1522.75 level.

Crude Heavily Lower

Oil prices have been sharply lower into the end of the week. Following the initial upside in response to US/Iran tensions, the calming of that situation has seen price reversing lower. The EIA then added further pressure to the move, reporting an inventory surplus for the first time in four weeks. Crude trades 59.31 last.

Loonie Recovering

USDCAD has been higher today, with price trading back above the 1.3068 level in response to the weakness in crude which has weighed on CAD. Along with US labour market data due later today, the market also receives the Canadian employment reports which could cause further volatility.

Aussie Ends The Week lower

AUDUSD has bee a little higher today, boosted by the general improvement in risk appetite. AUD ends the week heavily lower, however, as the market now anticipates that the RBA will be forced to cut rates in February in response to the economic damage caused by the wildfires there. AUDUSD trades .6874 last.

By Orbex


Fibonacci Retracements Analysis 10.01.2020 (BITCOIN, ETHEREUM)

Article By RoboForex.com

BTCUSD, “Bitcoin vs US Dollar”

As we can see in the daily chart, BTCUSD has finished the correctional uptrend at the long-term resistance, which is 50.0% fibo at 8500.00. However, we shouldn’t exclude further growth towards 61.8% at 8958.00, but only after a short-term decline, because “Golden Cross” on MACD has been formed very recently. Still, the main scenario implies that the instrument is expected to start a new descending wave to reach the low at 6430.30 and then mid-term 76.0% fibo at 5700.00.

BITCOIN
Risk Warning: the result of previous trading operations do not guarantee the same results in the future

In the H4 chart, the pair is correcting towards the local support, which is 23.6% fibo at 7395.00. If the price rebounds, it may start a new impulse to reach 61.8% fibo at 8958.00. Later, BTCUSD may break this level and fix below it. In this case, the instrument may continue falling to attack the low.

BTCUSD_H4
Risk Warning: the result of previous trading operations do not guarantee the same results in the future

ETHUSD, “Ethereum vs. US Dollar”

As we can see in the daily chart, the correctional uptrend has stopped at 38.2% fibo. According to the main scenario, the price is expected to fall and reach the low at 116.06, but the next rising wave may head towards 50.0% and 61.8% fibo at 157.57 and 167.40 respectively.

ETHEREUM
Risk Warning: the result of previous trading operations do not guarantee the same results in the future

The H4 chart shows that after reaching 38.2% fibo, the price has started a new decline. MACD indicates further growth after a short-term decline.

ETHUSD

Article By RoboForex.com

Attention!
Forecasts presented in this section only reflect the author’s private opinion and should not be considered as guidance for trading. RoboForex LP bears no responsibility for trading results based on trading recommendations described in these analytical reviews.

Equities Rally As China & US Prepare To Sign Trade Deal

By Orbex

The US-China trade deal was once again back in focus, pushing equities to resume the rally. The gains come after China said that its vice premier will be traveling to the US to sign the phase one of the trade deal.

The announcement indicates that the final issues have been resolved, paving the way for what could be a historic deal after almost a year of uncertainty.

Germany’s Industrial Production Rises in November

The latest industrial production figures from Germany saw a better increase. Industrial production grew 1.1% on the month in November 2019. This reverses the 1.0% decline from the month before. Economists forecast a growth rate of just 0.9%. Excluding energy and construction, industrial production was up 1.0% for the period.

EURUSD Finds Support, but Downside Could Prevail

The currency pair, after slipping past the rising trend line is consolidating near the horizontal support level of 1.1100. The bias is to the downside if there is a breakdown further. A decline below 1.1100 will signal a move to the next downside target of 1.1072. We suspect that in the medium term, the EURUSD will remain range-bound within these levels.

GBP drops as EU Doubts UK Trade Deal

The pound sterling came under pressure after EU officials ruled out the possibility of a full EU–UK trade deal by the end of 2020. The comments were made by Ursula von der Leyen. The comments come in contrast to the views from the British PM. Johnson is hopeful that the UK will be able to have a trade deal in place by the end of this year.

GBPUSD Retracing Losses For Now

Cable is retracing the losses from earlier in the day. This comes as price has broken past the support level of 1.3100. If this retracement ends near 1.3100 then we expect declines to resume. The descending triangle pattern remains in play giving the downside target to a minimum of 1.2960.

Gold Weaker as Fed Speeches Get Underway

Gold prices continued to fall on the broader market sentiment. Fed vice-chair Richard Clarida gave a speech on Thursday. He reiterated the general consensus that interest rates are appropriate for the economy for the time being. He reaffirmed that the Fed was ready to adjust policy if needed. Clarida was also optimistic about the economy, noting that consumers will drive economic expansion into the eleventh year.

XAUUSD Breaks the Major Trend Line

The precious metal has slipped past the second trend line as well indicating further weakness. Continued declines will see gold dipping to the 1534 handle in the near term. But considering the payrolls report today, we could expect a rebound. For the upside to regain momentum, XAUUSD will need to break past the 1594 highs.

By Orbex


Forex Technical Analysis & Forecast 10.01.2020 (EURUSD, GBPUSD, USDCHF, USDJPY, AUDUSD, USDRUB, USDCAD, GOLD, BRENT, BTCUSD)

Article By RoboForex.com

EURUSD, “Euro vs US Dollar”

EURUSD is still moving downwards; it has formed another consolidation range around 1.1107. Today, the pair may form a new descending structure towards 1.1090 to complete the correctional wave. If the price breaks 1.1111, the instrument may resume moving upwards with the first target at 1.1200.

EURUSD
Risk Warning: the result of previous trading operations do not guarantee the same results in the future

GBPUSD, “Great Britain Pound vs US Dollar”

GBPUSD has reached the target of the descending structure at 1.3050, which may be considered as the first half of the third wave. Possibly, today the pair may consolidate around this level and then expand the range down to 1.3000. Later, the market may resume falling with the short-term target at 1.2888.

GBPUSD
Risk Warning: the result of previous trading operations do not guarantee the same results in the future

USDCHF, “US Dollar vs Swiss Franc”

USDCHF has formed another consolidation range around 0.9718. Possibly, today the pair may grow towards 0.9770. After that, the instrument may start a new decline to reach 0.9717 and then form one more ascending structure with the target at 0.9790.

USDCHF
Risk Warning: the result of previous trading operations do not guarantee the same results in the future

USDJPY, “US Dollar vs Japanese Yen”

USDJPY is growing with the target at 109.75. Today, the pair may reach 109.70. Later, the market may form a new descending structure towards 109.50 and then resume moving upwards to reach the above-mentioned target and complete this ascending wave. After that, the instrument may start another decline with the first target at 107.85.

USDJPY
Risk Warning: the result of previous trading operations do not guarantee the same results in the future

AUDUSD, “Australian Dollar vs US Dollar”

AUDUSD is still consolidating above 0.6850 without any particular direction. Possibly, the pair may form one more ascending structure towards 0.6898 and then resume moving downwards to reach 0.6872. continue growing with the target at 0.6945. After that, the instrument may start another growth to break 0.6898 and then continue trading inside the uptrend with the first target at 0.6945.

AUDUSD
Risk Warning: the result of previous trading operations do not guarantee the same results in the future

USDRUB, “US Dollar vs Russian Ruble”

USDRUB is falling towards 61.00; it has already reached the short-term target at 61.12. The main scenario implies that the price may test 61.50 from below and then resume trading inside the downtrend to reach 61.00.

USDRUB
Risk Warning: the result of previous trading operations do not guarantee the same results in the future

USDCAD, “US Dollar vs Canadian Dollar”

USDCAD continues growing towards 1.3131. Later, the market may start another decline to reach 1.3040 and then form one more ascending structure with the target at 1.3150.

USDCAD
Risk Warning: the result of previous trading operations do not guarantee the same results in the future

XAUUSD, “Gold vs US Dollar”

Gold continues moving downwards. After expanding the consolidation range down to 1540.00 and forming the ascending impulse towards 1556.40 along with the correction at 1547.30, Gold has defined the borders of a new consolidation range. If later the price breaks this range to the upside at 1558.00, the market may resume moving upwards to reach 1568.20; if to the downside at 1540.00 – start a new decline with the target at 1516.00.

GOLD
Risk Warning: the result of previous trading operations do not guarantee the same results in the future

BRENT

Brent is consolidating around 65.95 and may resume growing. If later the price breaks this range to the upside at 66.60, the market may resume moving upwards with the first target at 68.55; if to the downside at 64.90 – extend the correction and form a new descending structure to reach 63.30.

BRENT
Risk Warning: the result of previous trading operations do not guarantee the same results in the future

BTCUSD, “Bitcoin vs US Dollar”

BTCUSD has reached its short-term downside target at 7750.00. Possibly, today the pair may start a new growth to reach 8050.00 and then resume falling towards 7700.00 to finish the correction. Later, the market may form one more ascending structure with the target at 8600.00.

BITCOIN

Article By RoboForex.com

Attention!
Forecasts presented in this section only reflect the author’s private opinion and should not be considered as guidance for trading. RoboForex LP bears no responsibility for trading results based on trading recommendations described in these analytical reviews.

The Analytical Overview of the Main Currency Pairs on 2020.01.10

by JustForex

The EUR/USD currency pair

Technical indicators of the currency pair:
  • Prev Open: 1.11033
  • Open: 1.11020
  • % chg. over the last day: -0.01
  • Day’s range: 1.11020 – 1.11111
  • 52 wk range: 1.0879 – 1.1572

The single currency is trading stably against the USD. EUR/USD quotes are testing local support and resistance levels at 1.10950 and 1.11200, respectively. Participants in financial markets took a wait-and-see attitude before the publication of labor statistics from the USA for December. We recommend that you pay attention to the difference between the actual and forecast values of the indicators. The trade conflict between the US and China has again come to the fore. Vice Premier Liu He will leave for the United States next week to sign the first phase of the agreement. Open positions from key levels.

At 15:30 (GMT+2:00) the US will publish a report on the labor market.

EUR/USD

Indicators do not give accurate signals: the price is consolidating near 50 MA.

The MACD histogram is in the negative zone, but above the signal line, which gives a weak signal to sell EUR/USD.

Stochastic Oscillator is in the neutral zone, the %K line has crossed the %D line. There are no signals at the moment.

Trading recommendations
  • Support levels: 1.10950, 1.10500
  • Resistance levels: 1.11200, 1.11350, 1.11650

If the price consolidates below expect a fall toward 1.10600-1.10400.

Alternatively, the quotes could grow toward 1.11500-1.11700.

The GBP/USD currency pair

Technical indicators of the currency pair:
  • Prev Open: 1.30963
  • Open: 1.30660
  • % chg. over the last day: -0.22
  • Day’s range: 1.30604 – 1.30916
  • 52 wk range: 1.1959 – 1.3516

The technical pattern on the GBP/USD currency pair is still ambiguous. Sterling is trading in a flat. At the moment, the local support and resistance levels can be distinguished at 1.30550 and 1.31000, respectively. Investors expect important statistics from the United States. GBP/USD quotes have the potential to decline. We recommend keeping track of current information on the Brexit issue. Open positions from key levels.

Today, the news background on the UK economy is calm.

GBP/USD

Indicators do not give accurate signals: the price has crossed 50 MA.

The MACD histogram is close to the 0 mark.

The Stochastic Oscillator is near the overbought zone, the %K line crossed the %D line. There are no signals at the moment.

Trading recommendations
  • Support levels: 1.30550, 1.30150
  • Resistance levels: 1.31000, 1.31600, 1.32000

If the price consolidates below 1.30550, expect the quotes to fall toward 1.30000.

Alternatively, the quotes could rise toward 1.31400-1.31600.

The USD/CAD currency pair

Technical indicators of the currency pair:
  • Prev Open: 1.30386
  • Open: 1.30569
  • % chg. over the last day: +0.19
  • Day’s range: 1.30533 – 1.30689
  • 52 wk range: 1.2949 – 1.3566

On the USD/CAD currency pair, a bullish sentiment prevails. The trading instrument has set new local highs. CAD is currently consolidating around 1.30500-1.30800. USD/CAD quotes can grow further. Investors are waiting the publication of a report on the labor market in Canada. We also recommend you to pay attention to statistical data from the United States and the dynamics of prices for oil. Open positions from key levels.

At 15:30 (GMT+2:00), labor statistics from Canada will be published.

USD/CAD

The signals of the indicators are varied. The price has fixed above 50 MA and 100 MA, which signals the strength of buyers.

The MACD histogram is in the positive zone, but below the signal line, which gives a weak signal to buy USD/CAD.

Stochastic Oscillator is located near the oversold zone, the %K line is below the %D line, which indicates a bearish sentiment.

Trading recommendations
  • Support levels: 1.30500, 1.30250, 1.30000
  • Resistance levels: 1.30800, 1.31000

If the price consolidates above 1.30800, expect further growth toward 1.31200-1.31400.

Alternatively, the quotes could descend toward 1.30250-1.30000.

The USD/JPY currency pair

Technical indicators of the currency pair:
  • Prev Open: 109.083
  • Open: 109.510
  • % chg. over the last day: +0.33
  • Day’s range: 109.450 – 109.597
  • 52 wk range: 104.45 – 113.53

The USD/JPY currency pair is showing aggressive purchases. Since the beginning of this week, quotes growth exceeded 170 points. The trading tool has reached key extremes. At the moment, the USD/JPY currency pair is testing the supply zone 109.600-109.700. Mark 109.250 is the immediate support. Demand for the safe haven currencies weakened amid declining fears of further escalation of the conflict in the Middle East. Today we recommend paying attention to economic data from the USA. Open positions from key levels.

The Economic News Feed for 10.01.2020 is calm.

USD/JPY

Indicators point to the strength of buyers: the price has fixed above 50 MA and 100 MA.

The MACD histogram is in the positive zone but below the signal line, which gives a weak signal to buy USD/JPY.

The Stochastic Oscillator is in the neutral zone, the %K line crossed the %D line. There are no signals at the moment.

Trading recommendations
  • Support levels: 109.250, 108.850, 108.600
  • Resistance levels: 109.700, 110.000

If the price consolidates above 109.700, expect further growth toward 110.000-110.200.

Alternatively, the quotes could descend toward 108.900-108.700.

by JustForex

Dollar Index Has Updated Local Highs Again

by JustForex

The US dollar strengthened against a basket of currency majors again. The dollar index (#DX) closed yesterday in the green zone (+0.17%). News of the plane crash in Iran is in the focus of attention. Previously, it was assumed that the passenger Boeing crashed due to technical malfunctions. However, now the British and American media say that it was Iran that fired two missiles, as a result of which a crash occurred.

Investors expect additional drivers. Today, financial market participants will assess labor statistics from the US and Canada. We recommend paying attention to the difference between the actual and forecasted values of the indicators. These reports may have a significant impact on the dynamics of currency majors in the short term.

Today, during the Asian trading session, optimistic economic data from Australia have been published. Thus, retail sales rose by 0.9% in November instead of 0.4%.

The “black gold” prices have been declining. Currently, futures for the WTI crude oil are testing the $59.40 mark per barrel. At 20:00 (GMT+2:00), Baker Hughes US rig count will be published.

Market Indicators

Yesterday, there was the bullish sentiment in the US stock market: #SPY (+0.68%), #DIA (+0.75%), #QQQ (+0.85%).

The 10-year US government bonds yield is consolidating. At the moment, the indicator is at the level of 1.86-1.87%.

The Economic News Feed for 10.01.2020:
  • – Report on the labor market in the US at 15:30 (GMT+2:00);
  • – Labor statistics from Canada at 15:30 (GMT+2:00).

by JustForex

Commitment of Traders (COT) Data Suggests Gold In Rally Mode

By TheTechnicalTraders – Many people believe the price of Gold will need to fall to support Institutional short positions.  We don’t believe this is the case.  The Commitment Of Traders (COT) Data suggests Commercial Hedgers have a large and growing shot position that is a very positive sign for a continued rally in Gold and Miners looking forward months from now.

Don’t think about COT data like everyone else with it comes to gold.

Over the past 20+ years, every time the COT Commercial Hedgers position in Gold falls, weakens substantially, or makes new multi-year lows the price of gold rallies.

Why record commercial short hedge position is bullish

It is my belief that the markets will move in favor of where the big money (commercial/institutions) want it to go in most cases. so if the commercial’s keep adding a short hedge position that means they are adding to heir long exposure and need to add more of a hedge to help protect their growing LONG position.

The weakening COT data from 2001 through 2012 is a perfect example.  As Commercial Hedgers moved away from Gold, the price of gold rallied to the all-time highs.

Additionally, after the major bottom in Gold in 2016, Commercial traders would have bought and accumulated gold driving the price higher.

Now, in late 2018 and throughout all of 2019, the Commercial Hedger COT position in Gold has fallen to the lowest level in the past 20+ years. This suggests the rally in Gold has really just begun to accelerate to the upside and there are more people buying gold than ever before who are buying protection (hedging)

The COT data I find very deceiving because it’s displayed and delayed in a way that makes traders and investors think the opposite.

Wall Street is in the business of making a market, and that means they play a game of deception so you do the opposite of what they are doing. Wall Street show As you watch gold moving with your new view on the COT data, you will notice gold will rally and post strong moves, then a couple of weeks later the COT data comes out.

With all that said, this is just my view and opinion of how I read the COT data for gold specifically. As with every chart and trader, there are many different ways things can be analyzed and viewed.

Since the price just had a strong advance, and you now see the commercials have added to their short position you naturally expect a pullback after a price rally especially when you see the big players adding to their short/hedge position. But what really just happened? the big players bought gold, and they had to hedge some of their new position. Very bullish in my opinion. While I do not use it for trading, it is a good confirming indicator of a trend.

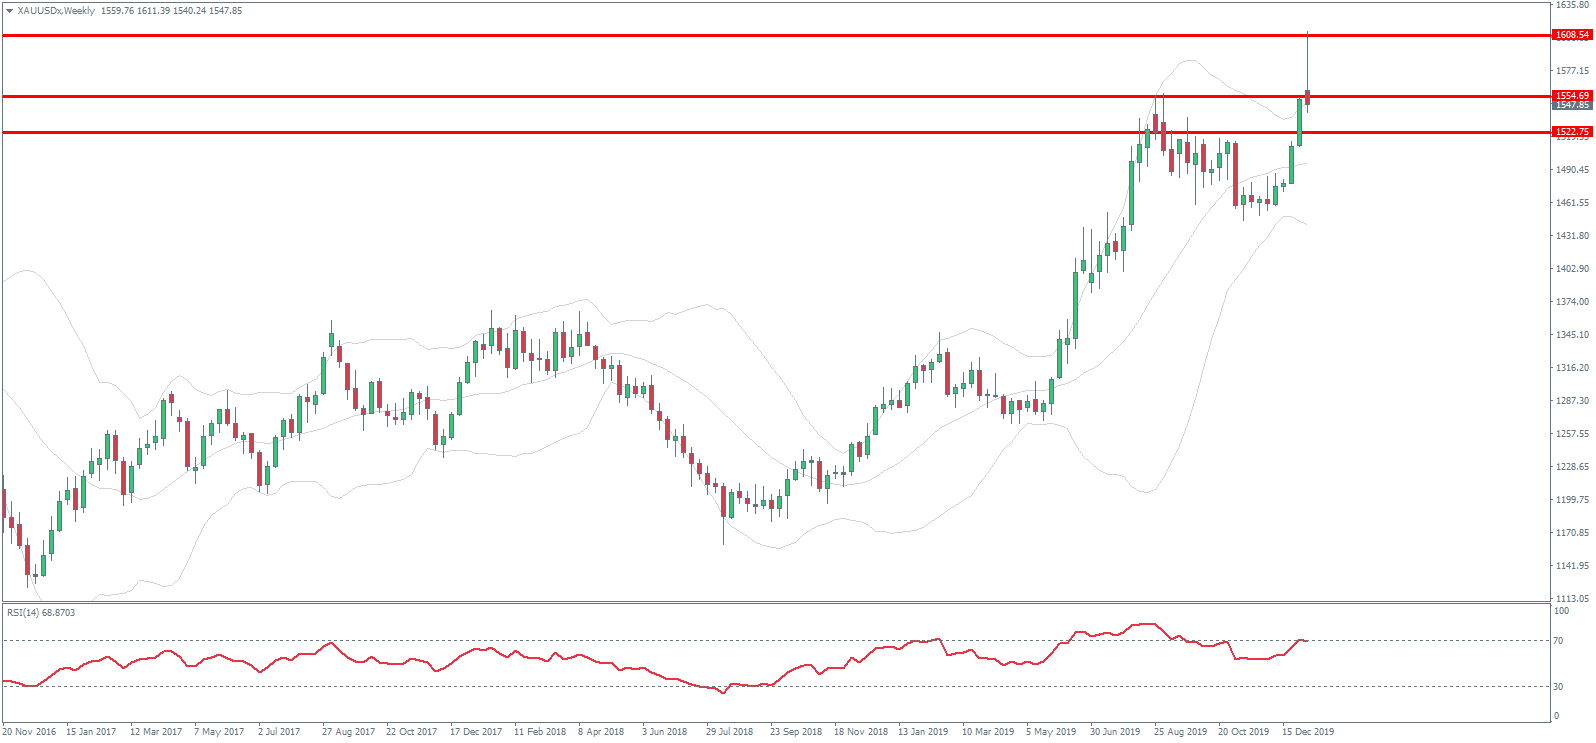
Our research team, as well as our proprietary price modeling systems, suggested that Gold may rally to levels above $3700 before reaching an ultimate peak.  Currently, our predictive modeling systems are suggesting the next target is well above $1600 and we believe our original target from our October 2018 analysis, of $1700 to $1750, is still very valid.

We believe this current upside price rally in Gold will attempt to clear the previous high levels near $1924 – from September 2011.  We believe moderate resistance/rotation near $1700 to $1750 will be the last level of price resistance before a continued rally will push Gold prices above the $1924 peak – possibly stalling just below $2100.  Once price breaches the previous high level, we expect a short period of price rotation before another upside price acceleration takes Gold prices above $2400 to $2500.

Gold Miners are poised for an incredible upside price rally if our analysis of Gold is accurate.  GDXJ is currently trading near $42 – showing moderate weakness while Gold has seen some strength this week.  We believe Miners will do very well once Gold really breaks out above $1750 and begins to target the previous all-time high level.

Much like our expectations for Gold, we believe GDXJ will rally to levels near $60 once this current overbought condition wears off. Then we expect it to head towards $60 and rotate lower for a few weeks before attempting to rally further to levels above $70+.

Take a minute to review some of our recent Gold research posts to gain further insight

January 2, 2020: ADL GOLD PREDICTION CONFIRMS TARGETS

December 30, 2019: METALS & MINERS PREPARE FOR AN EARLY 2020 LIFTOFF

December 4, 2019: 7 YEAR CYCLES CAN BE POWERFUL AND GOLD JUST STARTED ONE

You won’t want to miss this incredible run in Precious Metals and Miners.  Follow our research.  Learn how we can help you find and execute better trades.  We’ve been warning all of our followers of this move for months – now it is about to get very real. In fact, we are giving away free silver and gold bullion bars to all new subscribers of our trading newsletter!

As a technical analysis and trader since 1997 I have been through a few bull/bear market cycles, I have a good pulse on the market and timing key turning points for both short-term swing trading and long-term investment capital. The opportunities are massive/life-changing if handled properly.

I urge you visit my Wealth Building Newsletter and if you like what I offer, join me with the 1 or 2-year subscription to lock in the lowest rate possible and ride my coattails as I navigate these financial markets and build wealth while others lose nearly everything they own.

Chris Vermeulen

TheTechnicalTraders.com


The USD/JPY is easily holding above 108.00 – will today’s NFPs change this?

By Admiral Markets

Source: Economic Events January 10, 2020 – Admiral Markets’ Forex Calendar

Despite the recent developments in the Middle East since the US Pentagon launched an airstrike that killed Iranian commander Soleimani, stoking fears that a war between the US and Iran could be in the near future, the overall picture in the USD/JPY didn’t substantially change.

With no sustainable risk-off hitting the market and volatility staying all in all quite low, a sustainable drop below 108.00 wasn’t seen, in fact the USD/JPY is currently trading back above 109.00 and in positive territory for the week.

Whether this will change or not is not only dependent on the developments in regards to the US and Iran, but also dependent on today’s Non-Farm Payroll data set which will be published at 1330 GMT.

The consensus for December lies at 164,000, after NFPs increased by 266,000 in November 2019. Main driver for the solid print in December was certainly the strong number from the manufacturing sector, reflecting the return of workers from a GM strike. But given the latest ISM Employment numbers and without striking workers returning, this month’s NFPs could likely disappoint.

If so and expectations of market participants of at least one 25 basis point cut in 2020 keep on increasing significantly above 70% (currently and according to the Fed Watch Tool we see a likelihood of ~60%), the USD/JPY could see another drop down to 108.00.

In general, we still consider the USD/JPY an attractive short candidate from a risk-reward perspective midterm.

Technically, the main focus stays on 106.80/107.00, where, from a technical perspective, a break lower could result in a drop as low as 105.00 and probably even lower.

On the other hand: a push above 110 activates 110.70, playing into the cards of USD/JPY bulls, at least short-term:

Source: Admiral Markets MT5 with MT5-SE Add-on USD/JPY Daily chart (between October 30, 2018, to January 9, 2020). Accessed: January 9, 2020, at 10:00pm GMT – Please note: Past performance is not a reliable indicator of future results, or future performance.

In 2015, the value of the USD/JPY increased by 0.5%, in 2016, it fell by 2.8%, in 2017, it fell by 3.6%, in 2018, it fell by 2.7%, in 2019, it fell by 0.85%, meaning that after five years, it was down by 9.2%.

Discover the world’s #1 multi-asset platform

Admiral Markets offers professional traders the ability to trade with a custom, upgraded version of MetaTrader 5, allowing you to experience trading at a significantly higher, more rewarding level. Experience benefits such as the addition of the Market Heat Map, so you can compare various currency pairs to see which ones might be lucrative investments, access real-time trading data, and so much more. Click the banner below to start your FREE download of MT5 Supreme Edition!

Download MetaTrader 5 and begin trading today!

Disclaimer: The given data provides additional information regarding all analysis, estimates, prognosis, forecasts or other similar assessments or information (hereinafter “Analysis”) published on the website of Admiral Markets. Before making any investment decisions please pay close attention to the following:

  1. This is a marketing communication. The analysis is published for informative purposes only and are in no way to be construed as investment advice or recommendation. It has not been prepared in accordance with legal requirements designed to promote the independence of investment research, and that it is not subject to any prohibition on dealing ahead of the dissemination of investment research.
  2. Any investment decision is made by each client alone whereas Admiral Markets shall not be responsible for any loss or damage arising from any such decision, whether or not based on the Analysis.
  3. Each of the Analysis is prepared by an independent analyst (Jens Klatt, Professional Trader and Analyst, hereinafter “Author”) based on the Author’s personal estimations.
  4. To ensure that the interests of the clients would be protected and objectivity of the Analysis would not be damaged Admiral Markets has established relevant internal procedures for prevention and management of conflicts of interest.
  5. Whilst every reasonable effort is taken to ensure that all sources of the Analysis are reliable and that all information is presented, as much as possible, in an understandable, timely, precise and complete manner, Admiral Markets does not guarantee the accuracy or completeness of any information contained within the Analysis. The presented figures refer that refer to any past performance is not a reliable indicator of future results.
  6. The contents of the Analysis should not be construed as an express or implied promise, guarantee or implication by Admiral Markets that the client shall profit from the strategies therein or that losses in connection therewith may or shall be limited.
  7. Any kind of previous or modeled performance of financial instruments indicated within the Publication should not be construed as an express or implied promise, guarantee or implication by Admiral Markets for any future performance. The value of the financial instrument may both increase and decrease and the preservation of the asset value is not guaranteed.
  8. The projections included in the Analysis may be subject to additional fees, taxes or other charges, depending on the subject of the Publication. The price list applicable to the services provided by Admiral Markets is publicly available from the website of Admiral Markets.

Leveraged products (including contracts for difference) are speculative in nature and may result in losses or profit. Before you start trading, you should make sure that you understand all the risks.

By Admiral Markets

Dec 2019 Payrolls Data On The Docket

By Orbex

The monthly nonfarm payrolls report will be coming out today from the US Labor Department.

This will be the first payrolls report for this year, but the data covers the month of December. Overall, the expectations for December NFP are somewhat conservative.

Economists are forecasting that unemployment will be steady at 3.5%. The payrolls estimates are towards the 150k region, while there is some optimism that wages will rise 0.3%, marking a slightly higher pace of increase during the month.

The recent ISM manufacturing activity, however, casts a dark shadow on the payroll estimates. The underlying data in the manufacturing sector is pointing to months before any recovery could take place.

This could potentially mean that the average payrolls may take a hit.

The November payrolls saw a big boost, largely thanks to the General Motors strike. This enabled employment in the motor vehicle sector to rise 41,300. Indirectly, this also helped the overall manufacturing sector jobs to rise 54,000 as well.

US Change in Nonfarm payrolls, November 2019

Besides the payroll figures, focus will also stay on wage growth. US wage growth has been steady near 3.0% – 3.1% on average. For the moment, with inflation staying sluggish, wages continue to outstrip inflation.

However, given the risk that inflation could rise, wages will need to pick up steam.

One interesting factor to look into will be the diffusion index. The diffusion index measures the percentage of manufacturing industries contributing to the overall job figures.

The data has been hinting towards a core improvement in the manufacturing sector. A similar trend could potentially point to the slump in the manufacturing sector turning the corner.

But this means that investors will have to wait at least for three months to see this taking shape.

Mixed Manufacturing & Services Sector Activity

The latest data covering the business activity in the services and manufacturing sector paints a mixed picture.

While the manufacturing sector continues to remain in a slump, the services sector, on the other hand, rebounded during the month. However, employment in both the services and manufacturing sector fell slightly from the month before.

Given the weakness in the employment sub-sector, the expectations for a weaker headline print stay consistent. The data also indicates that the US economy remains in the late stages of economic growth.

Often during this period, one gets to see lower payroll figures. Therefore, focus will shift to the unemployment rate and wage growth. With the forecasts showing that the unemployment rate will be steady at 3.5%, wages will remain the big-ticket item to watch out for.

US Wage Growth MoM – November 2019

Early indications show that inflation could rise in the coming months, largely on account of higher fuel prices. Thus, amid this backdrop, a sluggish wage report will be disappointing for investors.

Fed officials are, however, likely to remain on the sidelines, giving room for monetary policy to take its course until March. The big question is whether the Fed will hold rates steady in March.

As a result, the December NFP will be of importance. Any consistent signs of weakness in the labor market could trigger officials to take preventive measures, by cutting interest rates.

In the short term, today’s impact from the NFP will be seen across all asset classes including equities and forex.

By Orbex