Tesla Inc. stock was the talk of the town this week after exploding to an all-time high above $545.
A wave of optimism over the company’s performance, strong international growth and profitability enticed investors to grab a piece of the Tesla pie. The future is certainly bright for Tesla and this sentiment continues to be reflected in the company’s stock which has appreciated roughly 28% since the start of 2019 and gained almost 110% over the past three months! It seems there is no stopping this rally with more good news bound to push shares to fresh all-time highs.
The technical picture is in a favour of bulls with the path of least resistance pointing north. A daily close above $540 should encourage an incline towards $550. If prices are unable to keep above $540, a technical correction towards $500 could be on the cards before prices attempt to push higher.
Bank of America profits drop on lower interest rates
Bank of America shares edged higher on Wednesday after the bank reported fourth-quarter profits that beat forecasts but revenues fell short of expectations.
The United States second-biggest lender after JPMorgan Chase experienced a 1.7% fall in revenue to $22.3 billion while net income beat analyst estimates of $6.3 billion by hitting $7 billion during the final quarter of 2019. However, this still represented a 4.1% drop in profits when compared with last year.
Focusing on the company’s shares, prices are trading around $34.58 as of writing. A breakdown below $34.25 should encourage a move lower towards $33.75.
Amazon stocks gearing up for a rebound?
Amazon shares have the potential to rebound after reporting a “record-breaking” 2019 holiday season- defined in the sales world as of November 1 to December 24.
Optimism on US-China trade and global growth may support buying interest towards the stock. Given how the multinational e-commerce company is expected to benefit from strong growth in its cloud services and advertising businesses, the outlook remains encouraging.
Amazon shares have broken out of the sideways trend seen since August 2019, trading around the $1877 level as of writing. A breakout above $1900 may inspire an incline towards $1920 and $1950.
Disclaimer: The content in this article comprises personal opinions and should not be construed as containing personal and/or other investment advice and/or an offer of and/or solicitation for any transactions in financial instruments and/or a guarantee and/or prediction of future performance. ForexTime (FXTM), its affiliates, agents, directors, officers or employees do not guarantee the accuracy, validity, timeliness or completeness, of any information or data made available and assume no liability as to any loss arising from any investment based on the same.
Sector expert Michael Ballanger offers his insights into the precious metals markets as 2020 begins.
It was one of those days that all sexagenarians loathe; you have to go to the doctor, and whether it’s the GP (general practitioner) or the dentist or the proctologist, nothing reminds you more rapidly of your advancing age than going to the optometrist.
Now, many of you would say that your annual prostate exam or a root canal or bloodwork would be the dreaded of all medical dreads, but for me, it is having the 50-something eye lady remind me that two years ago (when I last mustered up the courage to see her), my long vision was great and my reading vision required only 150-magnification “cheaters.” Smiling at me as if I just ran the New York Marathon, she then proceeds to tell me that I now require “progressive lenses” and 325-mag reading glasses.
Staring at her with slack-jawed miasma, I tell her that I can “manage just fine” and that since I am constantly losing my Dollar Store reading glasses, I really don’t feel an overwhelming desire to walk around with $900 glasses that will make me feel “like a new and younger man!” I won’t feel very young if I find them in a snowbank after running over them with the Toro Supercharger that does zero-to-thirty in less than sixty seconds and blows snow fifty feet in the air.
Then off I went to the dentist for the afternoon ordeal, only to have this millennial mouth-breather dental technician constantly scold me for “not flossing enough” as she takes her Black & Decker plaque remover to my gums.
Then the Generation X Chinese dentist looks into my mouth with his forehead lamp blinding me and tells me that an “old filling” (from the 1900s, he is sure) has come loose and he will need to clean it up. So, driving home to the site of lovely Lake Scugog, I was astonished that a policeman (who shaves once a month) didn’t pull me over and yank my license for the “unsafe operation of a vehicle” because I can’t read the bottom line of the eye chart or because my root canal from 1937 is failing.
All in all, this was just “one of those days.”
However, this week has played out exactly as I predicted, instructed and rued, as the precious metals succumbed to the weight brought to bear by three events:
· A rampaging stock market · Severely overbought conditions in gold and silver, and · 90% bullish consensus for the metals
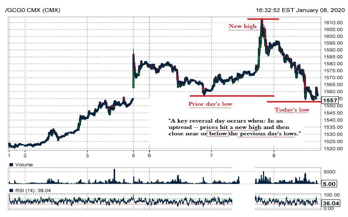
Now, I was fearful, albeit briefly, that the assassination of Iranian General Qasem Soleimani by a U.S. drone strike might have kicked the precious metals into the same short squeeze moonshotas we had back in June where we stayed overbought for most of the month. But alas, as I said on Monday, geopolitical events always get faded (sold), and just as stocks failed to follow through to the downside after the Sunday evening massacre, gold reacted identically and closed the week out about $66 off the wee-hours peak of US$1,613/ounce from last Monday morning.
I raised 30% cash in the portfolio at or near the highs seen Friday and Monday, and have advised all subscribers to refrain from buying any of the names in the GGMA portfolio until things settle down, probably next week, but surely by month-end.
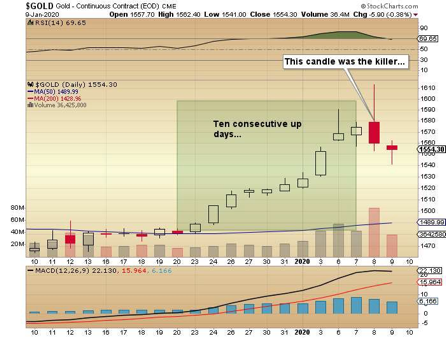
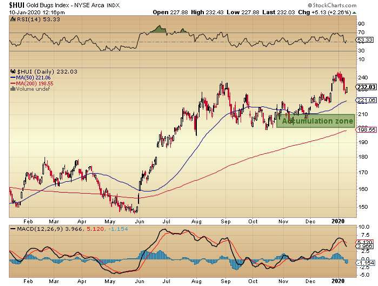
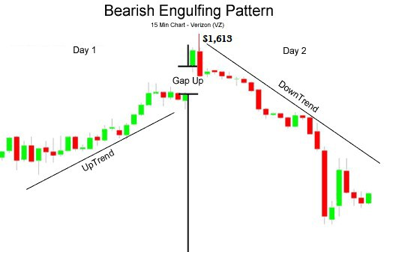
The daily gold chart for the past month shows a really ugly “bearish engulfing” candle that surely, albeit in retrospect, serves as the apex for the latest advance. While it is certainly a formidable short-term top, it by no means has changed my 2020 forecast for substantially higher prices for gold and silver.
The key to outperformance, for me at least, seems to lie in “fading blind optimism” and “buying despair” and, of course, looking under my desk to see if Fido is content. If, God forbid, he is to be found under the tool shed or off his food, then surely a bullion bank takedown is either pending or upon us.
Needless to say, Fido is not a happy puppy as he appears to be getting totally intolerant of the constant shenanigans in our precious metals markets, and also of the absurdity of this constant Twitter “cheerleading” by “the Donald.”
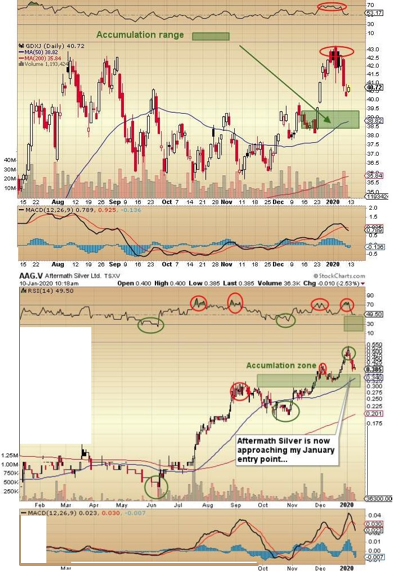
The moves I made to raise cash in the two miner exchange-traded funds, GDX and GDXJ, in addition to taking off all the leveraged positions (futures, options, ETFs) allows me to begin to target a re-entry point for those same positions. The danger lies in trying to get “too cute” trading these things, because in a true bull market such as this one, you make one false move and suddenly they are 3% higher and you are unable to get back on board. I cannot tell you all how many times that has happened to me, so to avoid this, I scale in and I scale out, taking 2550% initial positions and then adding as they go the right way.
On Friday morning Jan. 10, we are getting a nice precious metal rebound off the lows thanks to a disappointing non-farm-payroll report (the “unemployment” report), where the weak number plus negative revisions were shrugged off by the rampaging equities bull.
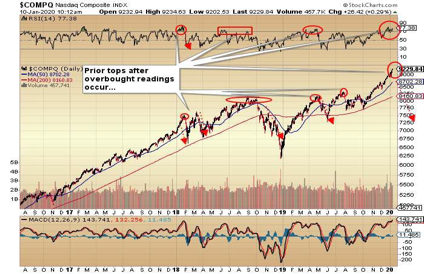
The chart of the NASDAQ shown above is a screaming “sell” with RSI (relative strength index) in the high 70s and at a level where it has topped out numerous times in the last three years. However, we are in an election year and I am so cynical of the collusion and intervention and manipulation that I just cannot find the courage to short this massively overvalued market. It is like the Ontario housing market; people keep leveraging up to own million-dollar houses on 90-foot lots with 1,500 square feet of living space that went for $200,000 ten years ago. It’s just another bank-created bubble, and part of this enormous global wave of credit that benefits only the financial crowd and those who have learned to game the system.
Trust me when I tell you that it will not end well, but also keep in mind that these cretins have kept the charade intact for infinitely longer than I (or Ray Dalio or Stanley Druckenmiller or Jeffrey Gundlach) might ever have dreamed. I hate to use this well-worn phrase but it is certainly true that “markets can remain irrational much longer than you or I can remain solvent.” This is the reason I use stop-losses and cut-losses quickly, no matter whether my reasoning is sound or not. Rigged markets do that to you, so never forget it.
Here are a few charts to give you an idea of where my head is at in terms of buying back or initiating positions in the various names in the Forecast Issue. (Not all but a few. . .)
My inbox is now chock-full o’ queries as to whether last week’s rally constitutes a bottom for the Gold Miner ETF’s and the answer is categorically “NO!” When you get an outside reversal day like we had on Monday, you don’t usually have a tradeable bottom until at least a couple of weeks later. You can see from the chart shown below how it unfolded.
Here is the textbook definition of what grabbed gold by the throat on Monday. It is a powerful technical signal and while of course there is no certainty that we are entering a prolonged downtrend, I include it here as a way of accentuating the need for patience.
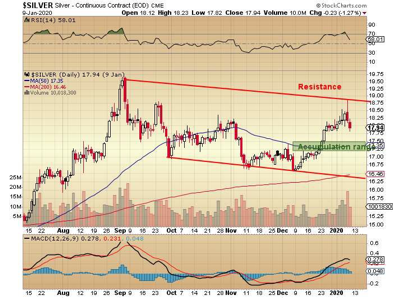
Since many of you are new subscribers, I want you to accumulate the GGMA portfolio (should that be your intention) at optimum prices and hopefully into oversold (as opposed to overbought) conditions, with RSI sub-30.
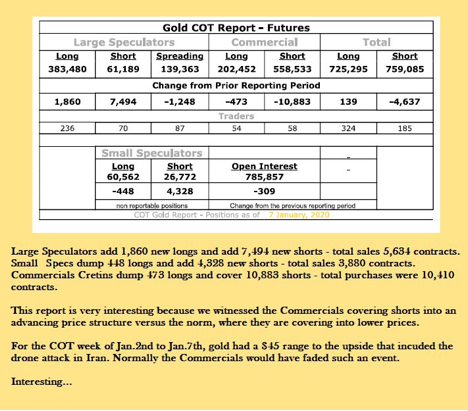
COT Report
The COT, or Commitment of Traders, report covers activity on the Crimex futures exchange and the interplay between “Commercials” (large bullion banks acting for miners and metal fabricators, as well as their own prop accounts), “Large Speculators” (large commodity funds run by CTAs [commodity trading advisors], hedge funds, and locals), and “Small Speculators” (small retail investors usually on the wrong end of most major trends). It covers a Tuesday-to-Tuesday reporting period and is released on Friday afternoons at around 3:30 p.m. It is far more predictive during bear market periods, as liquidity is sparse and the big banks can move the market wherever they wish.
The Commercials are the arm of the U.S. Treasury and the major central banks, and for this reason, you must be very attentive to their positioning. However, the period of June to September had the Commercials heavily short during the entire rise of US$250 per ounce. Selling or getting short metals and miners alongside the Commercials proved a faulty strategy for more than a few investors. (Even I lightened up on the leveraged ETFs prematurely.)
The COT report for the week ended Jan. 7 means very little, but suffice it to say that, at an aggregate short position of 356,081 contracts held by Commercial traders, it coincides with major tops in past years. It is one reason why I am “cautious,” not “bearish,” on the metals and miners going into this first few weeks of the New Year. Another week of sideways to down action and I will probably begin to accumulate.
So now I’m going to put some eyedrops in my eyes and some oil of cloves on my loose filling, guzzle some Metamucil, pop a few anti-arthritis pills and try to make it to Monday when I’m sure some poor defenseless fool will remind me of just how really ancient I have become.
Billy clubs and hobnail boots are great, ain’t they?
Originally trained during the inflationary 1970s, Michael Ballanger is a graduate of Saint Louis University where he earned a Bachelor of Science in finance and a Bachelor of Art in marketing before completing post-graduate work at the Wharton School of Finance. With more than 30 years of experience as a junior mining and exploration specialist, as well as a solid background in corporate finance, Ballanger’s adherence to the concept of “Hard Assets” allows him to focus the practice on selecting opportunities in the global resource sector with emphasis on the precious metals exploration and development sector. Ballanger takes great pleasure in visiting mineral properties around the globe in the never-ending hunt for early-stage opportunities.
Disclosure: 1) Michael J. Ballanger: I, or members of my immediate household or family, own securities of the following companies mentioned in this article: Aftermath Silver. My company has a financial relationship with the following companies referred to in this article: Aftermath Silver. I determined which companies would be included in this article based on my research and understanding of the sector. Additional disclosures are below. 2) The following companies mentioned in this article are billboard sponsors of Streetwise Reports: None. Click here for important disclosures about sponsor fees. As of the date of this article, an affiliate of Streetwise Reports has a consulting relationship with Aftermath Silver. Please click here for more information. Within the last six months, an affiliate of Streetwise Reports has disseminated information about the private placement of the following companies mentioned in this article: Aftermath. 3) Statements and opinions expressed are the opinions of the author and not of Streetwise Reports or its officers. The author is wholly responsible for the validity of the statements. The author was not paid by Streetwise Reports for this article. Streetwise Reports was not paid by the author to publish or syndicate this article. Streetwise Reports requires contributing authors to disclose any shareholdings in, or economic relationships with, companies that they write about. Streetwise Reports relies upon the authors to accurately provide this information and Streetwise Reports has no means of verifying its accuracy. 4) This article does not constitute investment advice. Each reader is encouraged to consult with his or her individual financial professional and any action a reader takes as a result of information presented here is his or her own responsibility. By opening this page, each reader accepts and agrees to Streetwise Reports’ terms of use and full legal disclaimer. This article is not a solicitation for investment. Streetwise Reports does not render general or specific investment advice and the information on Streetwise Reports should not be considered a recommendation to buy or sell any security. Streetwise Reports does not endorse or recommend the business, products, services or securities of any company mentioned on Streetwise Reports. 5) From time to time, Streetwise Reports LLC and its directors, officers, employees or members of their families, as well as persons interviewed for articles and interviews on the site, may have a long or short position in securities mentioned. Directors, officers, employees or members of their immediate families are prohibited from making purchases and/or sales of those securities in the open market or otherwise from the time of the interview or the decision to write an article until three business days after the publication of the interview or article. The foregoing prohibition does not apply to articles that in substance only restate previously published company releases. As of the date of this article, officers and/or employees of Streetwise Reports LLC (including members of their household) own securities of Aftermath Silver, a company mentioned in this article.
Charts provided by the author.
Michael Ballanger Disclaimer: This letter makes no guarantee or warranty on the accuracy or completeness of the data provided. Nothing contained herein is intended or shall be deemed to be investment advice, implied or otherwise. This letter represents my views and replicates trades that I am making but nothing more than that. Always consult your registered advisor to assist you with your investments. I accept no liability for any loss arising from the use of the data contained on this letter. Options and junior mining stocks contain a high level of risk that may result in the loss of part or all invested capital and therefore are suitable for experienced and professional investors and traders only. One should be familiar with the risks involved in junior mining and options trading and we recommend consulting a financial adviser if you feel you do not understand the risks involved.
The hostilities between the US and Iran have subsided for now. However, it would be foolish to deem the crisis as having “ended”.
The year began with President Trump ordering the assassination of a top Iranian general, Qassem Soleimani. This was the first time, since the start of World War II, that the US has ordered such an attack.
The killing sparked outrage in Iran. The country immediately threatened to take heavy revenge on the US for killing Soleimani, who was a war hero in Iran.
The world watched in horror over those days, fearing that retaliation by Iran would inevitably lead to war. Trump publicly threatened that should Iran retaliate, the US would respond with up to 52 airstrikes on key Iranian targets including Iranian cultural sites.
Iran Retaliates
Iran saw large state gatherings for Soleimani’s burial. And after days of heavily aggressive rhetoric from Iran, they did respond. The country launched a series of 22 ballistic missiles at US army bases in Iraq.
The attack was met with horror as the world waited on the US response.
Trump Dials Back Tensions
Unexpectedly, Trump scaled back tensions by refraining from launching any physical retaliation. During an address to the nation, Trump announced further economic sanctions on Iran.
However, he said that, in light of intelligence reports suggesting that Iran was backing down from any further conflict, the US would not be responding at this stage.
Iran Admits Shooting Down Ukranian Airliner
Following a great deal of relief at having avoided further hostilities, things took a dark turn, however.
A Ukranian passenger jet flying into Iran was shot down, with all 176 passengers losing their lives.
The US immediately accused Iran of being behind the attack, which Iran initially denied. However, in the end, the Iranian military made the unprecedented move of admitting to the attack, live on TV.
The Iranians stated that the plane had been mistaken for a US missile, which it was trying to defend against.
Protests Begin in Iran
Over the weekend, protests erupted across Iran as the public reacted in outrage to the killing of Iranians by their own government. However, the protests themselves turned violent. Iranian security fired on the protesters.
The situation has seen a strong reversal in sentiment compared with the public gathering held around Soleimani’s death. Many protestors were seen ripping down posters and banners erected in Soleimani’s honor.
Trump Weighs in On Twitter
Commenting on Twitter, Trump wrote:
Risks Remain
The unexpected nature of recent developments in Iran shows just how fluid and fragile this situation is. And, as such, further aggression between the US and Iran cannot be ruled out.
The US and Iran pulled back from the brink of war last summer over Iranian attacks on oil ships in the Gulf region, followed by Iran shooting down a US drone.
The latest aggression came after months of calm and suggests that even if the US and Iran are not engaged in a full conflict currently, that is not to say this will remain so.
Technical Perspective
Gold prices continue to pull back from the 1608.54 level, with price having now broken back below the 1554.69 2019 highs. The correction is finding support into the lows, however, and, while above the 1522.75 level, a further push higher cannot be ruled out.
If price moves below the 1522.75 level, though, focus will shift to a test of the 1481.93 level next ahead of the broken bull flag pattern.
Cold snap in the US may increase gas demand for heating
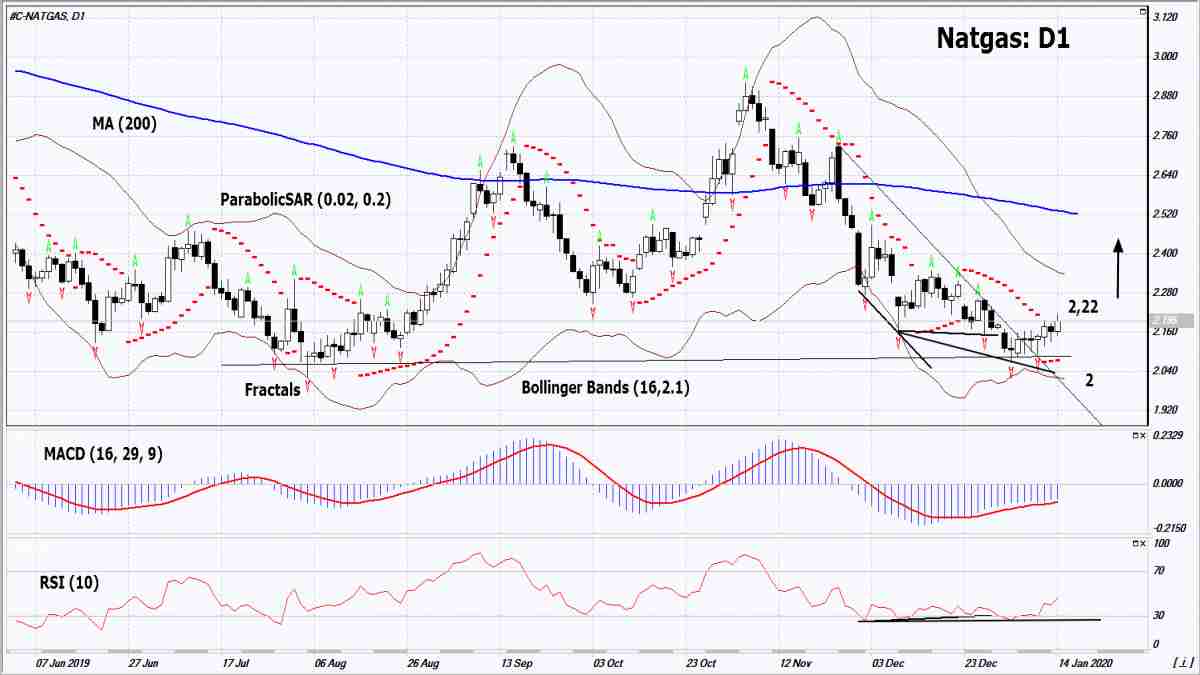
A cold snap is expected in the US in late January. Will the NATGAS rise?
Demand for gas may increase as it is used for heating. Since the beginning of the US heating season in November 2019, gas prices have fallen by 27%. Its production is now by 6.6 billion cubic feet per day higher than the last year’s level and amounts to 94.9 billion cubic feet per day. Due to this, the United States reduced gas imports from Canada. According to various estimates, 23 billion cubic feet per day more of gas than is being consumed currently this week may be required in case of a cold snap. Let us note that gas production and its consumption in the US are now close to historical highs. The U.S. Energy Information Administration (EIA) forecasts an increase in net exports of liquefied natural gas from the United States by 2 billion cubic feet per day in 2020 compared to last year and by another 1.6 billion cubic feet per day in 2021. This may become the main long-term factor for an increase in US natural gas prices, and short-term – the possible cold snap. Let us recall that the US became the first net exporter of gas in 2017.
On the daily timeframe, the Natgas: D1 breached up the resistance line of the downtrend and is correcting upward. It bounced off the support line of a wide neutral range. A number of technical analysis indicators formed buy signals. The further price increase is possible in case of increased demand in the US.
The Parabolic indicator gives a bullish signal.
The Bollinger bands have narrowed, which indicates low volatility.
The RSI indicator is below 50. It has formed some positive divergences.
The bullish momentum may develop in case Natgas exceeds its last high at 2.22. This level may serve as an entry point. The initial stop loss may be placed below the two last fractal lows, the lower Bollinger band, the low since April 2016 and the Parabolic signal at 2. After opening the pending order, we shall move the stop to the next fractal low following the Bollinger and Parabolic signals. Thus, we are changing the potential profit/loss to the breakeven point. More risk-averse traders may switch to the 4-hour chart after the trade and place there a stop loss moving it in the direction of the trade. If the price meets the stop level (2) without reaching the order (2,22), we recommend to close the position: the market sustains internal changes that were not taken into account.
The US dollar held onto gains as the index struggles to break out from the current highs near 97.50.
Economic data from the United States saw inflation data disappointing.
Headline inflation rose 0.2%, while core inflation rose just 0.1%. Still, the data was well within the estimates.
Euro Continues to Trade Subdued
A lack of any economic data from the eurozone saw the euro trading to the USD flows. The common currency continues to trade soft, as it has done for the past few days.
The consolidation is likely to continue ahead of next week’s ECB monetary policy meeting.
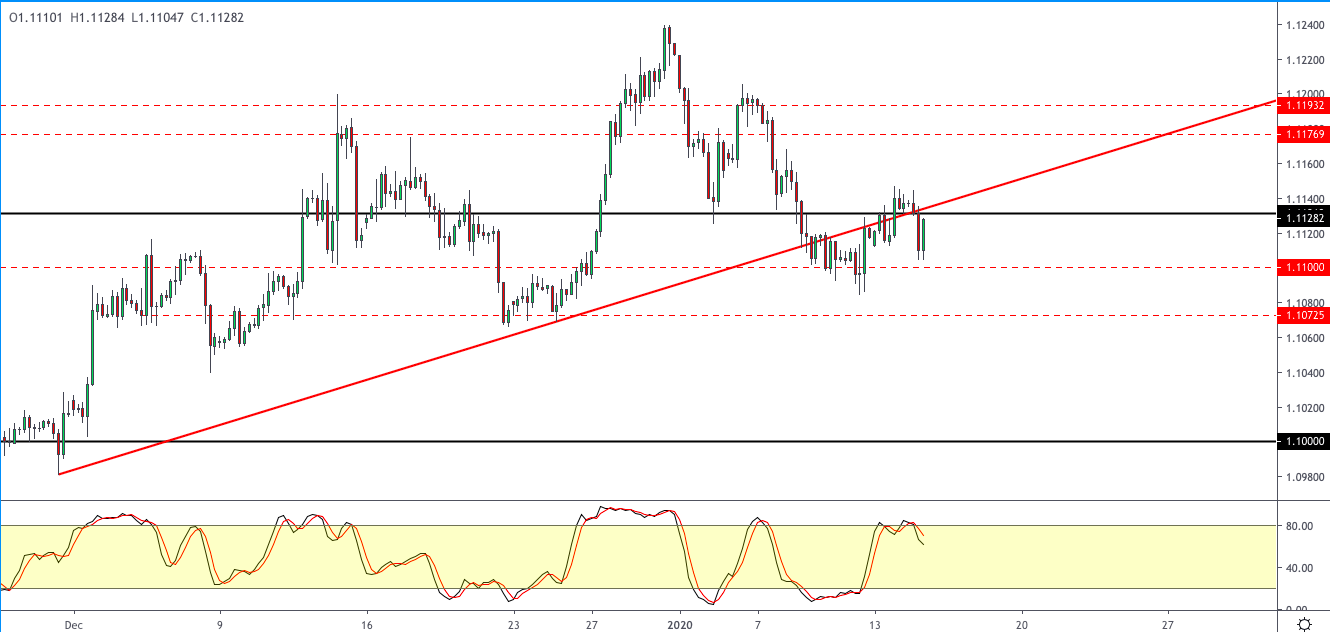
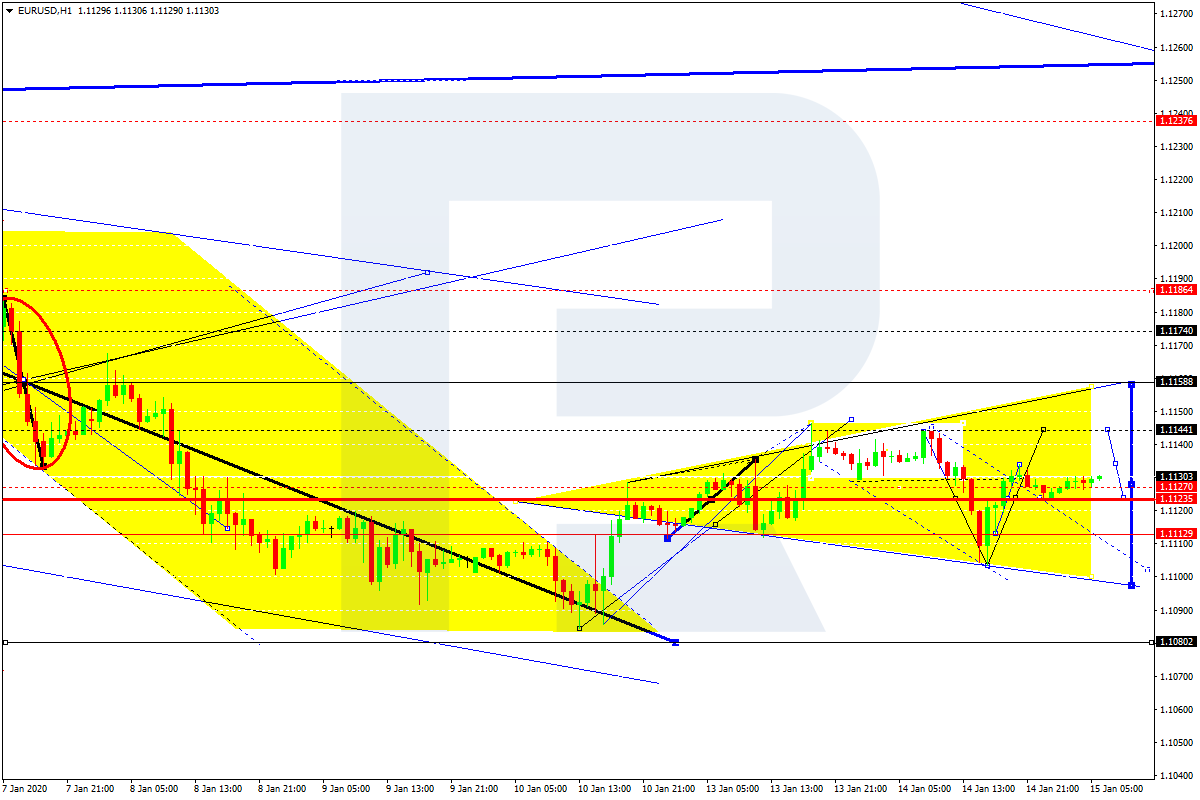
EURUSD Consolidating into a Bearish Flag
Price action in the common currency is consolidating into a bearish flag pattern. This indicates a downside risk. The support area of 1.1100 remains in place for now. But if the bearish pattern is validated, we expect the declines to push through to 1.1072 level eventually.
To the upside, the EURUSD will need to break out convincingly above the 1.1150 resistance level.
Sterling Pares Losses but Downside Risks Remain
The British pound is rebounding following the sell-off from Monday. The declines were set off by dovish remarks from BoE Governor Carney. Although the currency pair is paring losses from Monday, the downside risks remain. EU negotiator Barnier contradicted claims from PM Johnson about the border checks. This remains one of the key points of conflict in the Brexit talks.
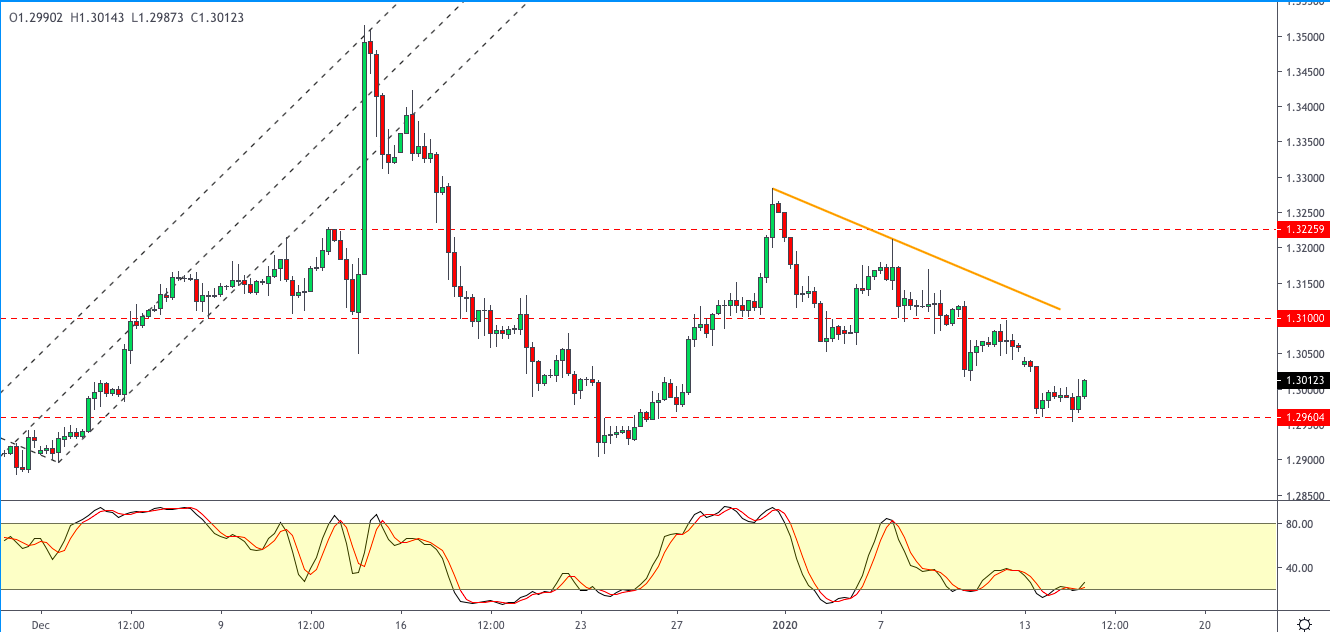
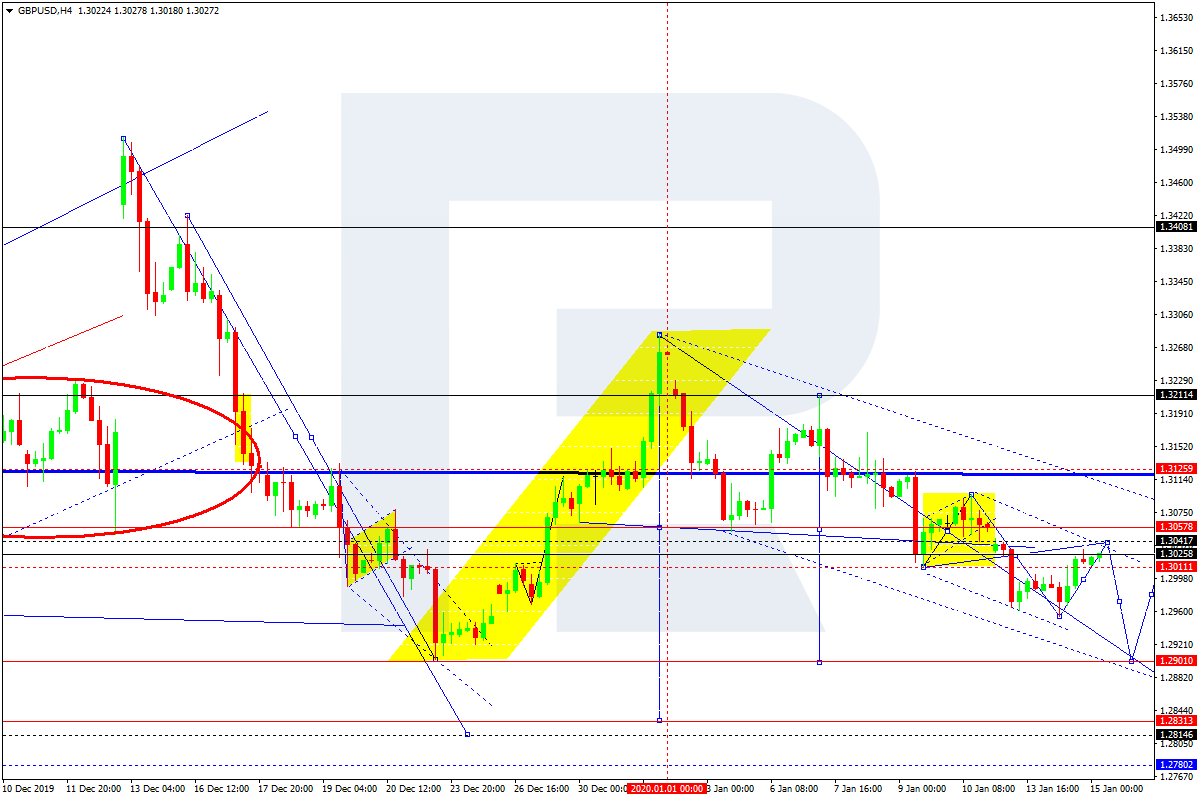
GBPUSD Could Rise to Fill the Gap
Price action in the currency pair is somewhat consistent with the bullish divergence on the 4-hour chart time frame. This indicates a minimum upside correction to 1.3068.
Considering that price left an unfilled gap from earlier this week, we expect the gains to be modest in nature. Price action is likely to remain within the 1.3100 and 1.2960 levels in the near term.
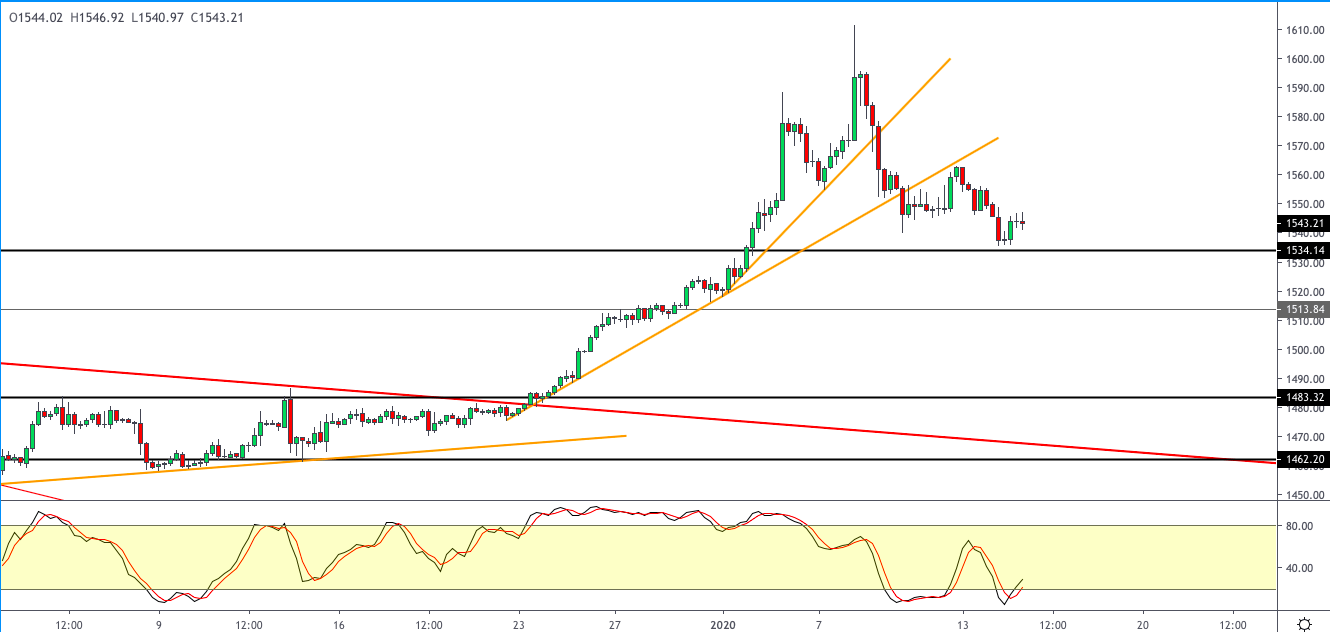
Gold Continues to Drift Lower
The precious metal is gradually retracing the gains made from the previous weeks. A lack of economic data and the impending trade deal signing remain one of the biggest cues for the gold prices at the moment.
President Trump is expected to sign the phase one deal sometime after today.
XAUUSD to Hold Near the Support
The precious metal initially bounced off the support level at 1534. Price action could retrace higher, but for the moment, further gains are unlikely.
The support level is likely to hold in the near term. In the event of a breakdown below this level, gold prices could accelerate the decline down to the 1513 region.
The US dollar has started the day with a mixed tone. The USD index has now spent the week consolidating just below the recent 97.26 highs. US inflation data released yesterday was a little lackluster with headline inflation rising in line with expectations at 0.2% on the month while core inflation missed at just 0.1% on the month. Looking ahead later we have PPI data as the main US data focus.
EUR Down Again
EURUSD has been weaker today also, though at 1.1124, is up off the weekly lows. ECB meeting minutes are the only key Eurozone print this week, due tomorrow. Traders will be keen to see how much division remains in the ECB following Lagarde taking over as ECB head, as well as how much support there is for further easing.
GBP Lower on CPI Miss
GBPUSD has been lower today. The latest inflation data confirmed a weaker than expected reading in December at 1.3% YOY vs 1.5% expected. The data adds to expectations that the BOE will look to ease in the coming months, guided by comments made recently by the BOE’s Carney. Retail sales on Friday will be the next key domestic release this week.
Risk Recovering
Risk assets have started the day on a positive footing as risk sentiment remains supported by today’s scheduled signing of the US/China trade deal which has been in the works since October last year. A Chinese delegation is in Washington to sign the deal today which should then pave the way for talks to move onto the next stage. SPX500 trades 3284.48 last.
Safe Havens Lower
Safe havens have had a subdued session over the European morning on Wednesday. Both JPY and gold have been roughly flat against USD as traders await the next directional catalyst. XAUUSD trades 1552.40 last, capped by the 1554.69 level for now. USDJPY trades 109.88, with JPY a little weaker against USD.
Crude Capped By API Report
Oil prices have been rather flat today also, with crude trading 58.18 last. Yesterday, the API reported a build in US crude stores of 1.1 million barrels. Traders will now be looking to today’s headline EIA release, which could see further downside in crude if the inventory surplus is confirmed.
Loonie Higher Again
USDCAD has been higher again today with price breaking out above the 1.3068 level again following a failed attempt earlier in the week. Should today’s EIA report come in bearish, CAD is likely to be weaker allowing for further upside in the pair.
Aussie Still Down
AUDUSD has been lower again today with price extending down to lows of .6882 before recovering to .6888 as of writing. Strength in USD, as well as dovish RBA expectations, are keeping AUD bias skewed to the downside here with the US/China trade deal now offering only limited support.
After breaking the consolidation range to the downside, EURUSD has completed the correction at 1.1104; right now, it is forming one more ascending wave towards 1.1114. Later, the market may start a new correction to reach 1.1123 and then resume moving upwards with the target at 1.1155.
GBPUSD, “Great Britain Pound vs US Dollar”
GBPUSD is moving upwards with the target at 1.3041. After that, the instrument may form a new descending structure to reach the short-term target at 1.2901.
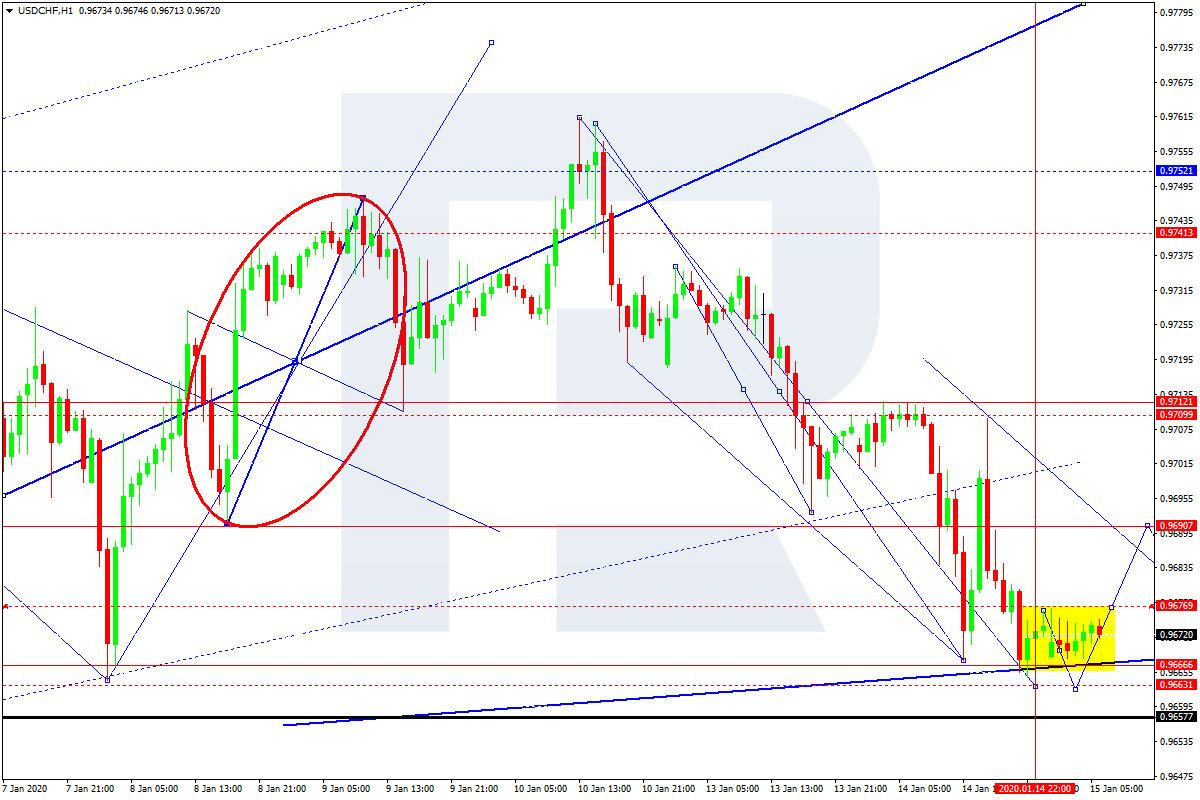
USDCHF, “US Dollar vs Swiss Franc”
USDCHF is consolidating above 0.9666. Possibly, today the pair may reach 0.9660 and then form one more ascending structure with the target at 0.9690.
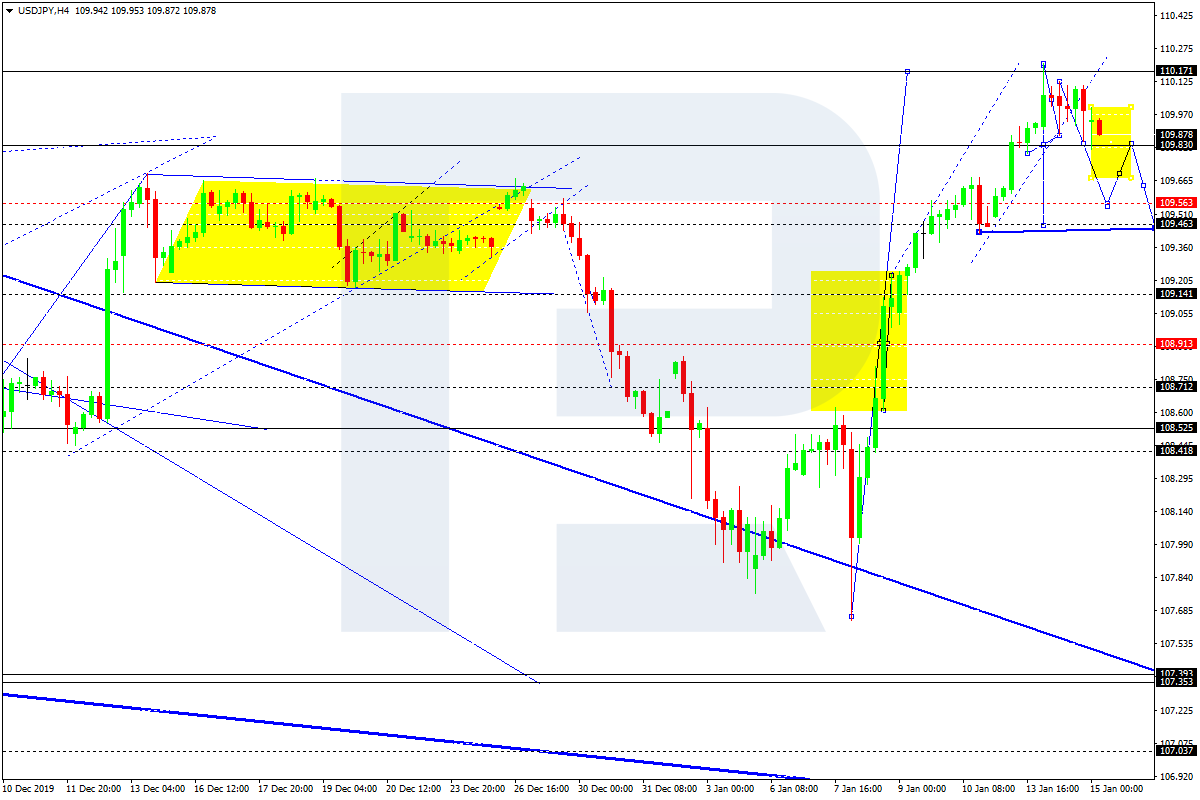
USDJPY, “US Dollar vs Japanese Yen”
USDJPY is forming the second descending impulse. Possibly, the pair may reach 109.56 and then start another growth towards 109.83. Later, the market may form a new descending structure with the target at 109.46.
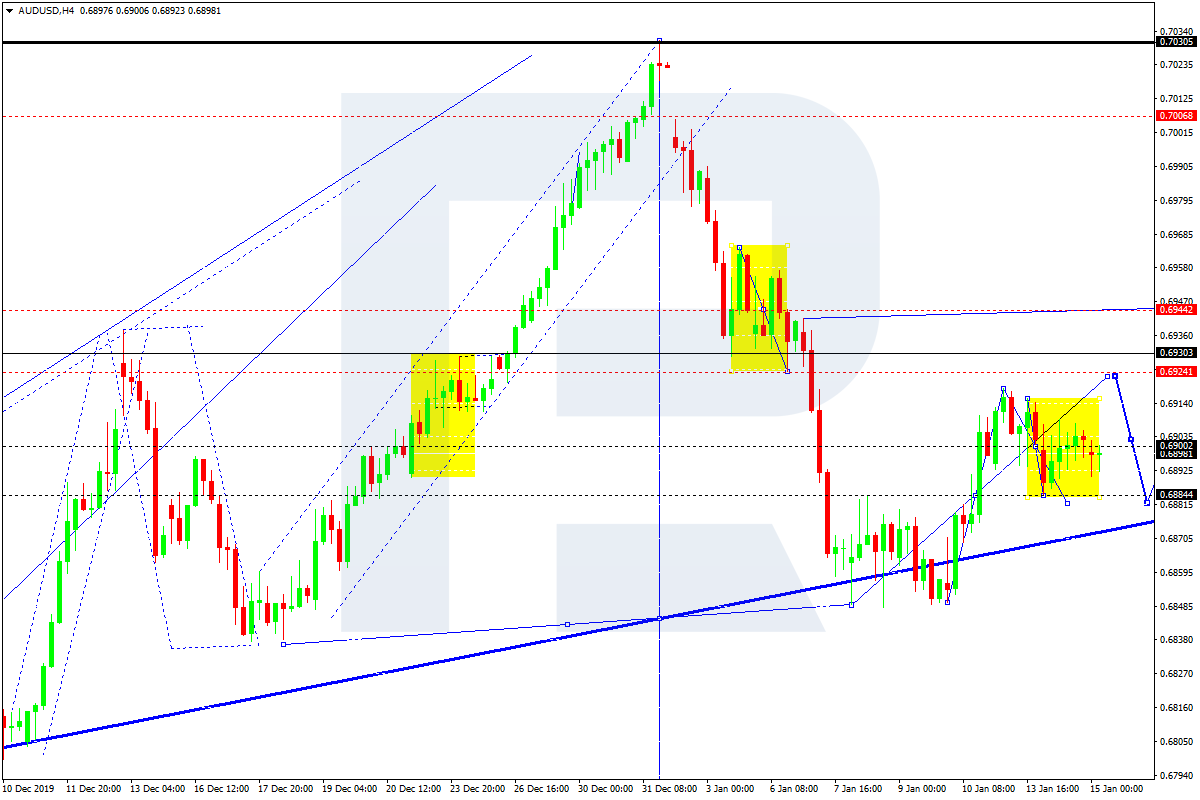
AUDUSD, “Australian Dollar vs US Dollar”
AUDUSD is still consolidating around 0.6900 without any particular direction. Today, the pair may expand the range down to 0.6884 and then resume trading upwards with the target at 0.6929.
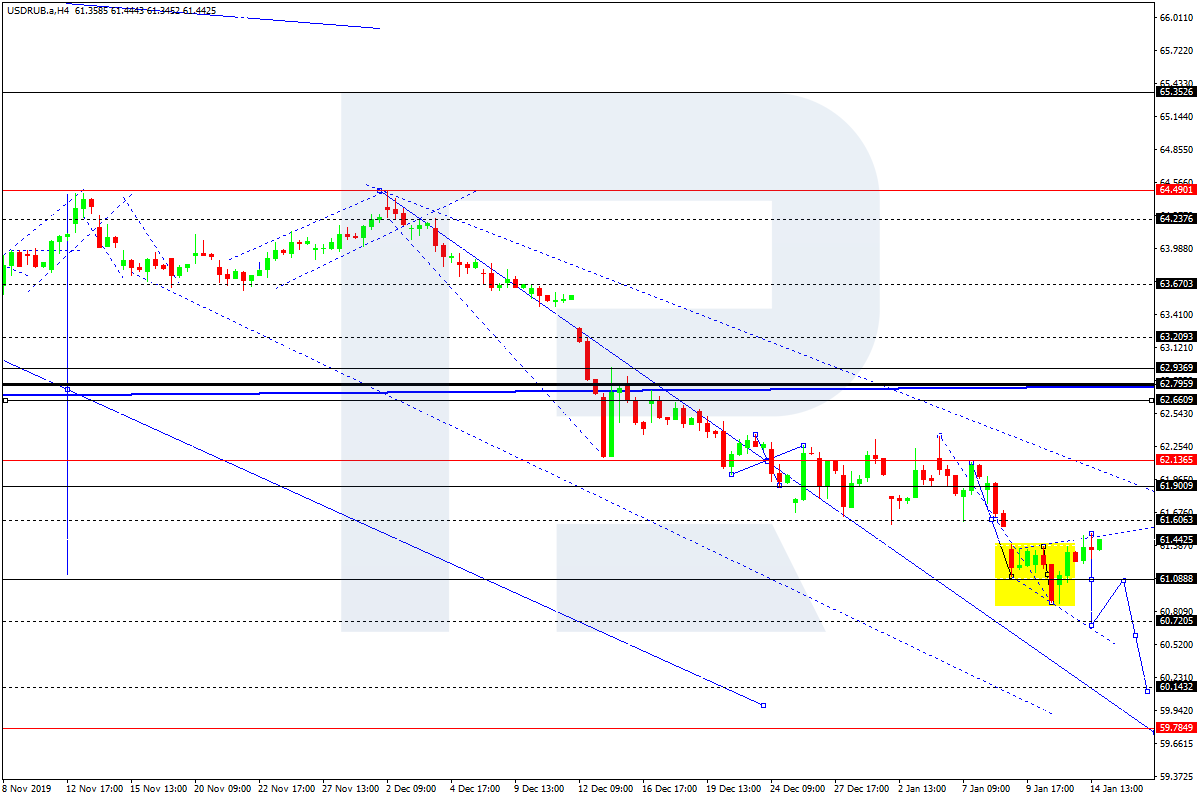
USDRUB, “US Dollar vs Russian Ruble”
USDRUB is still consolidating around 61.12. Today, the pair may expand the range down to 60.70 and then start another correction to reach 61.06. Later, the market may continue trading inside the downtrend towards 60.06.
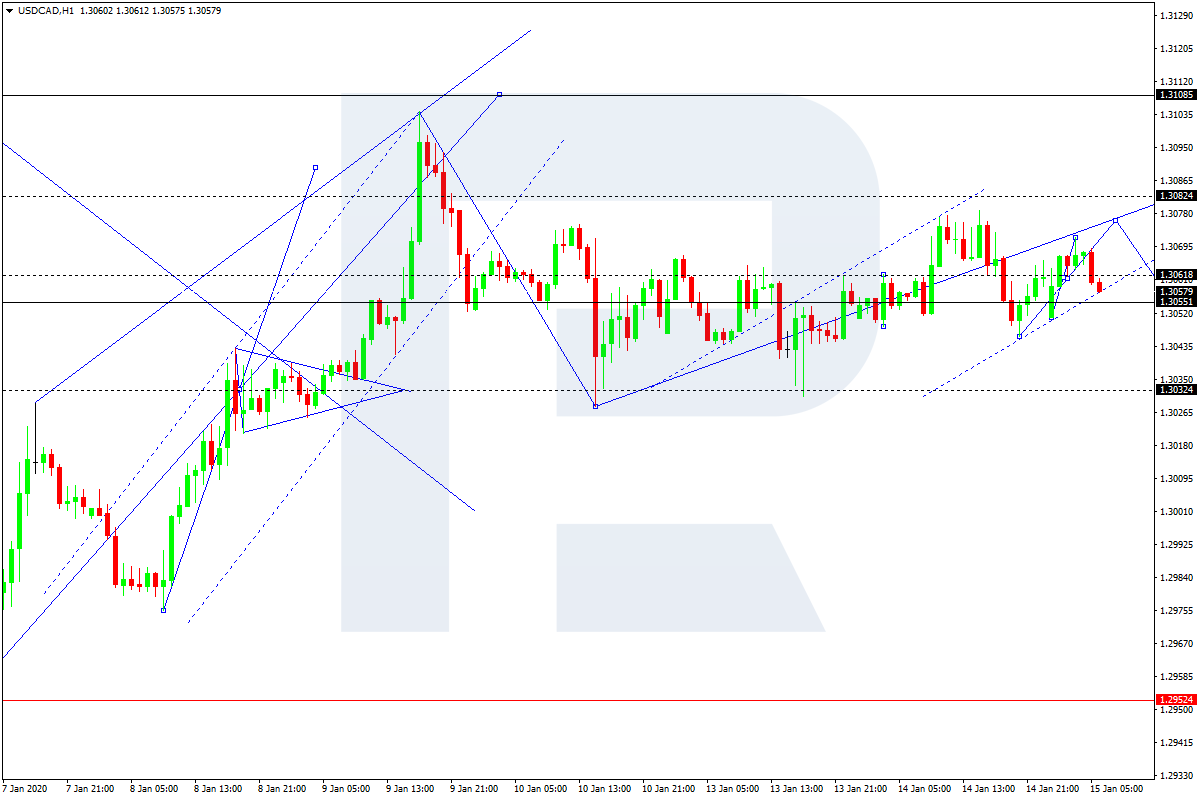
USDCAD, “US Dollar vs Canadian Dollar”
USDCAD continues consolidating around 1.3055 without any particular direction. Possibly, today the pair may form one more ascending structure towards 1.3080 and then resume falling to test 1.3055 from above. After that, the instrument may start a new growth with the target at 1.3100.
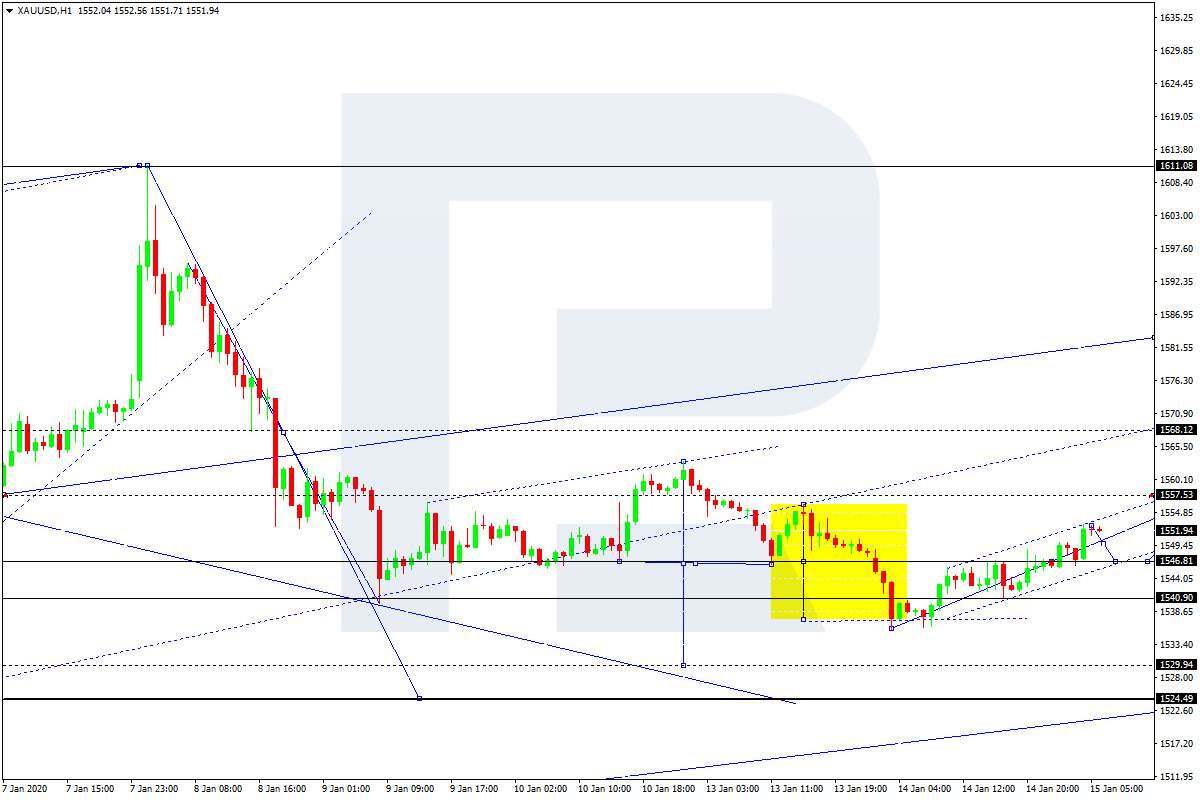
XAUUSD, “Gold vs US Dollar”
After breaking 1546.80 to the upside, Gold may choose an alternative scenario and extend the correction towards 1557.50. After that, the instrument may fall to break 1540.90 and then continue trading inside the downtrend with the target at 1524.50.
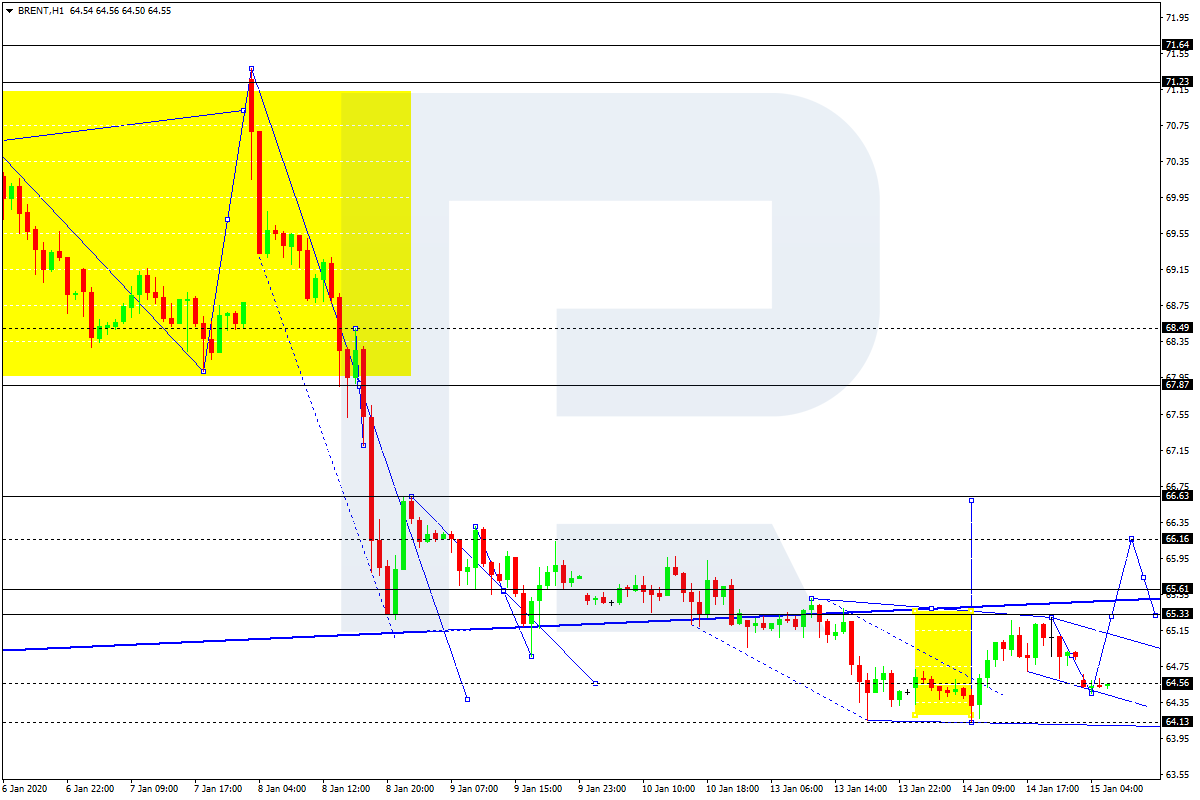
BRENT
Brent has completed the ascending impulse at 65.33 along with the correction towards 64.55. Possibly, today the pair may form one more ascending structure to reach 66.16 and then start a new correction to return to 65.33. After that, the instrument may resume trading inside the uptrend with the first target at 66.66.
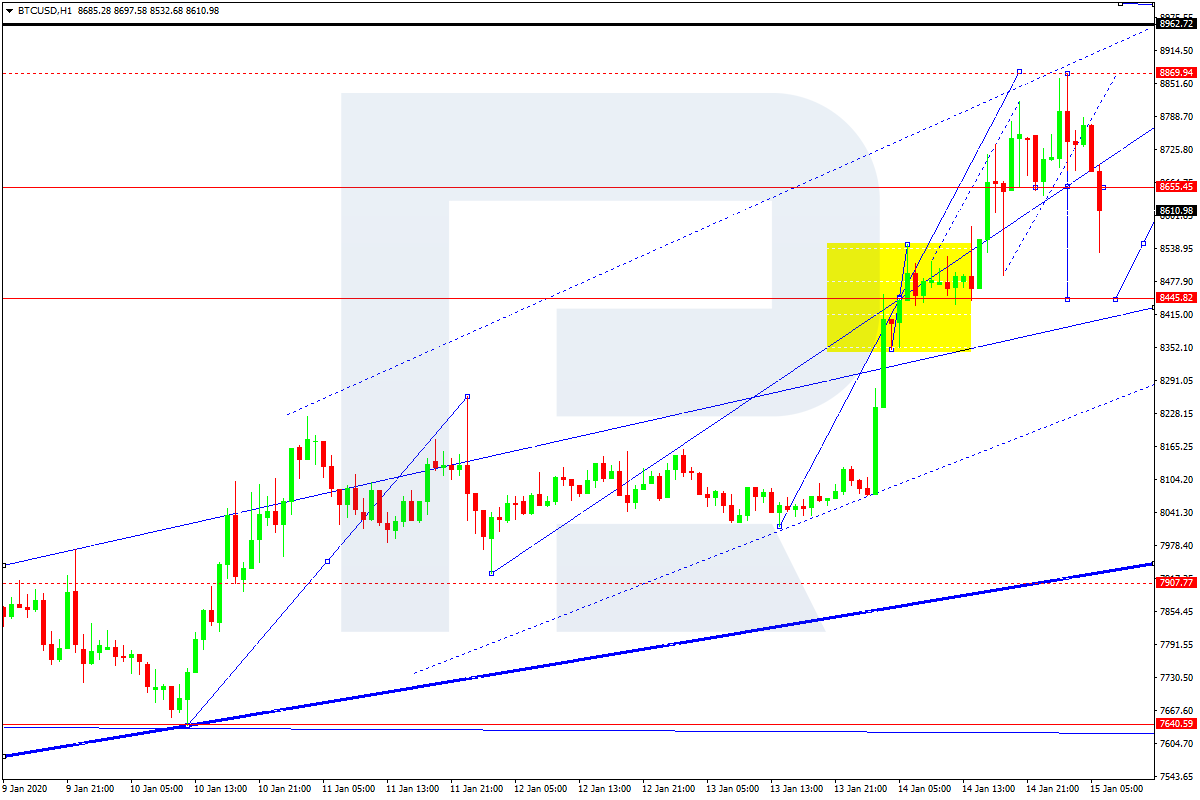
BTCUSD, “Bitcoin vs US Dollar”
BTCUSD is moving downwards to reach 8444.00. Possibly, the pair may reach this level and then form one more ascending structure towards 8660.00, thus forming a new consolidation range. If later the price breaks this range to the upside, the market may start another growth to reach 8960.00; it to the downside – continue the correction with the target at 7900.00.
Attention! Forecasts presented in this section only reflect the author’s private opinion and should not be considered as guidance for trading. RoboForex LP bears no responsibility for trading results based on trading recommendations described in these analytical reviews.
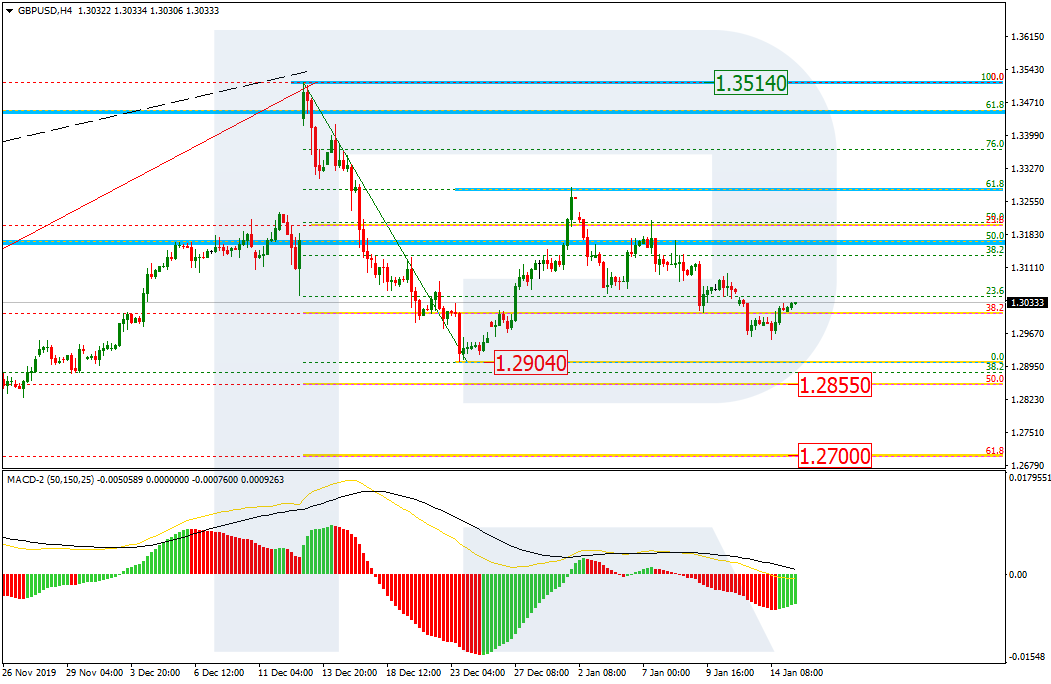
As we can see in the H4 chart, after completing the correctional uptrend at 61.8% fibo, GBPUSD is moving downwards. The closest downside target is the low at 1.2904. If later the price breaks this level, the instrument may start a proper descending wave towards 50.0% and 61.8% fibo at 1.2855 and 1.2700 respectively.
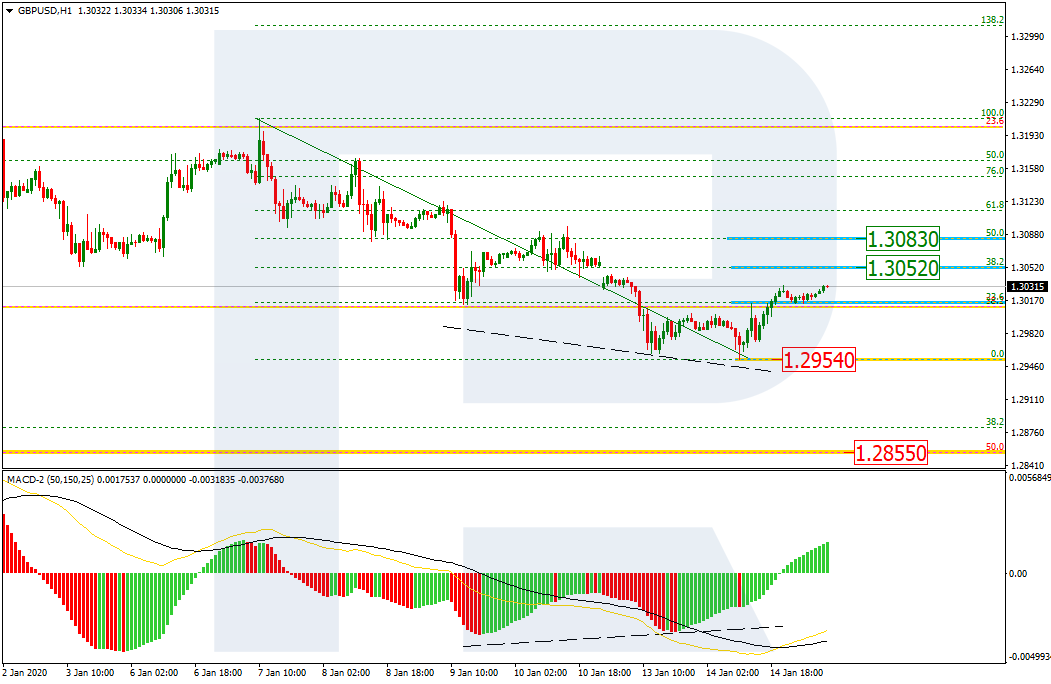
The H1 chart shows the convergence on MACD. As a result, right now the pair is starting a new short-term ascending correction towards 23.6% fibo. The next upside targets may be 38.2% and 50.0% fibo at 1.3052 and 1.3083 respectively.
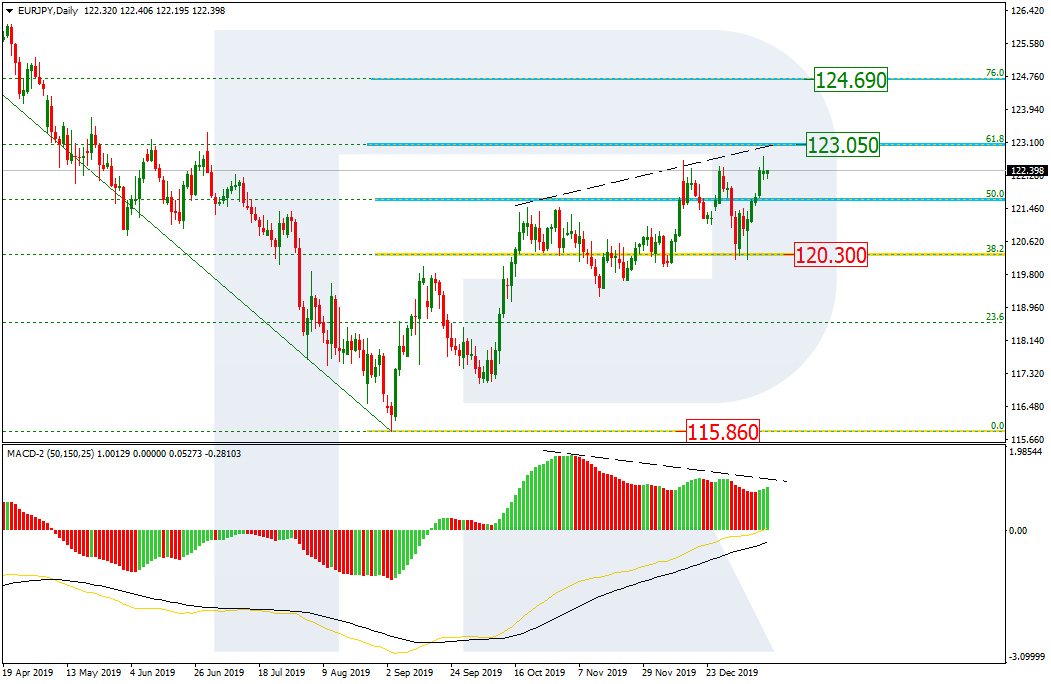
EURJPY, “Euro vs. Japanese Yen”
In the daily chart, after testing the support at 38.2% fibo and failing to fix there, EURJPY has updated the high. In the future, the instrument may continue trading upwards to reach 61.8% and 76.0% fibo at 123.05 and 124.69 respectively.
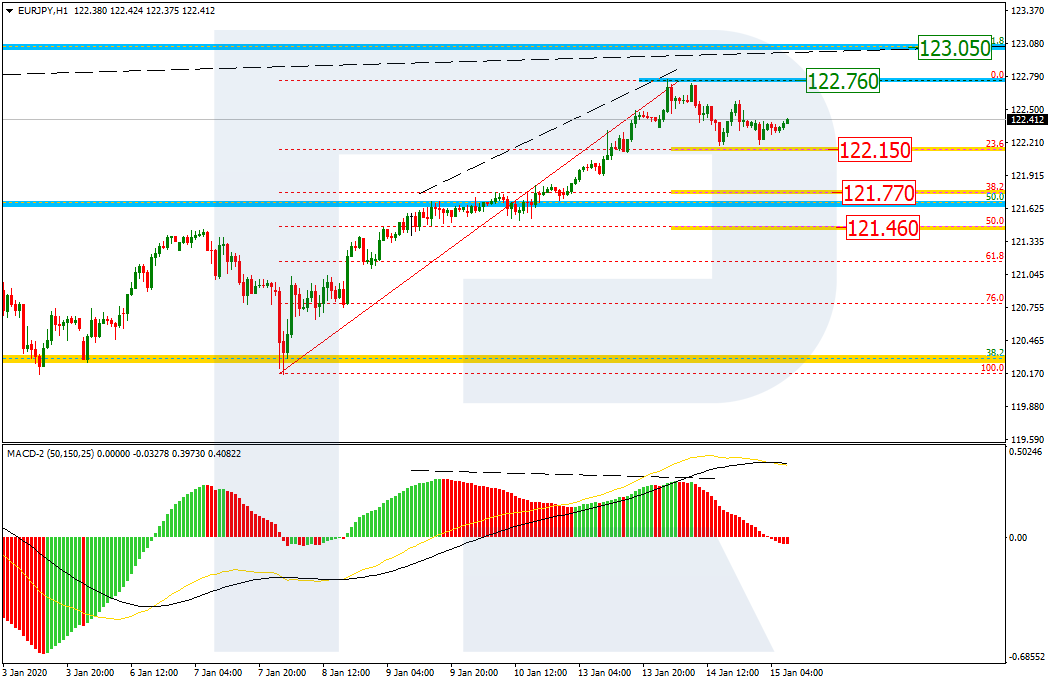
The H1 chart shows that the divergence made the pair start a new correction to the downside. The targets may be 23.6%, 38.2%, and 50.0% fibo at 122.15, 121.77, and 121.46 respectively. If the price breaks the resistance at 122.76, the mid-term growth will continue.
Attention! Forecasts presented in this section only reflect the author’s private opinion and should not be considered as guidance for trading. RoboForex LP bears no responsibility for trading results based on trading recommendations described in these analytical reviews.
By TheTechnicalTraders.com– This, the second part of our Silver research article suggesting Silver may be forming a massive price base in preparation for an explosive upside move, will continue from Part I of this research series.
Our research team believes Silver is setting up in a price pattern that may already be “ripe” for an explosive upside move. Our researchers have poured over the data and believe the disparity between Gold and Silver is already at excessive levels.
Historically, anytime the disparity between Gold prices and Silver prices (rationalized into comparative Gold price levels) breaches 30% to 60% and Gold begins an upside price advance, Silver typically begins to move higher with 4 to 8+ months. This setup pushes the Gold to Silver ratio back below 50 or 60 as Silver rallies substantially higher, and faster than the price of Gold.
Comparatively, Silver continues to trade within a sideways price range after basing in early 2016. This price range has been fairly consistent between $14.50 and $21.0. With Gold recently starting to move higher because of the US/Iran military conflict, this raises an early warning flag for our research team because Silver has continued to trade below $18 – and well below recent highs near $20.
The price disparity between Gold and Silver is currently greater than 200% based on our proprietary modeling system. Remember, anytime this disparity level is greater than 30% to 60% and Gold breaks out in a rally, Silver will break to the upside within just a few months.
The second stage rally in Silver, the real money-maker, will come when investors pile into Silver and Silver Miners as the breakout in Silver becomes explosive. The time to get into this trade is/was now or 4 months ago. Still, there is plenty of opportunity for skilled traders right now because the breakout move in Silver and Silver Miners has not really begun yet.
The first big upside move in Silver and Miners will be to attempt to move higher and target recent resistance. Resistance in Silver is currently near $19.70 and $21.00. This means any move above $19.75 (or higher) where the price of Silver fails to move above $22 or $23 would constitute a “Stage 1 Base Advancement”.
After this move is complete, a “Breakout Stage” price move will take place. This may be where Silver prices advance from the $21 to $23 level up towards the $28 to $32 price level. This upside price advance breaches the Stage 1 resistance and attempts to establish new support for a continued Stage 2 advance.
Remember, the current disparity level is just over 200% between Gold and Silver. If Gold continues to rally higher and Silver attempts to break higher, attempting to narrow the disparity level, then Silver will (at some point) enter a near parabolic upside price move above $36 to $40. Our researchers believe this may happen before June or July 2020.
This incredible opportunity is currently setting up for skilled traders. Believe it or not, while Silver continues to trade below $18 per ounce and global investors are focusing on US stocks, Emerging Markets, and Gold, Palladium and others, this setup in Silver may become the biggest investment opportunity of 2020. Sure, Gold may rally 80% to 140% over the next 12 to 24 months. Palladium may rally even higher. If Silver does what we expect it to do once this setup/trigger really breaks open, Silver could rally 500%+ over 12 to 24+ months on an incredible upside disparity reversion move.
This last chart highlights why we believe this setup in Silver should not be ignored. In 2005, the rally in Silver as a result of this Disparity trigger resulted in Silver reaching a 38% higher peak than Gold. In 2009, the same Disparity trigger prompted Silver to rally to levels nearly 300% higher than the peak in Gold prices. If Gold rallies to levels above $2800 to $3100, which is our expectation, and this Disparity trigger prompts an upside move in Silver, we believe Silver could rally to levels 200% to 400% (or more) higher than Gold prices. By our estimates, that would put Silver prices above $90 to $95 per ounce – possibly much higher.
Take advantage of any opportunity you have to position your portfolio for this setup and be patient. The upside breakout in Silver happens like a train leaving the station. Slow and steady at first, then building momentum, then finally running at top speed. Each time this Disparity trigger sets up and executes, Silver starts a moderate move higher at first, then explodes to the upside as Gold continues to rally higher. That last explosive move is why Silver reaches peaks that are substantially higher (in percentage terms) than the peaks in Gold.
Please pay attention to our research team’s efforts to help you create greater success and find great trades. Take a minute to visit Technical Traders Ltd. to learn how we can assist you in 2020 and help you build wealth, attain greater success and stay ahead of these bigger market moves.
As a technical analysis and trader since 1997 I have been through a few bull/bear market cycles, I have a good pulse on the market and timing key turning points for both short-term swing trading and long-term investment capital. The opportunities are massive/life-changing if handled properly.
Join my Wealth Building Newsletter if you like what you read here and ride my coattails as I navigate these financial markets and build wealth while others lose nearly everything they own.
NOTICE: Our free research does not constitute a trade recommendation, or solicitation for our readers to take any action regarding this research. It is provided for educational purposes only. Our research team produces these research articles to share information with our followers/readers in an effort to try to keep you well informed. Visit our web site (www.thetechnicaltraders.com) to learn how to take advantage of our members-only research and trading signals.
During yesterday’s trading session, the US dollar remained unchanged relative to the basket of major currencies. The dollar index (#DX) closed yesterday in the green zone (+0.04%). Investors have taken a wait-and-see attitude before concluding a deal between the US and China. According to media reports, the US duties on Chinese goods are likely to stay unchanged until the US presidential election. Their reduction or cancellation will depend on Beijing complying with the terms of the phase-one trade deal. US President Donald Trump and China’s Vice Premier Liu He, who is in Washington, are planning to sign the phase-one deal of the settlement of the trade dispute between the two countries today. 10 months after the signing of the agreement, the United States will study the progress made by China and may consider reducing or cancelling duties.
The British pound strengthened after statements by Prime Minister Boris Johnson. The official said that before the end of the year Britain is likely to conclude a comprehensive trade deal with the EU.
The “black gold” prices are declining. Currently, futures for the WTI crude oil are testing the $58.10 mark per barrel. At 17:30 (GMT+2:00), US crude oil inventories will be published.
Market Indicators
Yesterday, there was a variety of trends in the US stock market: #SPY (-0.15%), #DIA (+0.07%), #QQQ (-0.39%).
The 10-year US government bonds yield has declined. At the moment, the indicator is at the level of 1.79-1.80%.
The Economic News Feed for 15.01.2020:
– Consumer price index in the UK at 11:30 (GMT+2:00);
– Producer price index in the US at 15:30 (GMT+2:00);