Driven by the latest developments in the Middle East, Gold initially profited from the resulting risk-off mode, seeing a short-term push above 1,600 USD, which stabilised after no further escalation took place and US president Trump de-escalating the situation last week on Wednesday at his press conference.
While the precious metal is currently stable around its 2019 yearly highs of 1,550 USD, and a deeper corrective move down to 1,520 being an option, the overall picture for Gold stays positive.
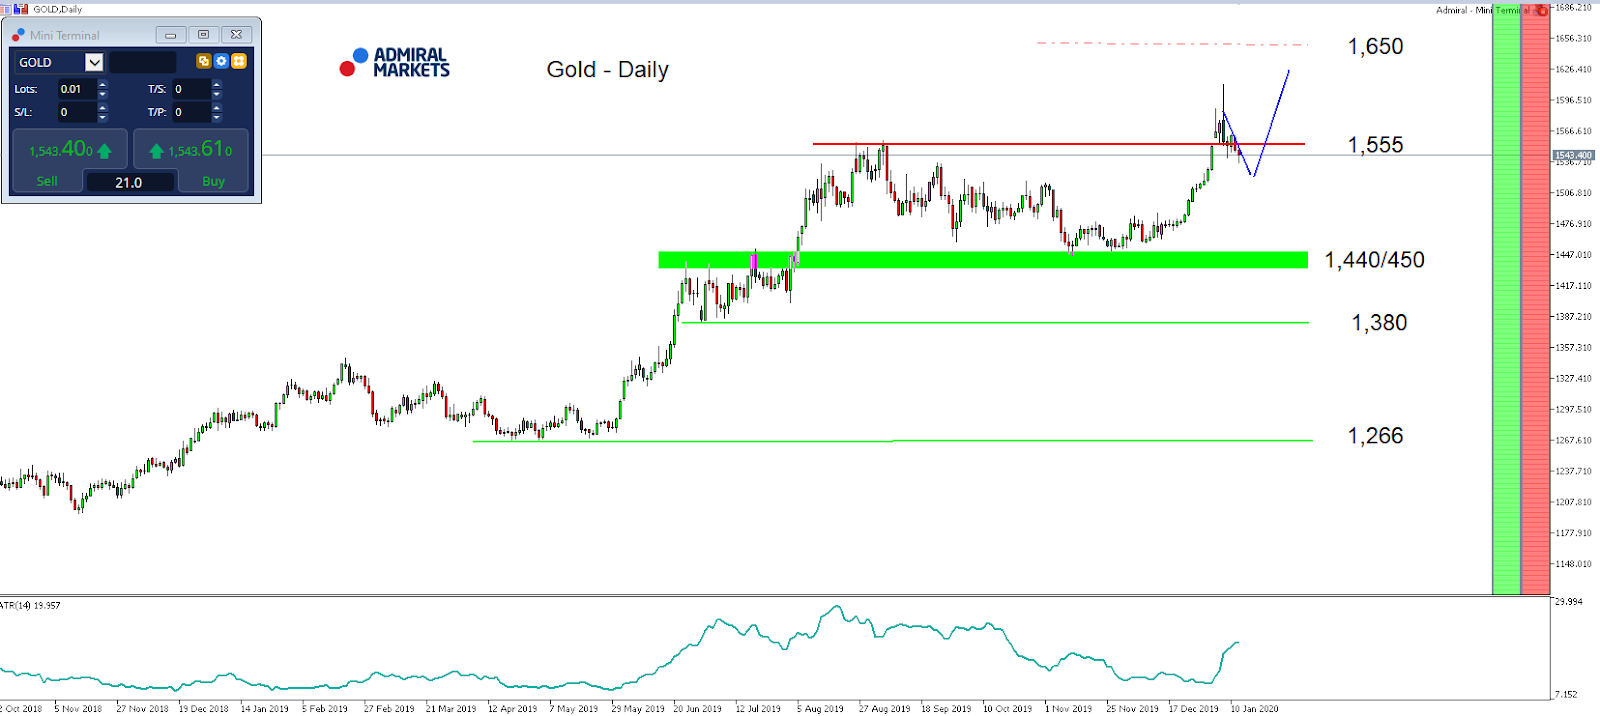
Technically, on a daily time-frame Gold stays bullish as long as we trade above 1,440/450 USD, but also fundamentally the picture stays Gold positive.
This is especially true after the mixed US economic data over the last week, with yesterday’s US inflation coming in at 2.3% year-on-year in December 2019 at the highest level since October 2018 and with 10-year US-Treasury yields stabilising below 2%.
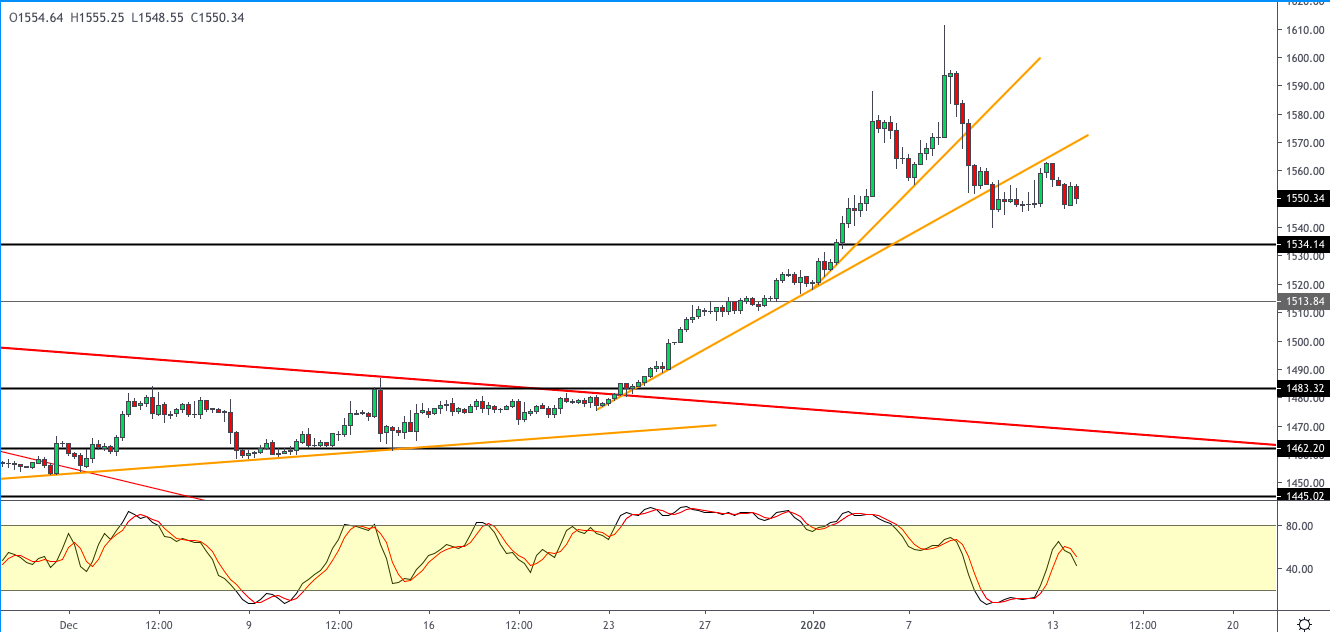
If tomorrow’s US Retail Sales disappoints as well, and comes in below expectations, Gold could take on bullish momentum again and make itself on the way up to the potential next target on the upside around 1,650/700 USD:
Source: Admiral Markets MT5 with MT5-SE Add-on Gold Daily chart (between October 12, 2018, to January 14, 2020). Accessed: January 14, 2020, at 10:00pm GMT – Please note: Past performance is not a reliable indicator of future results, or future performance.
In 2015, the value of Gold fell by 10.4%, in 2016, it increased by 8.1%, in 2017, it increased by 13.1%, in 2018, it fell by 1.6%, in 2019, it increased by 18.9%, meaning that after five years, it was up by 28%.
Discover the world’s #1 multi-asset platform
Admiral Markets offers professional traders the ability to trade with a custom, upgraded version of MetaTrader 5, allowing you to experience trading at a significantly higher, more rewarding level. Experience benefits such as the addition of the Market Heat Map, so you can compare various currency pairs to see which ones might be lucrative investments, access real-time trading data, and so much more. Click the banner below to start your FREE download of MT5 Supreme Edition!
Disclaimer: The given data provides additional information regarding all analysis, estimates, prognosis, forecasts or other similar assessments or information (hereinafter “Analysis”) published on the website of Admiral Markets. Before making any investment decisions please pay close attention to the following:
This is a marketing communication. The analysis is published for informative purposes only and are in no way to be construed as investment advice or recommendation. It has not been prepared in accordance with legal requirements designed to promote the independence of investment research, and that it is not subject to any prohibition on dealing ahead of the dissemination of investment research.
Any investment decision is made by each client alone whereas Admiral Markets shall not be responsible for any loss or damage arising from any such decision, whether or not based on the Analysis.
Each of the Analysis is prepared by an independent analyst (Jens Klatt, Professional Trader and Analyst, hereinafter “Author”) based on the Author’s personal estimations.
To ensure that the interests of the clients would be protected and objectivity of the Analysis would not be damaged Admiral Markets has established relevant internal procedures for prevention and management of conflicts of interest.
Whilst every reasonable effort is taken to ensure that all sources of the Analysis are reliable and that all information is presented, as much as possible, in an understandable, timely, precise and complete manner, Admiral Markets does not guarantee the accuracy or completeness of any information contained within the Analysis. The presented figures refer that refer to any past performance is not a reliable indicator of future results.
The contents of the Analysis should not be construed as an express or implied promise, guarantee or implication by Admiral Markets that the client shall profit from the strategies therein or that losses in connection therewith may or shall be limited.
Any kind of previous or modeled performance of financial instruments indicated within the Publication should not be construed as an express or implied promise, guarantee or implication by Admiral Markets for any future performance. The value of the financial instrument may both increase and decrease and the preservation of the asset value is not guaranteed.
The projections included in the Analysis may be subject to additional fees, taxes or other charges, depending on the subject of the Publication. The price list applicable to the services provided by Admiral Markets is publicly available from the website of Admiral Markets.
Leveraged products (including contracts for difference) are speculative in nature and may result in losses or profit. Before you start trading, you should make sure that you understand all the risks.
On Tuesday, January 14, the euro finished up slightly down at the end of the day’s trading. After the publication data concerning the inflation rate in the United States, the EURUSD pair fell to 1.1105.
In December, the Consumer Price Index (CPI) in the United States rose 0.2% (MoM) and 2.3% (YoY). The forecast was 0.2% (MoM) and 2.4% (YoY,) and the previous recorded values were 0.3% (MoM) and 2.1% (YoY). The annual growth of CPI fell short of forecasted figures, but exceeded the previous results with CPI at its highest since October 2018.
However, the reaction to the publication of the Index was short-lived, since market players have their eyes firmly fixed on the long-awaited signing of the first part of the US-China trade agreement.
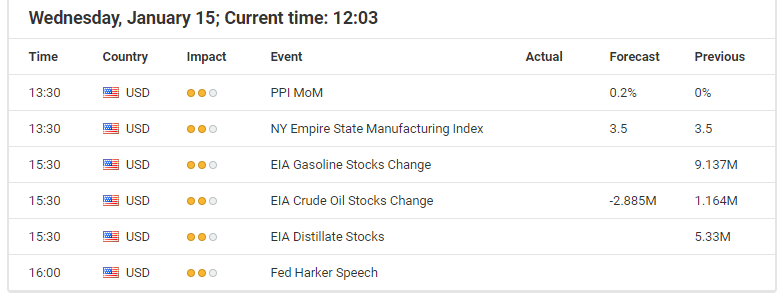
Today’s events (GMT+3):
12:30 UK: Consumer Price Index (MoM) (Dec), Retail Price Index (MoM) (Dec), PPI Core Output (YoY) n.s.a (Dec), Core Consumer Price Index (YoY) (Dec), Producer Price Index – Output (MoM) n.s.a (Dec).
16:30 USA: NY Empire State Manufacturing Index (Jan), Producer Price Index ex Food & Energy (YoY) (Dec).
18:30 USA: EIA Crude Oil Stocks Change (Jan 10).
22:00 USA: Fed’s Beige Book.
Current situation:
For the past two days in-a-row, forecasts have been strongly influenced by the regular influx of important market and political news. The current corrective wave pattern is complex. Yesterday, a false breakout of the trend line was recorded. Today, bulls again broke the trend line (which sits at 1.1134). A breakout is highly unlikely to occur today, since at 19:00 Moscow time, representatives of the United States and China intend to hold an official ceremony where the first part of the trade agreement between the countries shall be signed. This is an important event for traders, but has already been taken into account, according to market activity.
US Treasury Secretary Steven Mnuchin said that current customs tariffs on Chinese goods will remain in effect until an agreement is reached regarding the second part of the trade agreement. We are yet to understand all of the details, but it seems that China could well be in a losing situation here.
It’s also worth mentioning that as part of the first stage of the trade deal, China has pledged to buy additional industrial goods from the United States totalling $80 billion (USD) over the next two years, and more than $50 billion (USD) worth of energy products.
Today, the official responses from the USA and China – once their agreement has been signed – will be of great interest. We could well see an ambiguous reaction to their comments on the markets; however, we are more inclined to predict a strengthening euro. The single currency could well reach 1.1164 (67th degree).
Asian stocks and currencies are mixed leading up to the long-awaited signing of the limited trade deal between the US and China, amid concerns that major differences are set to persist between the two economic giants. Hours before the trade deal is formalised, investors were met with headlines about potential plans by the US administration to block exports to Huawei, coupled with media reports that any further tariff relief affecting $360 billion worth of Chinese goods shipped to the US may only go into effect after the US Presidential elections in November.
With the optimism surrounding the US-China “phase one” trade deal largely priced in, risk assets may be triggered into a knee-jerk reversal if the released details from the signed trade deal underwhelm investors. Still, considering the diminished prospects of a tariff escalation between the US and China, the global economy is expected to enjoy some measure of relief in 2020 after having weathered heightened trade tensions over the past two years. Should the macro data over the coming months point to a meaningful recovery in economic conditions worldwide, that should encourage further upside for riskier assets, with emerging-market assets poised for gains under such risk-on circumstances.
Dollar sees diverging performance against G10 vs. Asian currencies
The US Dollar has seen a year-to-date decline against most Asian currencies, but has strengthened against all of its G10 peers so far in 2020. Although the Dollar index (DXY) remains above the psychological 97.0 handle at the time of writing, the DXY is still expected to ease over the coming months, having posted lower highs and lower lows since October, as investors with heartier risk appetites expand their reach into the markets.
Over the near-term, a better-than-expected print in the December US retail sales figures should also buffer the DXY’s presence above the 97.0 mark, as consumers Stateside continue propping up the economic growth momentum. Further support for the Dollar index may be derived from the waning Pound, amid rising expectations that the Bank of England could lower interest rates this quarter.
Commodities check: Gold, Oil to see contrasting fortunes as global economy recovers
Gold prices have come off overbought levels and are finding a more sustainable footing around the mid-$1500s for the time being, with investors eager for details surrounding the expected rollback in tariffs. Bullion is expected to ease further as long as risk-taking activities can continue in the markets unperturbed while the global economy attempts to take advantage of thawing US-China trade tensions.
Brent is finding its immediate support at $64/bbl, with concerns over the US-Iran conflict now phased out and with investors having mostly priced in the US-China “phase one” trade deal signing. However, key details from the agreement that could significantly alter the outlook on global demand may yet hold sway over Oil’s performance, whereby further indications over the dismantling of tariffs could spell more upside for Oil prices.
Disclaimer: The content in this article comprises personal opinions and should not be construed as containing personal and/or other investment advice and/or an offer of and/or solicitation for any transactions in financial instruments and/or a guarantee and/or prediction of future performance. ForexTime (FXTM), its affiliates, agents, directors, officers or employees do not guarantee the accuracy, validity, timeliness or completeness, of any information or data made available and assume no liability as to any loss arising from any investment based on the same.
Technical analyst Clive Maund examines the effects of recent geopolitical events on the precious metals markets.
It has been a week of surprises since the last updates were posted. First, I had not expected Iran to retaliate following the murder of its top general by a U.S. dronebut it did, despite the risks, as it was politically necessary to assuage the extreme anger of its population who demanded revenge.
The next surprise was that Israel and the U.S. did not use this retaliation as an excuse to bomb Iran back to the Stone Age, which is what they really want to do. As we know, the long-term goal of Israel and the U.S. is to subjugate Iran, and they will not stop until they attain this goal.
And so it goes on. It appears that there was a bit of theater involved in Iran’s retaliation, as it clandestinely signaled its intentions which allowed U.S. forces to get out of harm’s way. Perhaps U.S. forces did not then launch a blitzkrieg out of consideration for this courtesy.
Regardless of the muddled and unpredictable fundamental situation, which included the accidental downing of a passenger plane by Iranian defensive missile batteries, the charts allowed us to make a reasonably accurate prediction regarding what was likely to happen to the gold price. The call for a near-term top in the precious metals (PM) sector made on the site on Monday looked incorrect the following evening, when gold suddenly surged about $35 on news of the retaliatory Iranian missile strike. But when it later became apparent that there were, strangely, no U.S. troop casualties and no further action against Iran, gold and silver reversed dramatically and dropped quite hard, as the tension then looked set to ease, at least over the short-term.
Technically what happened is that gold pushed quite deep into heavy overhead resistance, becoming very overbought at a time when COTs were showing extreme readings, and was thus vulnerable to a sudden reversal. The action around this time illustrates an important point, which is that when gold rises due to sudden geopolitical developments, the gains tend not to stick.
What really matters, and is the big driver for gold at this time, is the insane monetary expansion that is going on, which is being undertaken in a desperate attempt to postpone the systemic implosion that is baked in for as long as possible. As we have already observed in these updates in recent weeks, gold is already in a raging bull market against a wide variety of currencies, and it won’t be all that long before it’s in a raging bull market against the dollar too, as the Fed sets the stage for hyperinflation.
There are two big and compelling reasons for the U.S. government to tank the dollar. One is that it makes U.S. exporters more competitive, and the other is that it can use the mechanism of inflation to wipe clean its colossal debts by paying them off in devalued coin, printing vast amounts of money to pay them off, and in the process legally swindling the foolish creditors out of their dues.
This is precisely what the Weimar Republic in Germany did in 1923 to eliminate the unfair reparations imposed by the Treaty of Versailles, which were unfair also because Germany didn’t start the First World Warit was tricked into it by the Allies, because the British Empire was scared of Germany’s rising industrial and military might and wanted to destroy it. . .100-plus years of propaganda lies about Germany being responsible for the First World War notwithstanding.
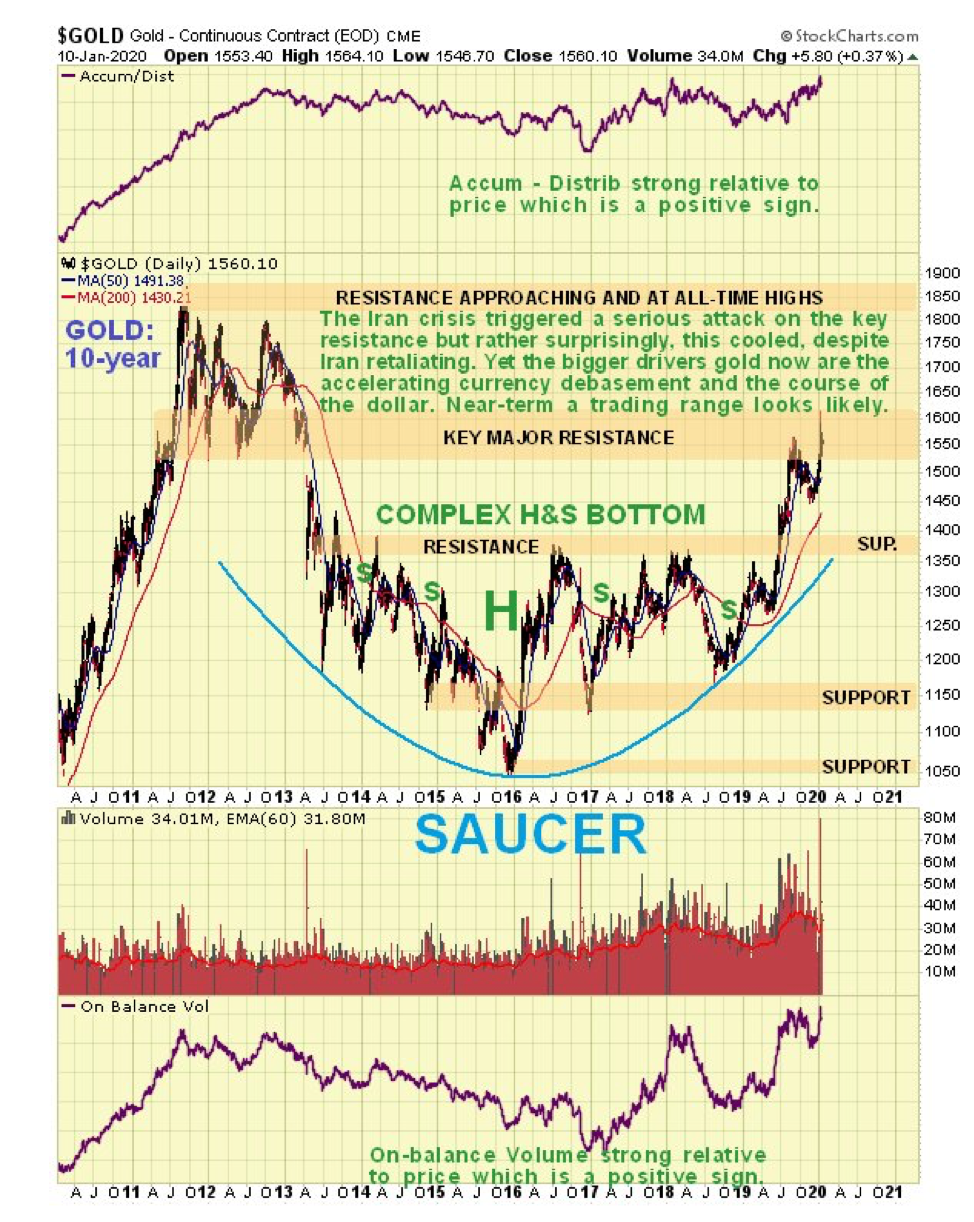
We’ll look at the dollar a little later. First we will review gold’s charts, starting with the 10-year chart.
On the 10-year chart we see that gold is now a bull market, even against the dollar, and is currently challenging the heavy resistance arising from the 20112013 top area. The second attack on this resistance in the space of few months got further because of the Iran crisis. If this cools any more short term, it will probably lead to gold settling into a trading range before it mounts a more successful attack on this resistance.
A point to note here is that while the resistance up to the 2011 highs, in the $1,800 area, looks like a major obstacle, it’s not such a big deal as many think, given the rate at which the dollar is now being debased.
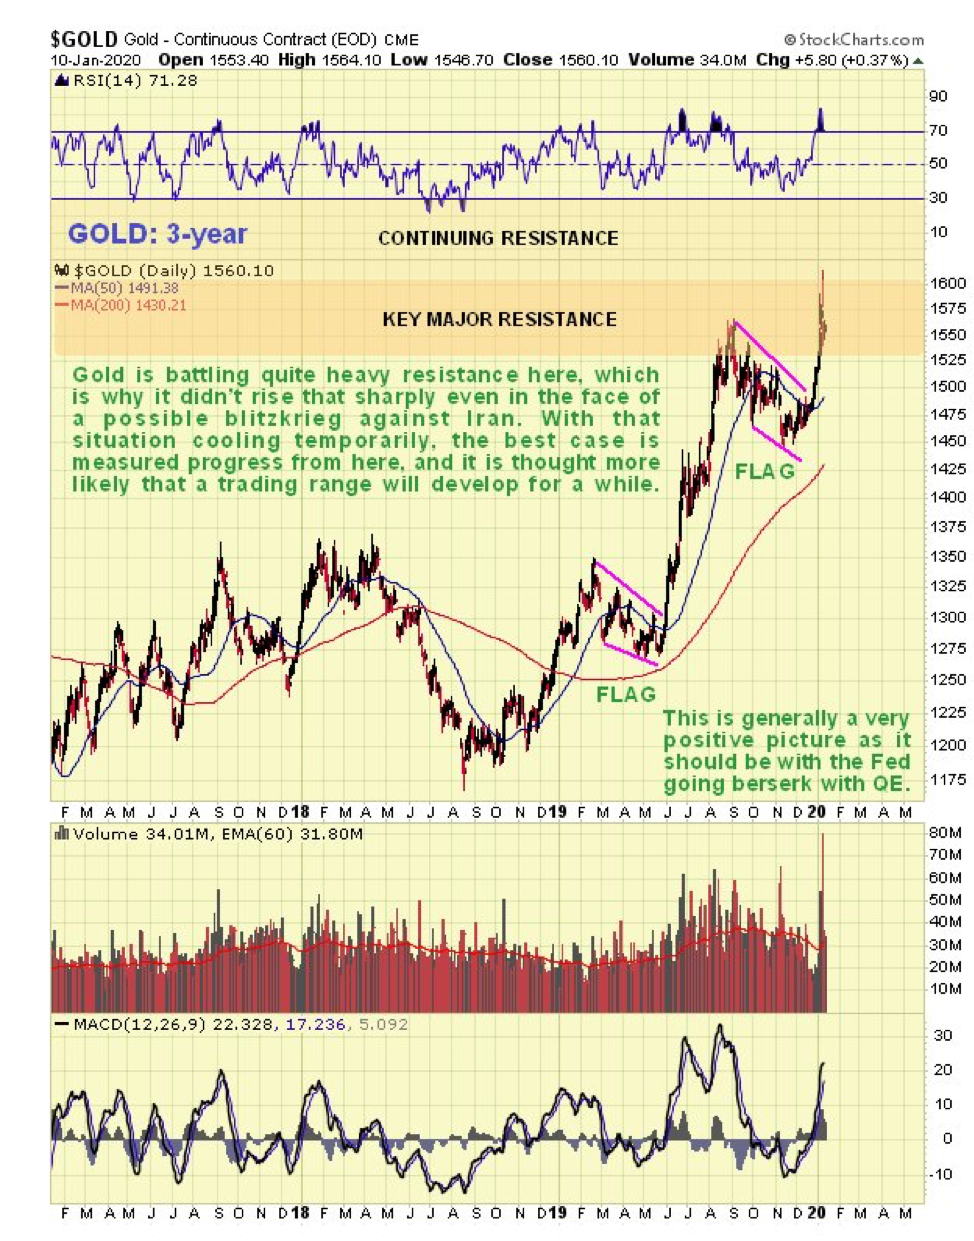
This week it’s worth also taking a quick look at a 3-year chart for added perspective. This chart shows us that since the bull market started in midsummer, we have seen three sharp run-ups punctuated by two bull flags. While the second of these flags targets the $1,800 area, we have to factor in that gold now has much more overhanging supply to contend with than on the first run-up. This, coupled with quite extreme COT readings, inclines to the view that this will need to be worked off. Hence, the interpretation that it will probably need to consolidate for a while before it makes significant further progressalthough it obviously won’t if the U.S. starts a serious bombing campaign against Iran. The Fed’s increasingly manic money printing will eventually drive it higher, of course.
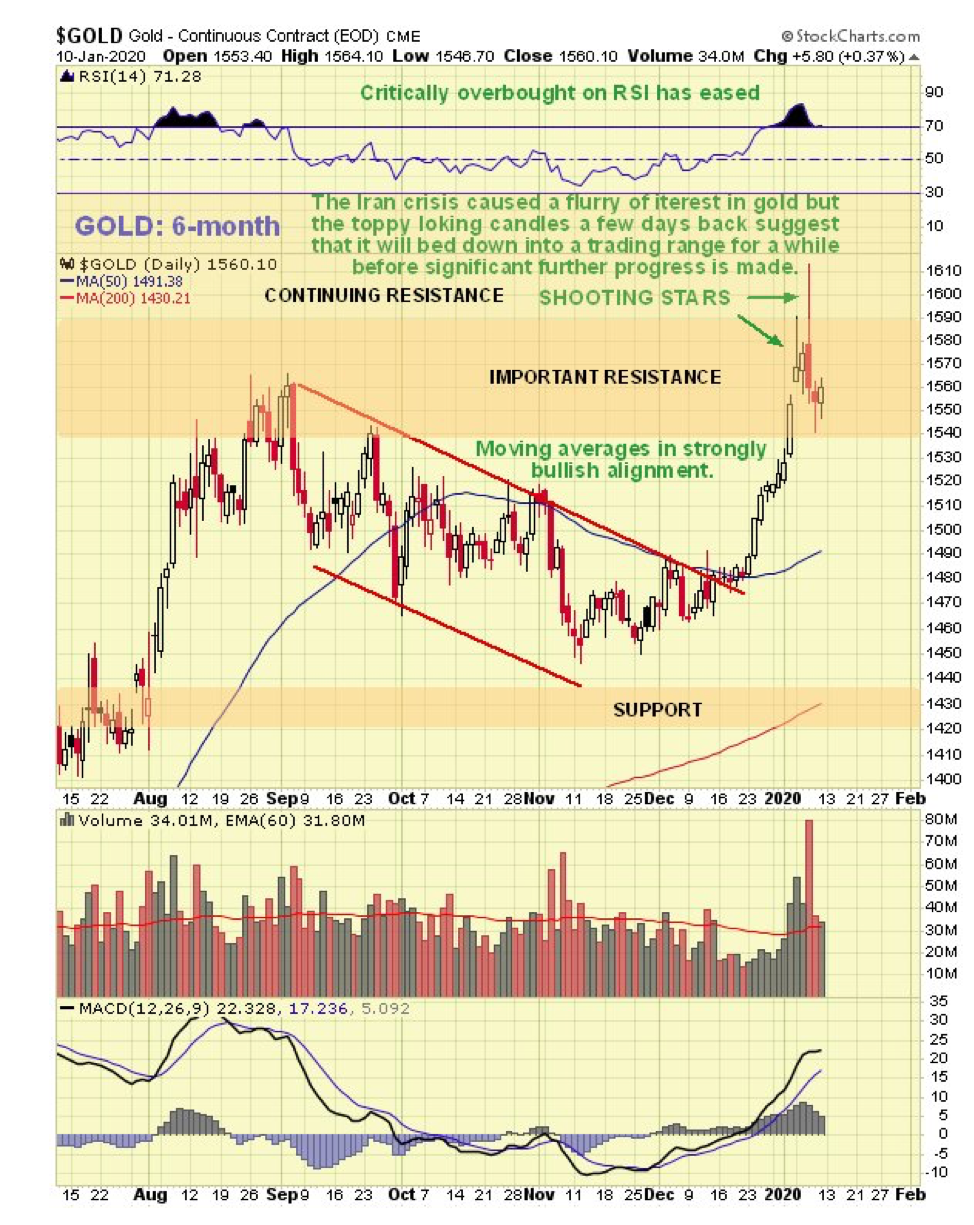
On the 6-month chart we can see the interesting price action around the Iran crisis over the past week or so. A bearish “shooting star” appeared on the chart last Monday, which we took as a sign that gold was forming a short-term top. But then, overnight on Jan. 78, it surged briefly above $1,610when Iran lobbed missiles at U.S. bases in Iraqwhich had many concluding, not unnaturally that this would trigger a major IsraelUS bombing campaign.
When it became apparent that there were no casualties from the Iranian attack and no U.S. counter-strike, tensions quickly cooled, and gold lost ground fast the next day, putting in a big high-volume reversal candle, approximating to another shooting star. Normally such action is followed by a retreat, at least for a while, and some stocks, like silver stock Coeur Mining Inc. (CDE:NYSE), which we ditched a while ago, got clobbered. This is why gold is expected to settle down into a trading range for a while, before mounting another attack on the resistance.
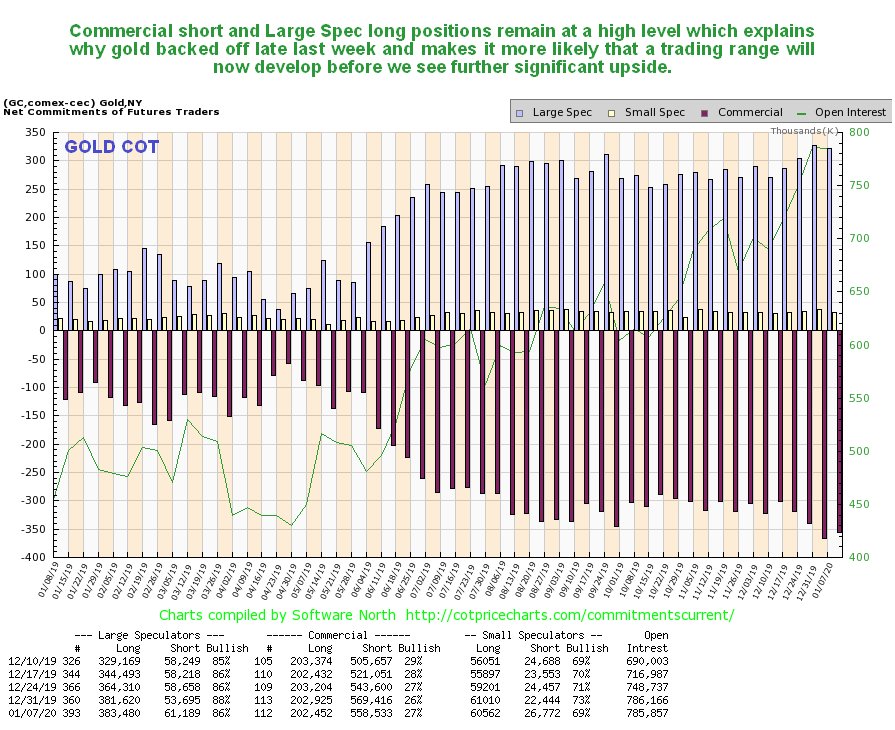
Another factor suggesting that gold will consolidate/react back for a while is the latest COT, which shows still very high Commercial short and Large Spec long positions.
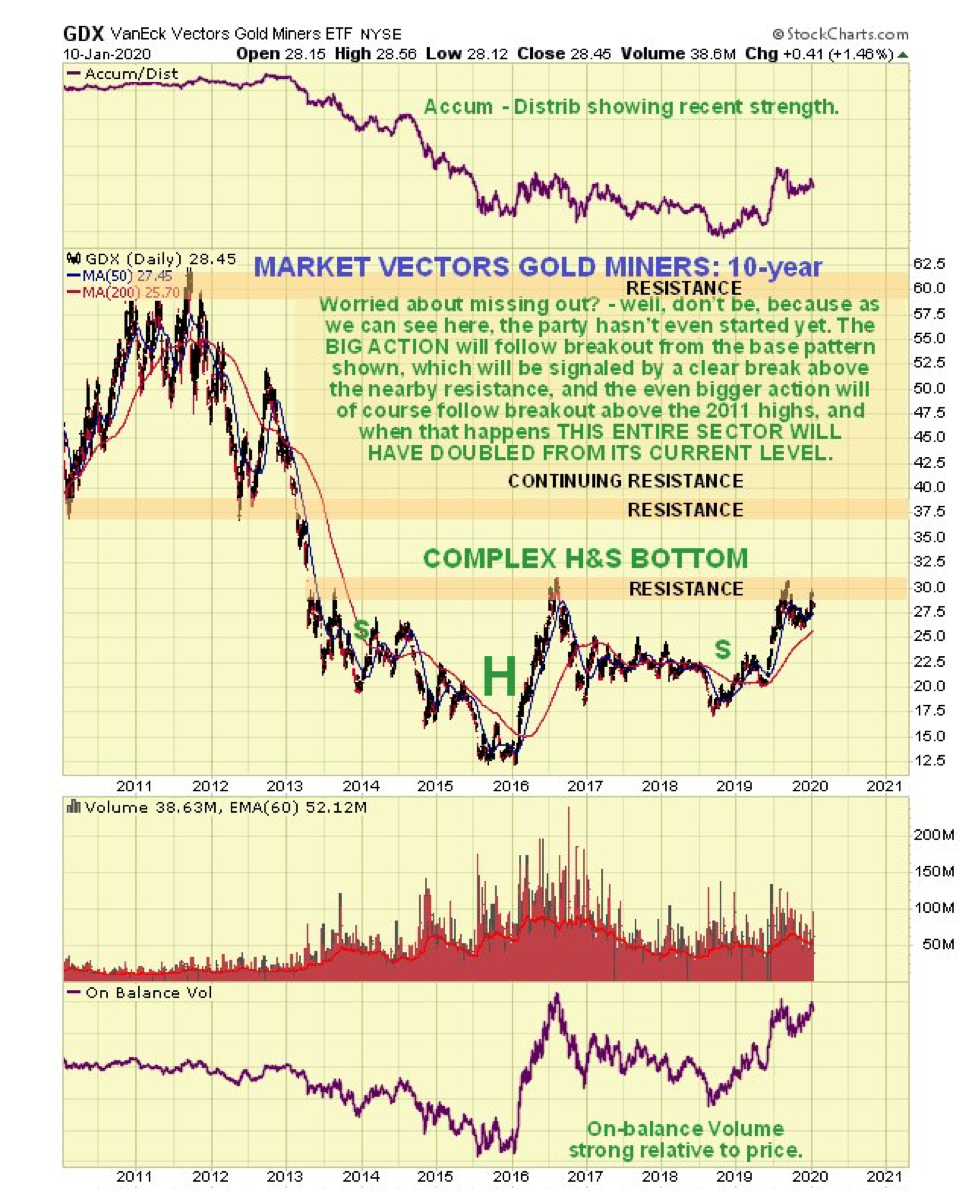
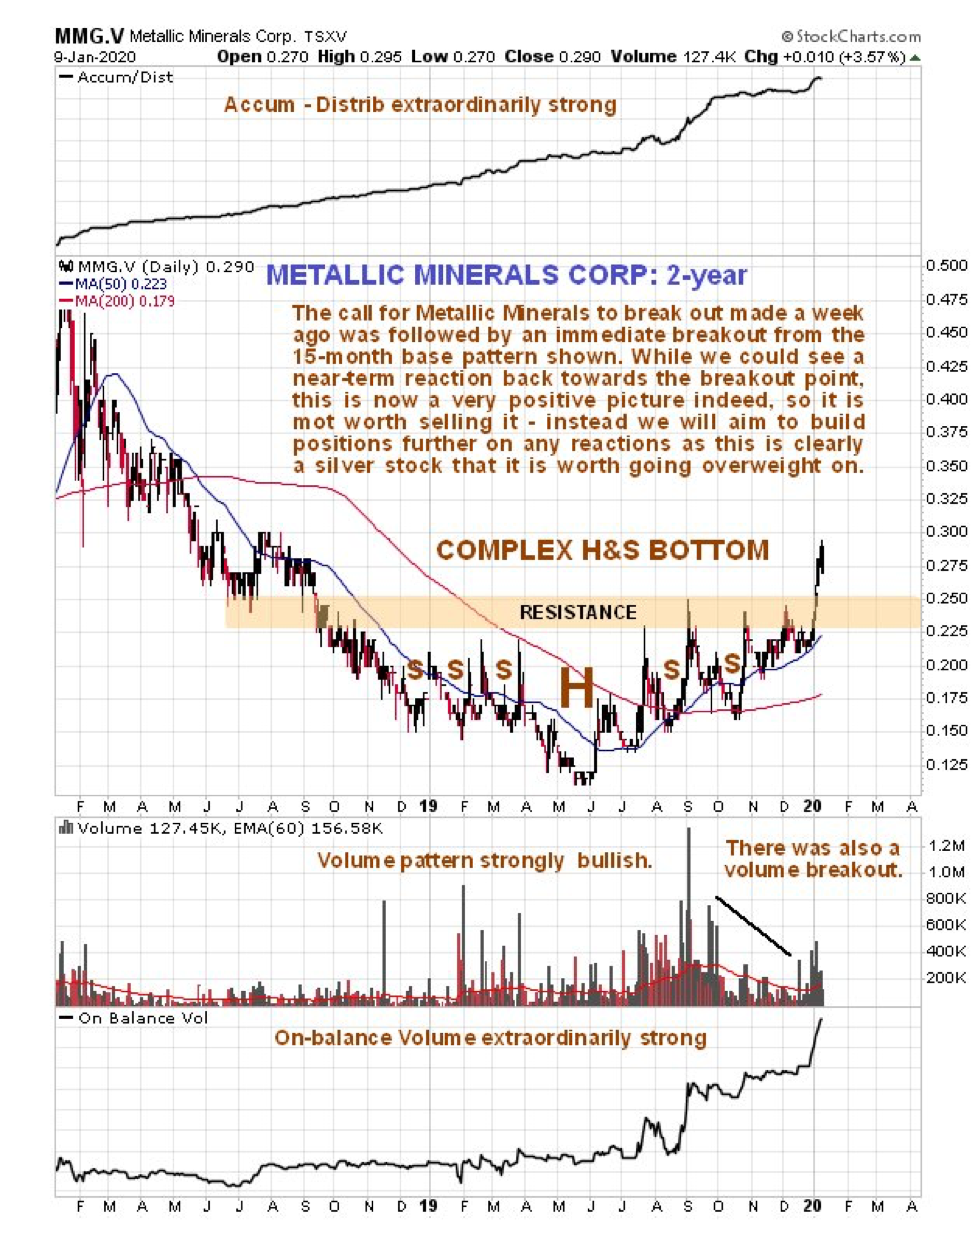
What about precious metals stocks? The latest 10-year chart for GDX shows that we still have most everything to look forward to. Despite the rally from the middle of last year, it still hasn’t broken out of the giant complex head-and-shoulders bottom that has formed since way back early in 2013. A breakout above the nearby resistance should lead to a rapid ascent to the next resistance level at the underside of a large top pattern, and thereafter it will have to work its way through continuing resistance up to its highs. The strength of the volume indicators in the recent past are a sign that it “means business.”
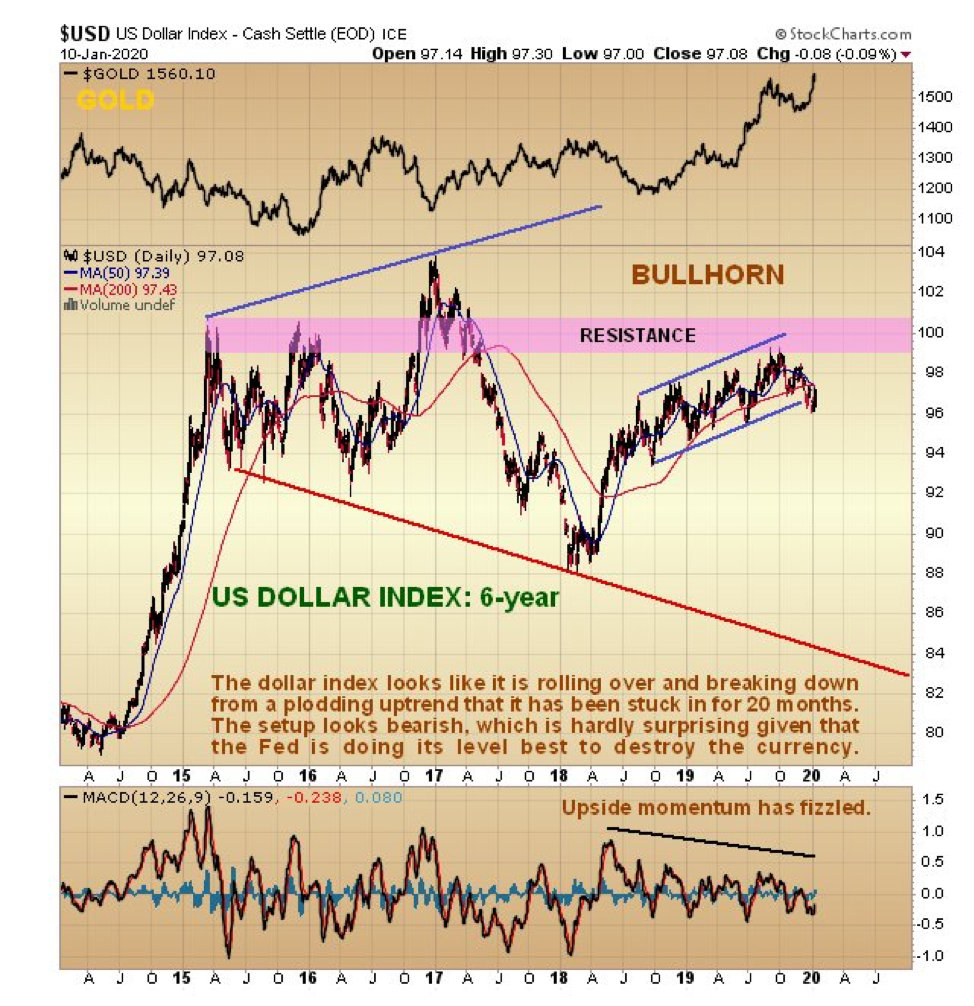
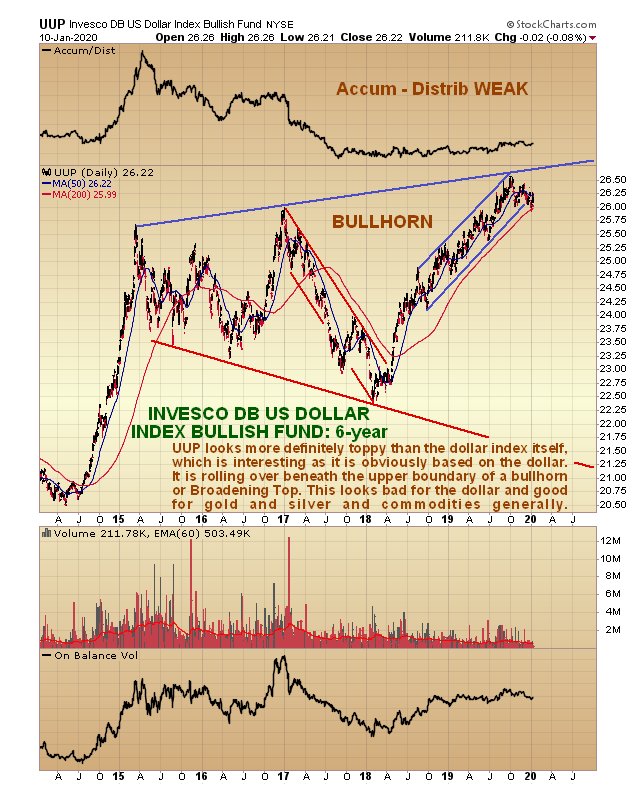
Now we turn our attention to the dollar, which is looking increasingly frail, as we can see on the latest 6-year chart for the dollar index. It is rolling over beneath resistance and appears to be breaking down from the 16-month gentle uptrend shown.
This is, of course, the main reason that gold, shown at the top of this chart, has been breaking higher again. If it fails to hold up here it could be targeting the lower boundary of the bullhorn pattern, which would involve a heavy drop from the current level that would “light a fire” under the precious metals, and many other commodities, notably copper.
A chart that really gives the game away and calls time on the dollar is the 6-year chart for dollar proxy UUP. As we can see, unlike the dollar index itself, this has risen up to the upper boundary of its giant bullhorn pattern, and appears to be on the point of breaking down. Its accumulation line has been very weak. This chart suggests that the dollar could be in for a very rough ride before long, which is hardly surprising considering the lengths to which the Federal Reserve is going to destroy it. While other countries and trading blocs, most notably the European Union (EU), are making a valiant attempt to destroy their own currencies, they will be hard put to keep up with the Fed.
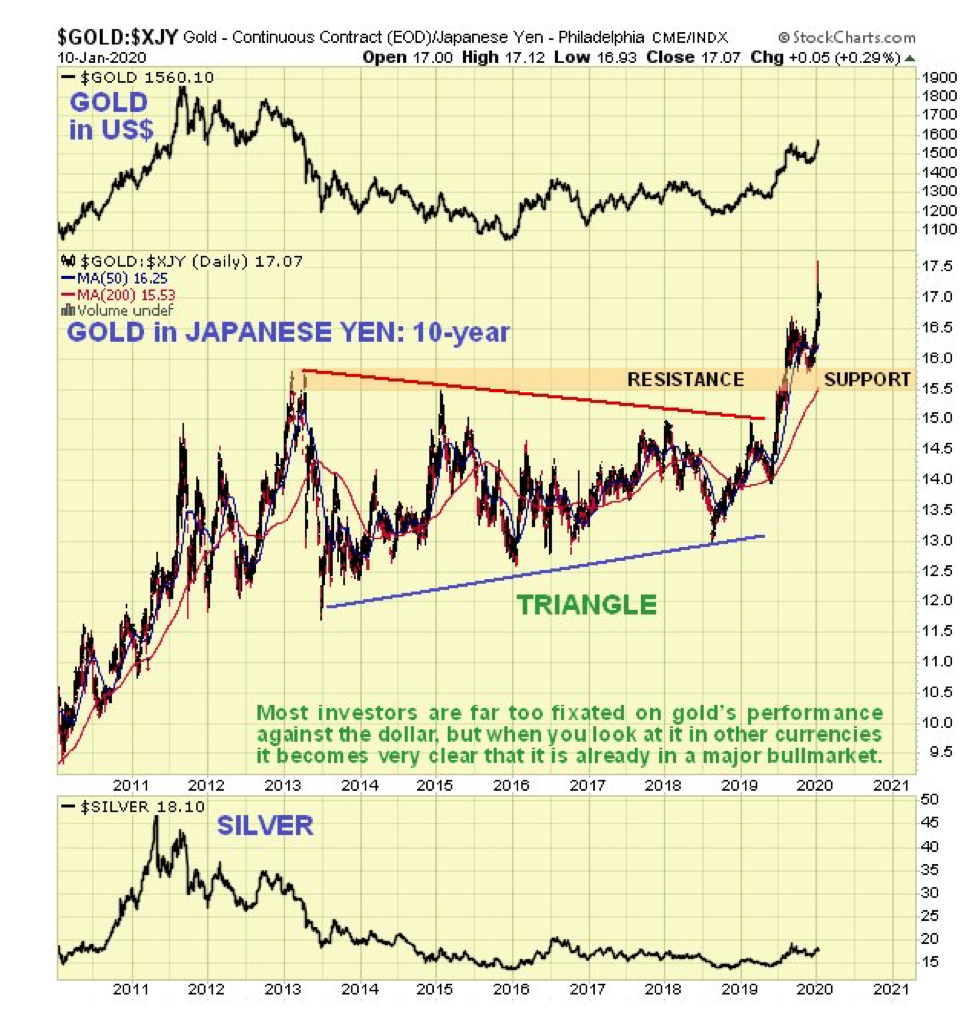
And now, for the benefit of anyone who still doubts that gold is in a bull market, I have pleasure in presenting the following 6-year chart for gold against the Japanese yen.
Still think gold might be in bear market? Nodidn’t think you would.
Although you can never be 100% sure of anything with these smaller issues, I am sure that you will agree with me that this chart is not suggestive of a sector that is going anywhere but up.
Conclusion Although last week’s reversal candle and the current rather extreme COT structure mean that gold may react back more near term, the overall picture is strongly bullish, which is hardly surprising as the fiat money system is fast approaching its nemesis, with the line of least resistance leading to hyperinflation. Our general approach, therefore, is not to sell PM sector investments, except on a case-by-case basis where they become critically overbought, but instead to buy or add to positions on dips.
Article originally published on CliveMaund.com on Sunday, Jan. 12, 2020.
Clive Maund has been president of www.clivemaund.com, a successful resource sector website, since its inception in 2003. He has 30 years’ experience in technical analysis and has worked for banks, commodity brokers and stockbrokers in the City of London. He holds a Diploma in Technical Analysis from the UK Society of Technical Analysts.
Disclosure: 1) Clive Maund: I, or members of my immediate household or family, own shares of the following companies mentioned in this article: None. I personally am, or members of my immediate household or family are, paid by the following companies mentioned in this article: None. My company has a financial relationship with the following companies mentioned in this article: None. CliveMaund.com disclosures below. I determined which companies would be included in this article based on my research and understanding of the sector. 2) The following companies mentioned in this article are billboard sponsors of Streetwise Reports: Metallic Minerals. Click here for important disclosures about sponsor fees. As of the date of this article, an affiliate of Streetwise Reports has a consulting relationship with Metallic Minerals. Please click here for more information. 3) Statements and opinions expressed are the opinions of the author and not of Streetwise Reports or its officers. The author is wholly responsible for the validity of the statements. The author was not paid by Streetwise Reports for this article. Streetwise Reports was not paid by the author to publish or syndicate this article. The information provided above is for informational purposes only and is not a recommendation to buy or sell any security. Streetwise Reports requires contributing authors to disclose any shareholdings in, or economic relationships with, companies that they write about. Streetwise Reports relies upon the authors to accurately provide this information and Streetwise Reports has no means of verifying its accuracy. 4) This article does not constitute investment advice. Each reader is encouraged to consult with his or her individual financial professional and any action a reader takes as a result of information presented here is his or her own responsibility. By opening this page, each reader accepts and agrees to Streetwise Reports’ terms of use and full legal disclaimer. This article is not a solicitation for investment. Streetwise Reports does not render general or specific investment advice and the information on Streetwise Reports should not be considered a recommendation to buy or sell any security. Streetwise Reports does not endorse or recommend the business, products, services or securities of any company mentioned on Streetwise Reports. 5) From time to time, Streetwise Reports LLC and its directors, officers, employees or members of their families, as well as persons interviewed for articles and interviews on the site, may have a long or short position in securities mentioned. Directors, officers, employees or members of their immediate families are prohibited from making purchases and/or sales of those securities in the open market or otherwise from the time of the interview or the decision to write an article until three business days after the publication of the interview or article. The foregoing prohibition does not apply to articles that in substance only restate previously published company releases. As of the date of this article, officers and/or employees of Streetwise Reports LLC (including members of their household) own securities of Metallic Minerals and Coeur Mining, companies mentioned in this article.
Charts provided by the author.
CliveMaund.com Disclosure: The above represents the opinion and analysis of Mr Maund, based on data available to him, at the time of writing. Mr. Maund’s opinions are his own, and are not a recommendation or an offer to buy or sell securities. Mr. Maund is an independent analyst who receives no compensation of any kind from any groups, individuals or corporations mentioned in his reports. As trading and investing in any financial markets may involve serious risk of loss, Mr. Maund recommends that you consult with a qualified investment advisor, one licensed by appropriate regulatory agencies in your legal jurisdiction and do your own due diligence and research when making any kind of a transaction with financial ramifications. Although a qualified and experienced stock market analyst, Clive Maund is not a Registered Securities Advisor. Therefore Mr. Maund’s opinions on the market and stocks can only be construed as a solicitation to buy and sell securities when they are subject to the prior approval and endorsement of a Registered Securities Advisor operating in accordance with the appropriate regulations in your area of jurisdiction.
By Orbex – Trading gold on MetaTrader 4 is pretty easy, in terms of the practical procedure of entering and exiting the market.
It’s virtually identical to trading currencies, which is why a substantial amount of Forex traders also trade/invest in gold from the comfort of their trading platform.
There are details that vary from broker to broker, such as margin levels. Some FX brokers have different margin requirements for precious metals, for example.
However, the basics of operating MT4 when trading gold are pretty much the same. Mind you, this is about how to open and close trades. Developing a trading strategy for gold is an entirely different (and much broader) subject!
Options Available on the Platform
Most Forex brokers offer two types of gold that you can trade: exchange and spot.
What’s the difference? In terms of price and how you trade, not much. But they do imply some differences in your strategy. They are:
Spot (usually under the symbol GOLD), refers to the spot price of the metal on the commodity exchange. It’s quoted in dollars, and often the price people mean when they are talking about the price of gold
Exchange refers to a “cross” between gold and a currency, as if it were a currency pair. For example, XAU – the symbol for gold – quoted in euros (EUR) would be XAUEUR on your MT4 platform.
Note that the spot price of gold and XAUUSD is basically the same thing, and your platform might have either GOLD or XAUUSD.
Where is it?
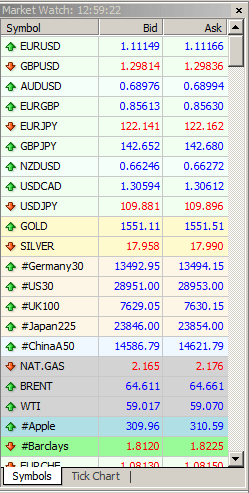
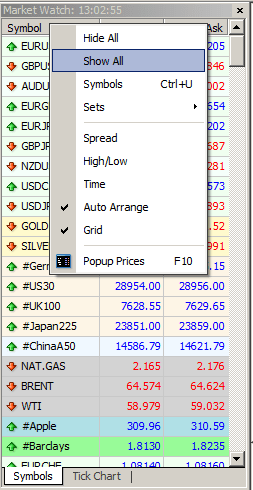
On the left hand of your MT4 screen, you should have a panel called “Market Watch” which lists all the instruments your Forex broker offers. In this example, in the middle, you can see the GOLD:
Sometimes not all the instruments available are listed, just the “most frequent”, and you might not see gold listed.
In order to see all of the options on the platform, you want to right-click on the top where it says “symbol” and then “show all” in the menu that appears like this:
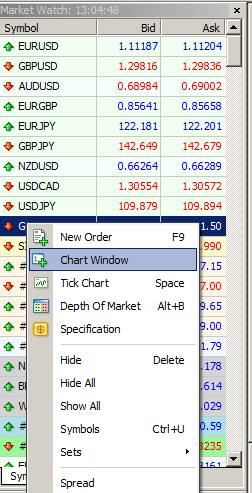
You can then scroll down until you find the version of gold you are looking for. Once you do, you’re going to want to open a chart, which you do by right-clicking on the instrument (GOLD, XAUUSD, depending on the listing), and select “open chart window” like so:
You can customize your chart just like you would with any currency pair, with the FX indicators you like, and other tools for technical analysis you might want to use.
Opening a Trade
Once you’ve done all the analysis you need to decide to enter the market, there are a couple of ways that you can trade on MT4. Note that these are all the same for currency trading.
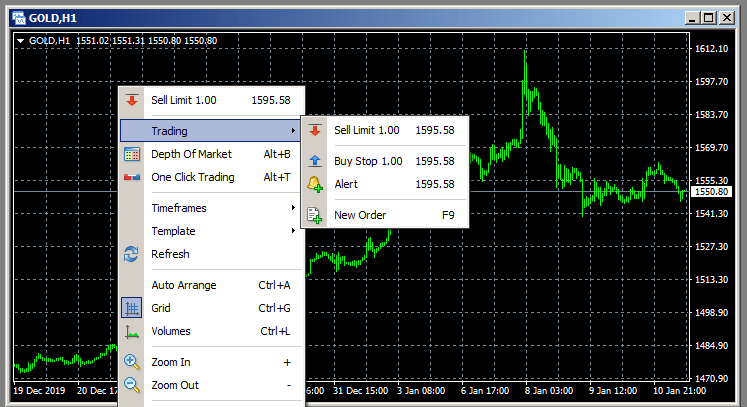
The first is by right-clicking on the chart itself, and from the menu that appears, select “trading” and from there “New order”:
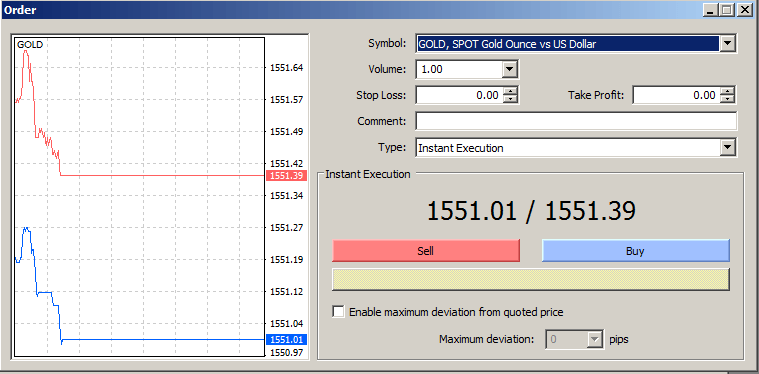
Alternatively, when you have the chart window you want to trade in open, you can press the F9 key on your keyboard, which will open up the trade panel:
Here you can choose the trade volume, set stop loss and take profit levels, whether you want to trade immediately or set a trade order for when the market reaches a certain level, etc.
After that, just click “sell” or “buy” depending on what your signal is telling you.
Bottom line, as you can see, trading gold on MT4 is just as easy as trading any currency pair you might already be used to.
Corporate earnings season kicked off with a bang on Tuesday as JPMorgan Chase & Co, Citigroup and Wells Fargo released their fourth-quarter earnings.
One would have expected lower US interest rates to impact profitability in the banking sector, as banks benefit from higher interest rates to charge more on loans. However, JP Morgan Chose posted profit and revenue that crushed analyst estimates. Fourth-quarter profit rose 21% to $8.52 billion while revenue climbed 9% to $29.2 billion compared with the $27.94 billion estimate.
Share of JP Morgan jumped over 1% as investors cheered the robust earnings with prices trading around $139.64 as of writing. The upside momentum could pave a way towards the all-time high of 141.10. A breakout above this level should open the doors towards $143.00.
Citigroup joins the party of outperformers
Citigroup shares jumped roughly 1% after the bank reported fourth-quarter earnings that beat profit and revenue expectations.
The bank posted a whopping 49% gain to fixed-income trading revenue, more than double the forecasted jump according to Bloomberg estimates. Fourth quarter revenues were $18.4 billion versus the $17.85 billion estimate while profits rose by 15% to $4.98 billion.
Focusing on the companies shares, prices are trading around $82.12 as of writing. A breakout above $82.50 should encourage a move higher towards $83.50 – levels not seen since the financial crisis.
Wells Fargo experiences painful Q4
It was not all roses and butterflies with Wells Fargo as the bank reported disappointing fourth-quarter profits and revenues.
Persistently low-interest rates and legal fees eroded earnings with quarterly profit reaching $2.87 billion, versus $6.06 billion a year earlier – representing a 53% decline. Wells Fargo shares tumbled as much as 3% on this report with prices trading around $50 as of writing.
Stocks are seen sinking lower towards $49 if a daily close below $49.70 is achieved.
Disclaimer: The content in this article comprises personal opinions and should not be construed as containing personal and/or other investment advice and/or an offer of and/or solicitation for any transactions in financial instruments and/or a guarantee and/or prediction of future performance. ForexTime (FXTM), its affiliates, agents, directors, officers or employees do not guarantee the accuracy, validity, timeliness or completeness, of any information or data made available and assume no liability as to any loss arising from any investment based on the same.
GBP has been back under selling pressure again this week as the latest data highlight further economic weakness.
Monthly GDP figures released yesterday showed the UK economy shrank by 0.3% in December. This was far worse than the expected 0% reading the market was looking for.
On an annual basis, the economy grew just 0.6%, marking its slowest pace of growth since 2012. Alongside this, manufacturing production came in at -1.7% over the month, versus an expected decline of -0.3%.
Carney Warns of Rate Cut Risk
The data comes just days after BOE Governor Mark Carney took traders by surprise as he warned that the BOE might be forced to cut rates, despite the UK PM agreeing on a Brexit deal.
Carney had previously said that the BOE projected that the UK economy would rebound firmly over 2020 as businesses and consumers reacted to the removal of uncertainty around Brexit.
However, speaking last week, Carney warned that such a pickup might not materialize. And, given the subdued growth seen in the economy, easing could be necessary.
January Easing Looks Likely
In terms of the timing of this easing, with Carney due to hand the BOE governorship over to Andrew Bailey in March, it looks increasingly likely that Carney could ease before then.
As such, there is now a heightened risk of a BOE rate cut at the upcoming January meeting. This would be ahead of the January 31st Brexit date, as leaving it until Bailey has taken over might be a little too long.
Some Hope For UK Economy?
It is worth noting that the GDP data refers to the final period ahead of the UK general election last month. Since then, there are some signs that the pickup is starting to take place.
The recent Services PMI reading came in at its highest level since 2018 last month. However, it was still only back at the 50 level. Looking ahead, there are fears that Johnson’s refusal to extend the UK/EU trade negotiations deadline of December 31st could fuel further uncertainty among businesses.
Johnson Under Pressure over Deal Deadline
Many names from across the political divide have expressed their view that eleven months is not long enough to agree on a trade deal.
This week, Conservative party grandee Peter Bottomley, Father of the House of Lords, warned that failure to agree on a trade deal with the EU could cause an economic contraction by as much as 10%.
Traders will be keeping an eye on the progress of talks going forward as well as for any signs that Johnson might shift his view on extending the deadline date if a deal does not look achievable in the current timeframe.
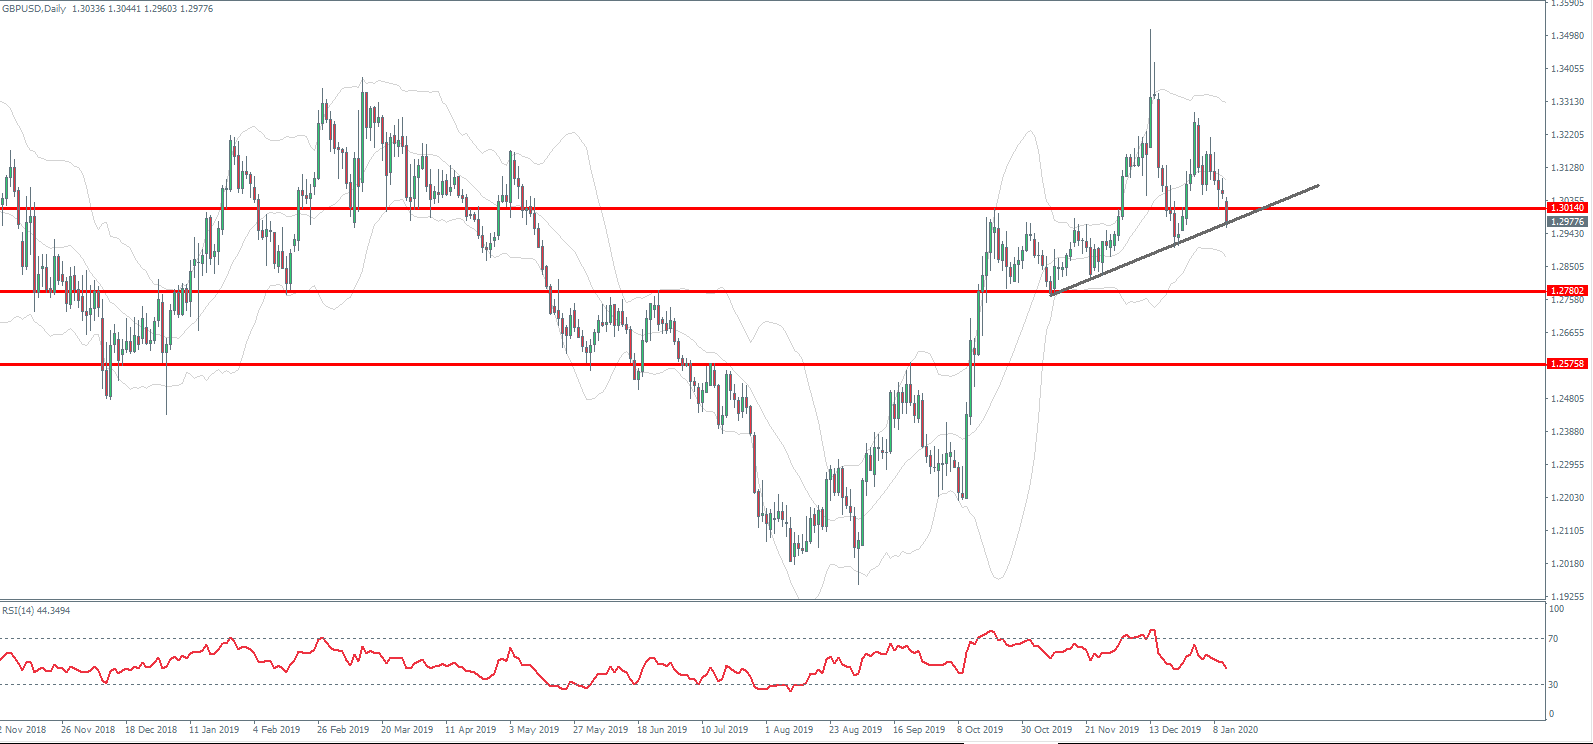
Technical Perspective
The reversal lower in GBPUSD looks close to confirming a lower high against the 1.35 post-elections high. Price has broken back below the 1.3014 level and is now challenging the local bullish trend line. A break here would put the focus on a move back down to the 1.2780 level next. Looking further out, price could trade down as low as the 1.2578 level which could be a potential right shoulder of a large, longer-term inverse head and shoulders pattern.
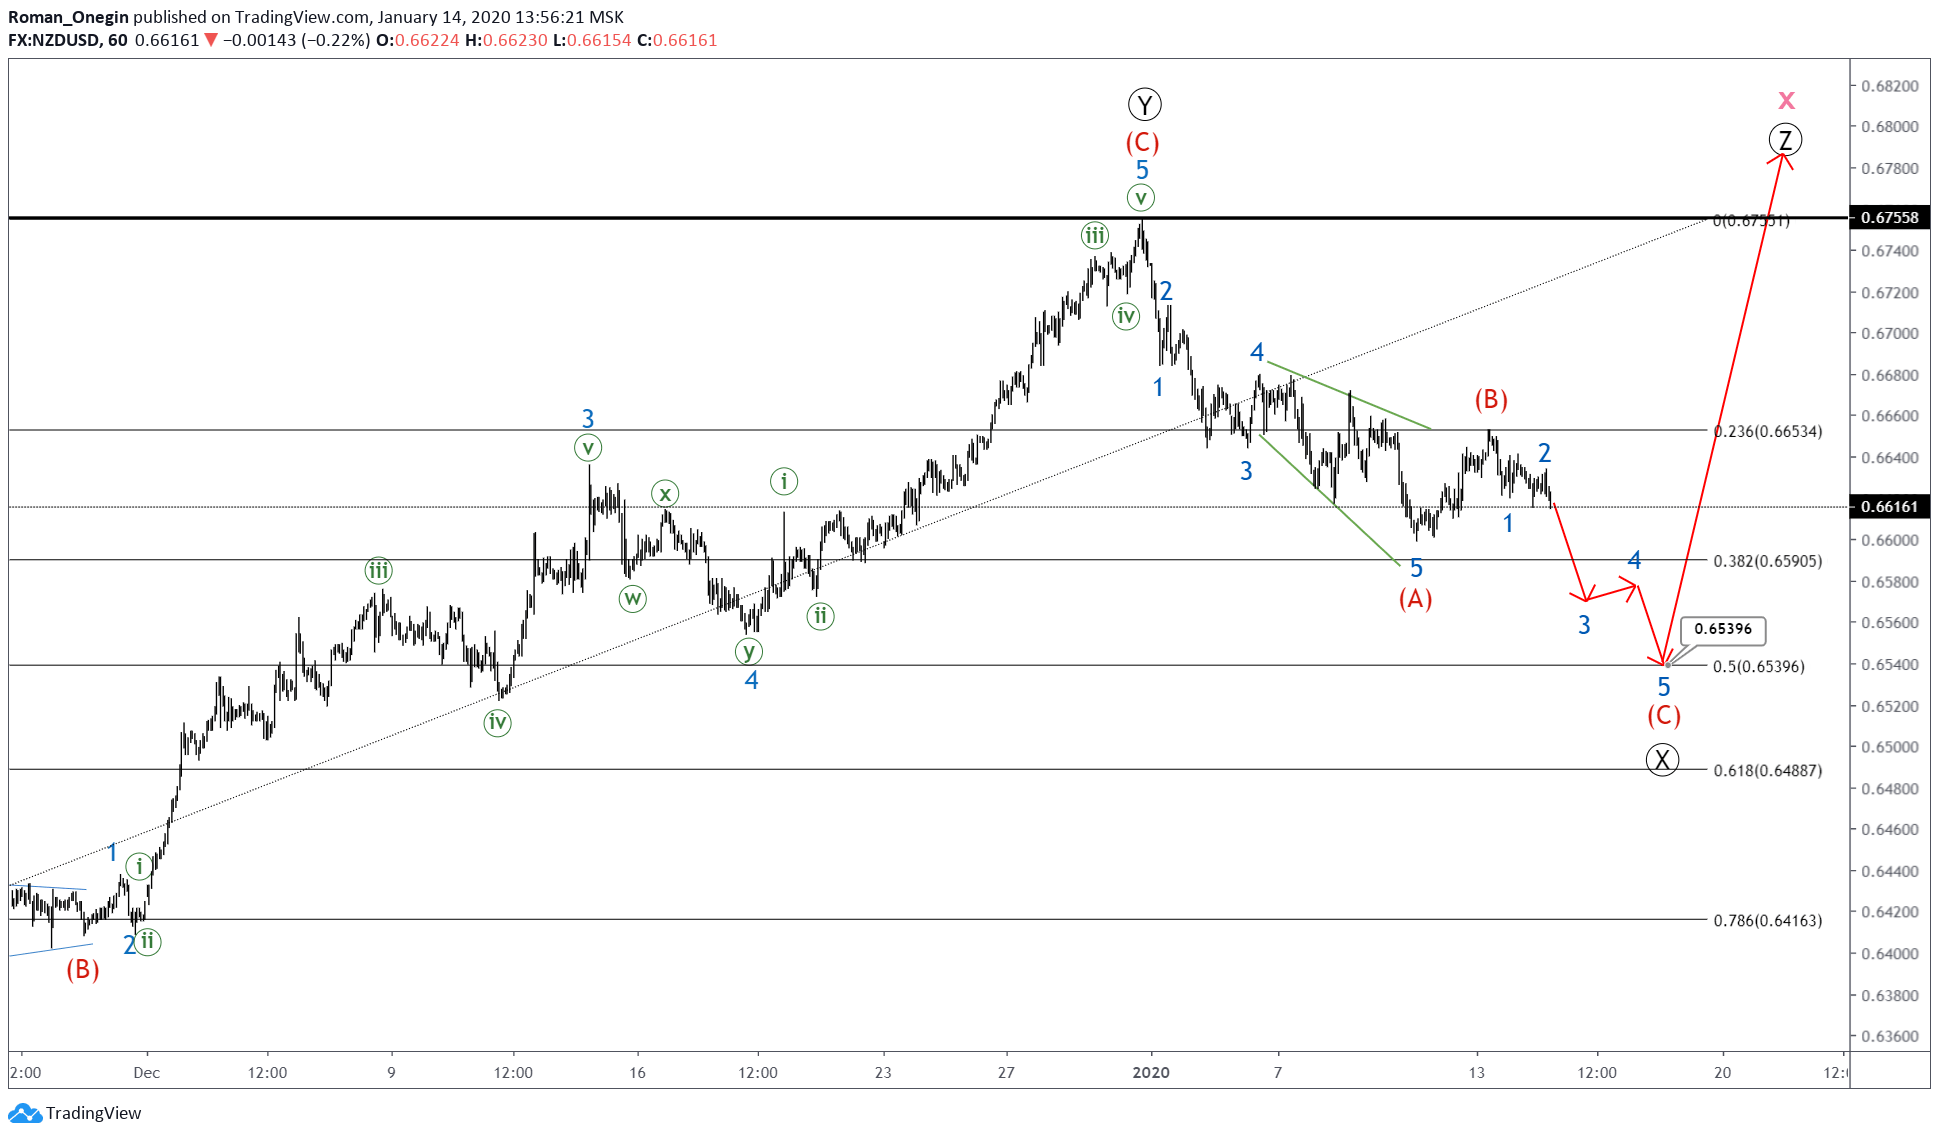
By Orbex – The current NZDUSD structure hints to a bullish combination consisting of primary sub-waves Ⓦ-Ⓧ-Ⓨ-Ⓧ-Ⓩ.
Wave Ⓨ looks fully completed, whereas Ⓧ is still under construction. That could be followed by wave Ⓩ.
The aforementioned scenario sees wave Ⓧ consisting of intermediate degree sub-waves (W)-(X)-(Y)-(X)-(Z).
If this pattern turns out to be validated, we could see a slight decline in the minor zigzag A-B-C near the 0.659 area. That level will be 38.2% retracement of the first intervening wave Ⓧ.
The closest alternative sees the current intervening wave Ⓧ as a standard zigzag, consisting of intermediate waves (A)-(B)-(C).
This scenario would have prices sliding lower in a bearish 5-wave impulse (C) near the 0.653 area. The target would respect the 50% Fibonacci retracement when comparing sub-waves Ⓧ and Ⓨ.
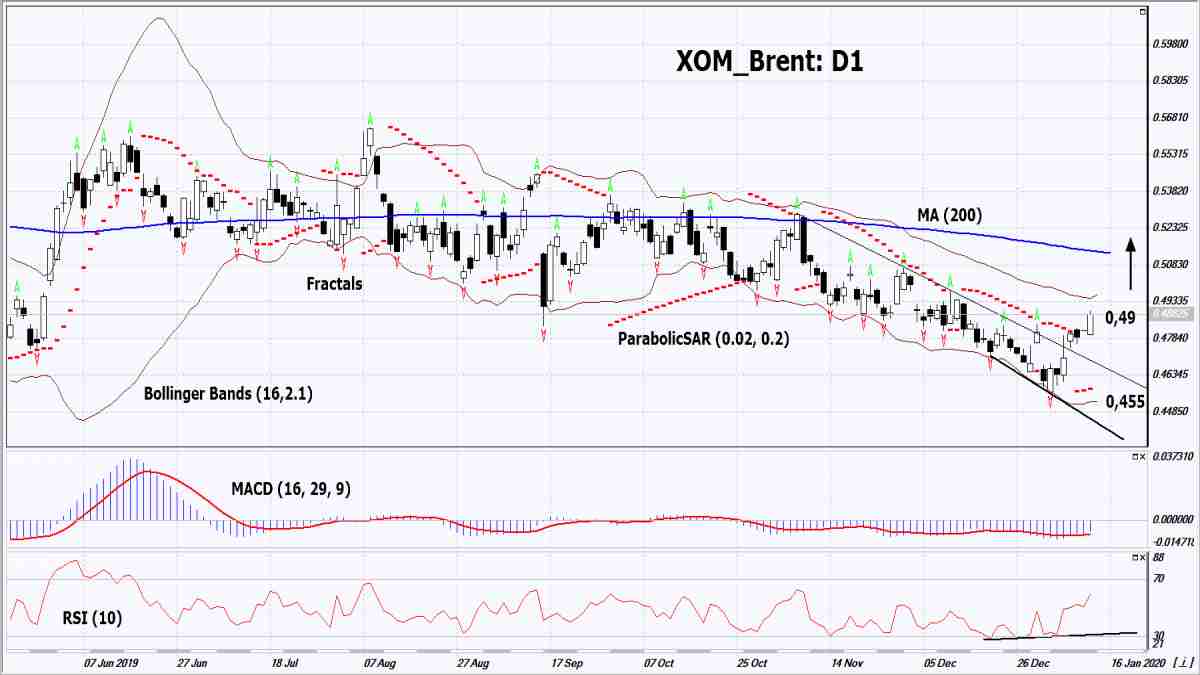
In this review, we suggest considering the personal composite instrument (PCI) XOM_Brent. It reflects the price dynamics of stocks of the US oil company Exxon Mobil Corporation against a physically delivered Brent crude oil futures contract. Will the XOM_Brent rise?
The growth of this PCI means that Exxon Mobil stock prices are rising faster than oil. In the last 9 months, they have strongly diverged in dynamics from the Dow Jones Industrial Average, which grew by 9.5%. At the same time, Exxon Mobil stocks fell by 13.5%. The main negative factor was the forecast of a decrease in operating results in the 4th quarter of 2019. To improve its financial performance, Exxon Mobil is going to sell low-return assets worth $25 billion by 2025. The funds will be used for capital investments in projects with higher profitability and payments to shareholders. Exxon Mobil’s dividend yield is 5% per annum. Oil prices, in turn, are falling due to subsiding tensions in the Middle East and a decrease in demand for gas in the United States. According to the U.S. Energy Information Administration, gasoline inventories reached a 4-year high last week. In 2019, car sales fell by 1.4% in the US, and by 8.2% in China. This may become a global trend and negatively affect oil prices.
On the daily timeframe, the XOM_Brent: D1 overcame the resistance line of the downtrend. A number of technical analysis indicators formed buy signals. The further price increase is possible in case of the improvement of the financial performance of Exxon Mobil and stagnation in the global oil market.
The Parabolic indicator gives a bullish signal.
The Bollinger bands have widened, which indicates high volatility. Both Bollinger bands are titled up.
The RSI indicator is above 50. It has formed a positive divergence.
The bullish momentum may develop in case XOM_Brent exceeds the last high at 0.49. This level may serve as an entry point. The initial stop loss may be placed below the last fractal low and the Parabolic signal at 0.455. After opening the pending order, we shall move the stop to the next fractal low following the Bollinger and Parabolic signals. Thus, we are changing the potential profit/loss to the breakeven point. More risk-averse traders may switch to the 4-hour chart after the trade and place there a stop loss moving it in the direction of the trade. If the price meets the stop level (0.455) without reaching the order (0.49), we recommend to close the position: the market sustains internal changes that were not taken into account.
Risk sentiment was in check on Monday as investors stay on the sidelines for global cues.
The US earnings report for the fourth quarter of 2019 is underway. Meanwhile, Washington announced that it will remove China’s label as a currency manipulator.
Investors see this as another positive move towards improving trade relations between the two economies.
EUR Gains on Weaker USD Despite Weaker German WPI
The German wholesale price index was flat for December. This pushed the WPI on a year over year basis to -0.1%. Besides the WPI data, economic data from the eurozone was sparse. The euro, however, brushed aside the data largely due to the weakness in the US dollar.
EURUSD Seen Retesting Resistance Level
The common currency was retesting the resistance level of 1.1131 level amid a quiet day from the eurozone. The consolidation that is taking place near the confluence of the trend line and the horizontal level indicates a possible breakout. The bias remains to the upside with the target of 1.1177.
Pound Falls on Carney’s Comments on Rate Cut
The British pound fell sharply on Monday following weak GDP data. For the month of December, the UK’s gross domestic product fell 0.3%.
The report sparked comments by BoE Governor Mark Carney who said that the next move by the BoE will be a rate cut. Investors are pricing in the possibility of a rate cut as early as the January monetary policy meeting.
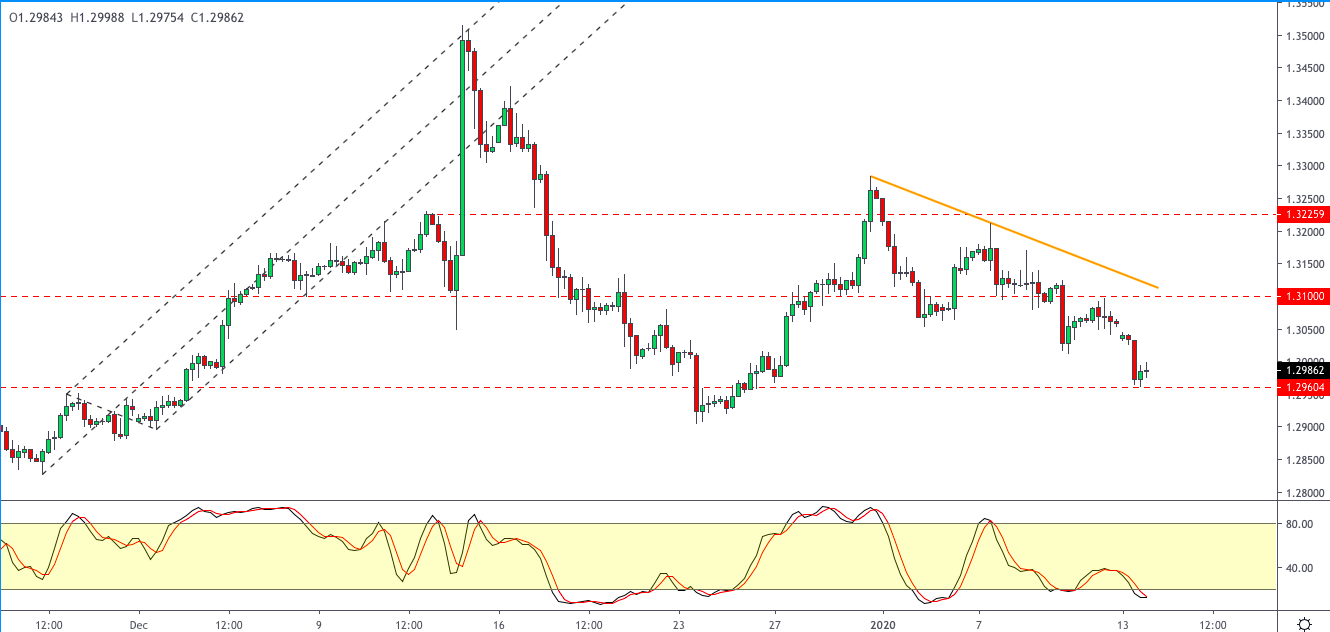
GBPUSD Slips to Lower Support
GBPUSD fell briefly to the 1.2960 level of support. This confirms the downside target of the descending triangle pattern. However, we expect a firm retest of the support level. There is a possibility that a rebound could see GBPUSD testing 1.3100 resistance.
Gold Prices Remain Flat as Investors Await Further Cues
The precious metal was trading weaker on Monday. Investors are waiting for further clues on the developments of the trade deal. The China GDP report and the US inflation and retail sales report will be the big-ticket items that will move markets over the week.
XAUUSD Downside is Increasing
The current price action is consolidating near the current levels amid the lower high forming. Price action is trading slightly above the minor support of the 1546 level. A breakdown below this level will accelerate the decline to the 1534 level of support.